


VantagePoint AI Market Outlook for the Week of September 16, 2019
The VantagePoint AI Market Outlook is designed to help traders. It’s important to remain aware of correlations in the global markets. Traders can become more profitable if they know how to get ahead of the trends. Utilizing the predictive indicators in VantagePoint Software can help traders find the right trades and the right times. Above all, traders know when to enter and exit those trades for maximum profit. Let’s look at the charts for the U.S. Dollar, Gold, Crude Oil, The Stock Market, and Major Pairs.
VIDEO TRANSCRIPT
Hello everyone and welcome back. My name is Greg Firman and this is the VantagePoint AI Market Outlook for the week of September the 16th, 2019.
The U.S. Dollar
Now to get started this week, we’re going to begin where we always do with that very important US dollar index, but we will be looking at all the major markets in this particular outlook, and what we potentially could look to expect for next week. Now as we start with the US dollar index, we can see that the dollar index remains under pressure despite some of these wild spikes that we’ve seen after the ECB and some of the economic data, the dollar still remains structurally weak. Now we could see a boost in the dollar demand leading up to the FOMC and potentially even after, but a very serious event risk that we don’t want to take lightly, this Fed cannot be trusted. We don’t know for sure what they’re going to do or what they’re going to say, so we should be expecting the unexpected in my respectful opinion.
Now again, the structural bias of the dollar is still remains low, but we don’t have momentum pushing down below that 40 level on the predicted RSI. So we’re going to continue to monitor this, but I believe the dollar will remain sideways going into the FOMC. We do have very strong, verified support at the 97.58 area. That support would go all the way down to these lower levels, but if we start to break down below 96.69 we should expect a much bigger sell off in the US dollar, and that could very well be triggered by the FOMC. Now, how this relates to gold, surprisingly gold is struggling here also, but that’s because of the unknown going into the Fed announcement.
The Gold Market
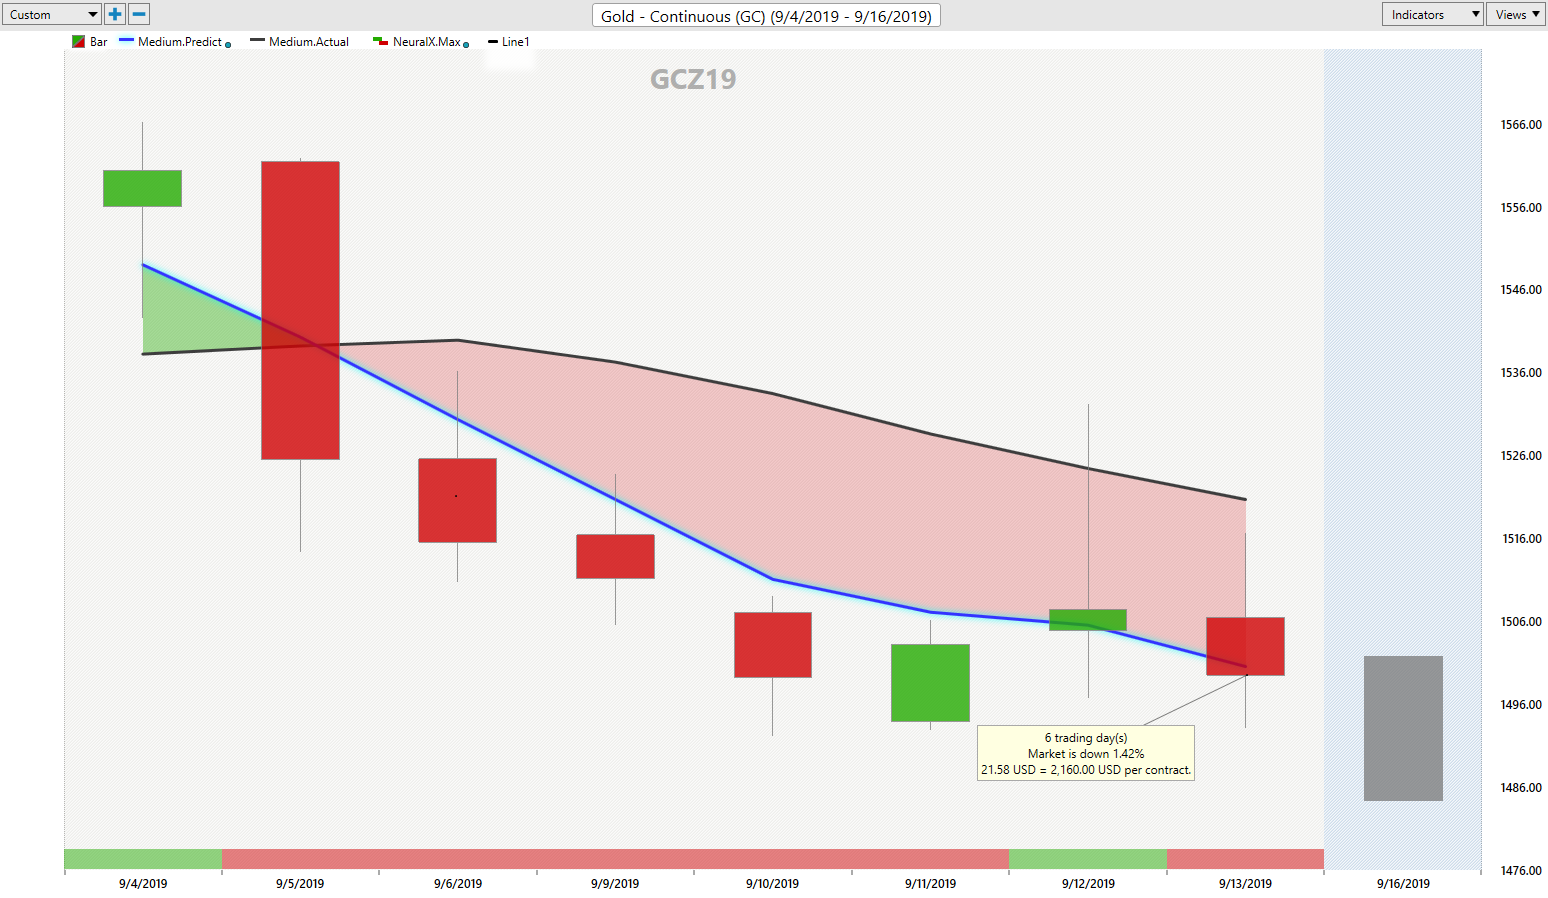
I believe that gold will recover after the FOMC, but probably not before. We’re likely going to see gold slightly weak leading up to Wednesday and then it should recover. We can see our medium-term crossing our longterm predicted differences struggling here, but it is warning us of a potential reversal. We’ve got heavy support sitting, starting basically at 14.88 but the bigger channel support coming down into this low area around 14.12. I don’t think this area is going to be tested anytime soon, but it could. But again, one could also argue that basically gold is hanging on the edge of a cliff here and it could be getting ready to go lower. Now I would agree with that analysis if not for the VantagePoint, medium term, longterm predicted difference cross warning us that we’ve moved into an oversold condition and we should expect a bounce.
S&P 500
Now with the S&P 500 going into next week’s trading, we’re back up approaching this major all time high, but a a very significant resistance area. Brokers love to run stops on both the downside and the upside. What I tell my own direct clients is that the market must move higher before it moves lower and it must move lower before it moves higher. Now, a lot of this is being the trade, tariffs have been delayed for two weeks. But remember guys, just because we don’t have any bad news doesn’t mean we have the the presence of good news. Nothing is changed in this particular … In the trade war or any of these things. Our medium term crossing, our longterm predicted difference, we’ve got an RSI that’s losing momentum in an overbought condition. The likelihood that we have a significant failure soon is very likely. If we want to check the seasonality using the VantagePoint software, that’s very easy.
Crude Oil
We go back to one year and we can see that in most cases the stock market significantly fails at the end of September. Somebody out there, I was advised that we’re seeing a number of people buying significant October calls on the VIX, which is another leading indicator that the market is expecting a crash here. So we could make another still remains high. But again, every time we’ve made a new all-time high, we’ve had a significant failure rate afterward. And that’s the classic case of buying the rumor, selling the fact. So we’ll continue to watch this. But again, when we look at all of the major market analysis here, we can see that oil is already selling off. We were looking at this in the VantagePoint, live training room this week, shorting that thing up around that 58 mark, 57.90 and it’s moved lower. The correlation between oil and the S&P 500 is a very powerful one. So oil likely a leading indicator.
If we also look and work in just by going back one year in our software and look at that seasonality one year ago, you can see that oil was a leading indicator of the stock market crash. And it wasn’t necessarily a crash guys, let me correct myself there. It’s a significant sell-off right. The S&P absolutely recovered, oil recovered, but that wasn’t until the latter part back, as we moved back towards January. So again, we want to watch these things very closely. The direct inner market correlations guys, they are leading indicators, not lagging.
Forex Weekly Outlook for Major Pairs
Euro/U.S. Dollar (EUR/USD)
Now, pretty much a wild week for the Euro. But guys, this is once again the power of the verified zones. We have this verified zone that comes down in at about the 109. 26 area. The Euro came down, kissed that level to almost the exact number, and then rallied up almost 150 pips. That’s a very significant move in the Forex market. The leading indicator there was the medium-term crossing the longterm predicted difference, but we don’t have a lot of momentum, upside momentum in the Euro. We’ll see what the FOMC does this week, but right now the structural bias for the Euro is still, believe it or not, long despite a very dovish ECB, quantitative easing, lower rates, all of these things. But just remember guys, currencies like the Japanese yen, very low-interest rates, the Swiss franc, these are some of the strongest currencies in the Forex market, right? So fundamentals very seldom work in trading guys, advanced inner market technical analysis always has a leading edge.
U.S. Dollar/Swiss Franc (USD/CHF)
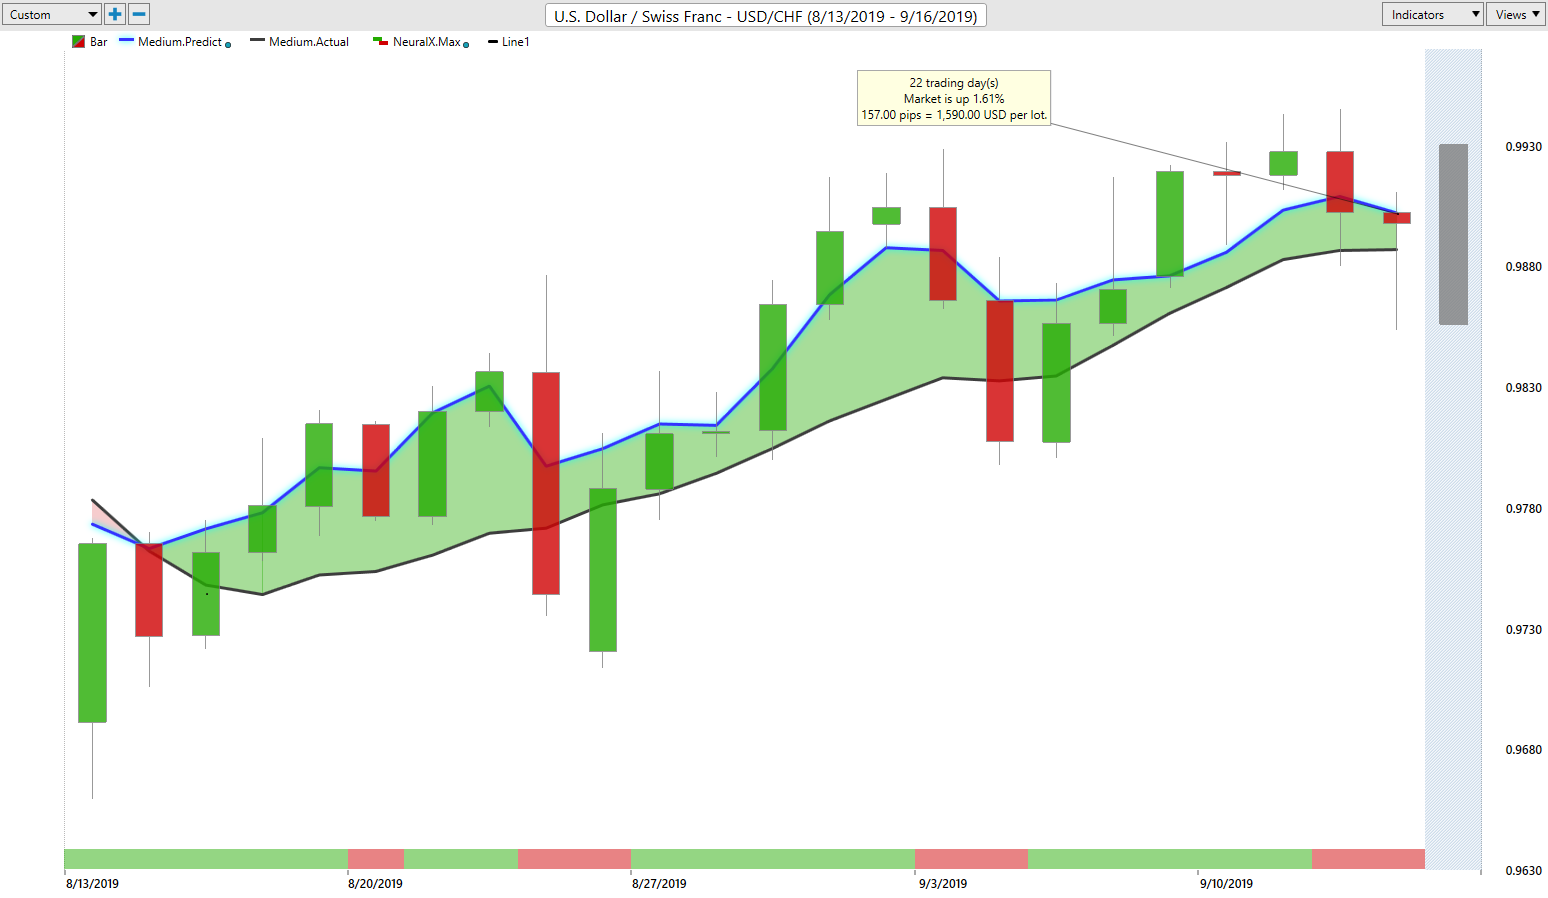
Now as we look at that US, Swiss Franc, again, when we look at the Swiss Franc, US, Swiss Franc a little closer, once again, we’re approaching these verified zones between the high of 99. 29 and this additional verified rezone zone at 99.74. This has proven to be a very strong sell zone here. As long as these areas hold, the equity market sell off, US, Swiss Frank is also likely to move lower. We can see the predicted RSI starting to turn lower, the Neural Index down, but we want to see a close below the VantagePoint key level at 98.75 to really get this particular pair moving.
British Pound/U.S. Dollar (GBP/USD)
Now with the pound, dollar for next week, the pound, again, very, very volatile here guys with the Brexit news. What we have to be careful going to next week is again looking at these verified zones. They’re coming at the high of 125.58. Now if the pound, the dollar is going to fail, it’s going to be around this area or slightly above it. Be very careful of a bull trap up here. That’s all I can warn you. I’m not saying it’s not going to go higher here. I’m just saying this is a classic setup for a bull trap. Now if Brexit calms down and the Fed gets very dovish the pound, dollar should easily accelerate towards the 128 area. The indicators from VantagePoint are saying we’re still moving higher, but again, when we’re looking at price action trading, we never want to discount these levels. Again, we’ve got the high up to 125.79 be very cautious with longs in this particular area and we want to watch that medium-term crossing the longterm predicted difference in the Neural Index to warn us ahead of time that this is going to fail.
U.S. Dollar/Japanese Yen (USD/JPY)
Now with the dollar, yen, once again guys, we are moving towards a well known verified zone at 109.31. The probability that the dollar, yen fails between the current price at 109.30 is about 80%. it’s very, very strong. Our medium-term crossing, our longterm predicted difference, I believe, I respectfully believe that VantagePoint already gave us the indicator we needed to short this thing. But when Trump announced he was going to delay the tariffs a couple of weeks, the equity markets got a boost and the inner market correlation pushed the dollar, yen up. But remember the dollar, yen has very little exposure to the actual US dollar anymore. China and Japan settle their trade balances in their own local currencies, so the dollar demand is no longer there. So if the equity markets follow the seasonality and they go lower, the dollar, the yen will crash also. This could be setting up in the next couple of weeks or potentially even next week for a very substantial short trade. So keep an eye on this and be prepared to short as close to this 109.30 area as possible.
The Commodities Currencies
U.S. Dollar/Canadian Dollar (USD/CAD)
Now as we move into our three main commodity currencies, once again here guys, the major market pundits are calling for the US CAD to finish the year around the 130 area. But here’s the thing, if we go back and just use our software to look at the seasonality, the Canadian dollar is usually at its weakest from October into basically you can see the seasonality last year into basically December. So when I look at this with my own direct clients, I’ve advised them we have only been going long on actually on the dollar on US CAD despite what the market pundits are saying. We can connect the dots to this verified support zone down at 131.05. We came down to that area, didn’t quite get to it and then just basically had a significant 200 PIP rally off that 131 area.
And again, this is the power of AI, the power of the verified zones, combining that with the VantagePoint indicators. The medium-term crossing, the longterm predicted difference is very seldom wrong. There is no perfect indicator, but this is one of the best here guys. And when we combine it again with these verified zones, despite what these pundits are saying, we can look at our VantagePoint software with our additional indicators and say, look, I don’t … If they want to go short and they want to target 130 that’s fine. But the VantagePoint, AI software is not supporting that move. So if I have to choose between a talking head on TV or on some website or the power of AI based on the correlation to 31 other markets, I think I’m going to lean towards the AI, wouldn’t you? So when we look at this right now, we should be able to target this upper level in this 133.82 area.
Now, this is, the main driver of this guys is not any of the conventional indicators. It’s the inner market correlation to oil. So when oil basically sold off, which we predicted in the live training room, I immediately pointed the room to longs on the US, Canada. Not shorts, and made this same argument that if oil is about to crash, the US CAD will be unable to move lower. It’s actually going to move higher. That’s come to fruition. Now again, we are still locked in a very strong channel between 130, basically the 134 area and the 131 area. So we can’t rule out the possibility of a short up around 134. But just be very, very cautious going into next week. The reason I say that you ask because the reason is the other commodity currencies are showing a very similar signal. We’ve got the medium-term crossing, the longterm predicted difference. You can see that we have basic resistance building up here around this 69 area, so this thing needs to get moving to the upside guys or it’s going to short or it’s going to go lower. Excuse me.
Australian Dollar/U.S. Dollar (AUD/USD)
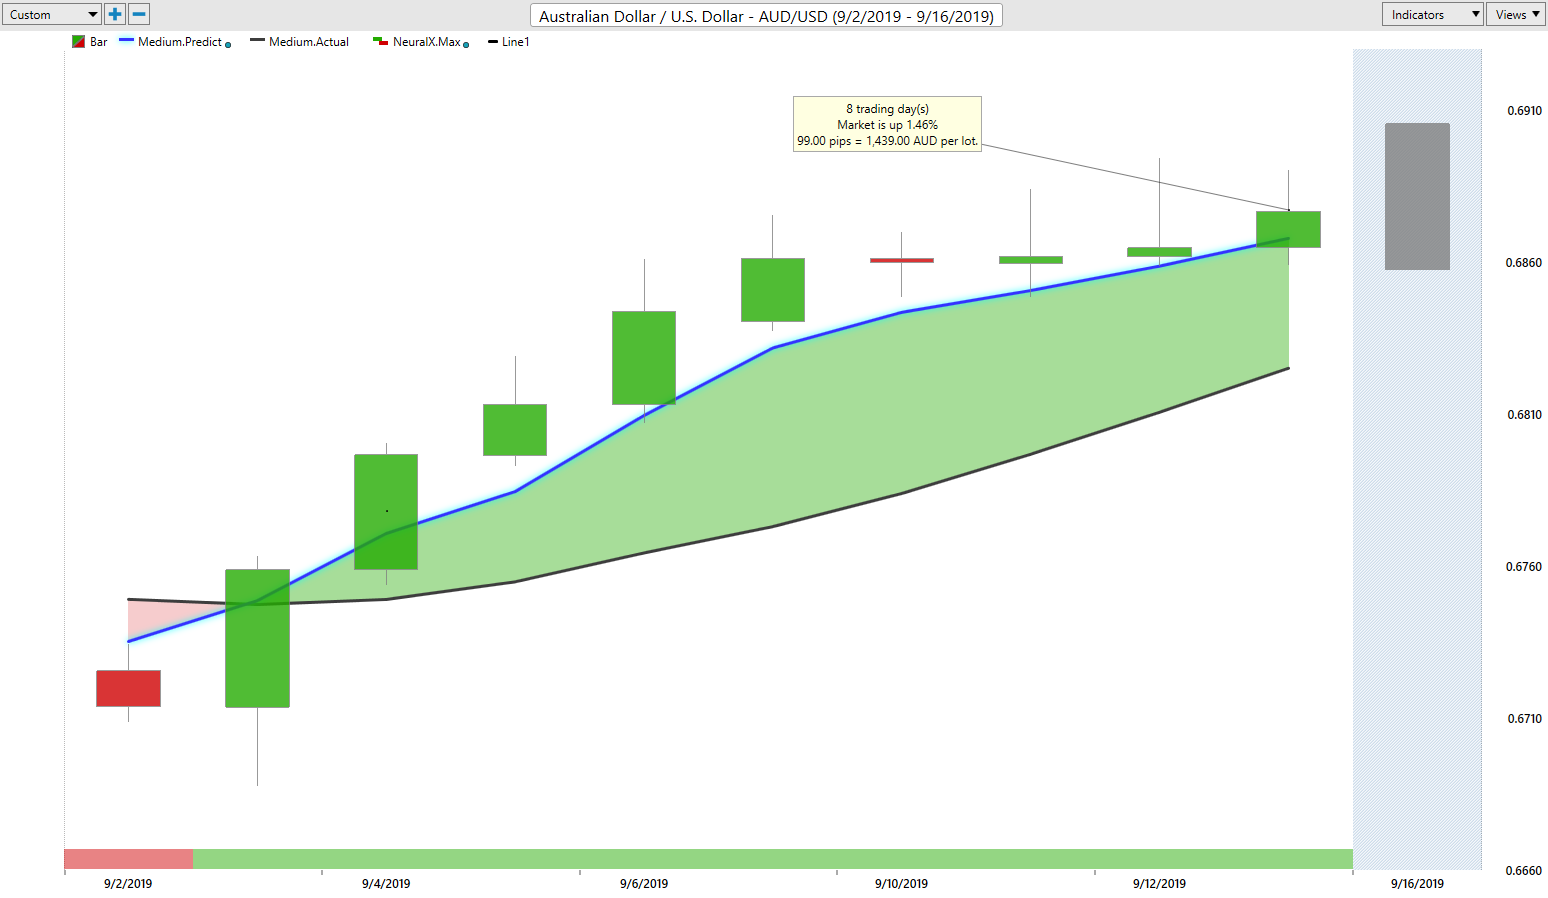
So if the Neural Index turns from green to red, that could be the cue we’re looking for. We’re already in a grossly overbought condition at 92.1 on the predicted RSI. And again at the Tampa seminar, I showed everybody how to adjust the RSI to get this kind of reading, moving it down to a 9 period, and using a 60-40 split to shore momentum. You can see the momentum of the RSI is at break 60 and we’ve got a verified zone down here. That was a very nice rally on this, but that rally is starting to look a little bit tired. When we compare that to New Zealand, we see the exact same thing. A very tight verified zone that comes in at 64.44 that’s basically our cell area, but this looks to be get gathering strength for a move lower.
New Zealand Dollar/U.S. Dollar (NZD/USD)
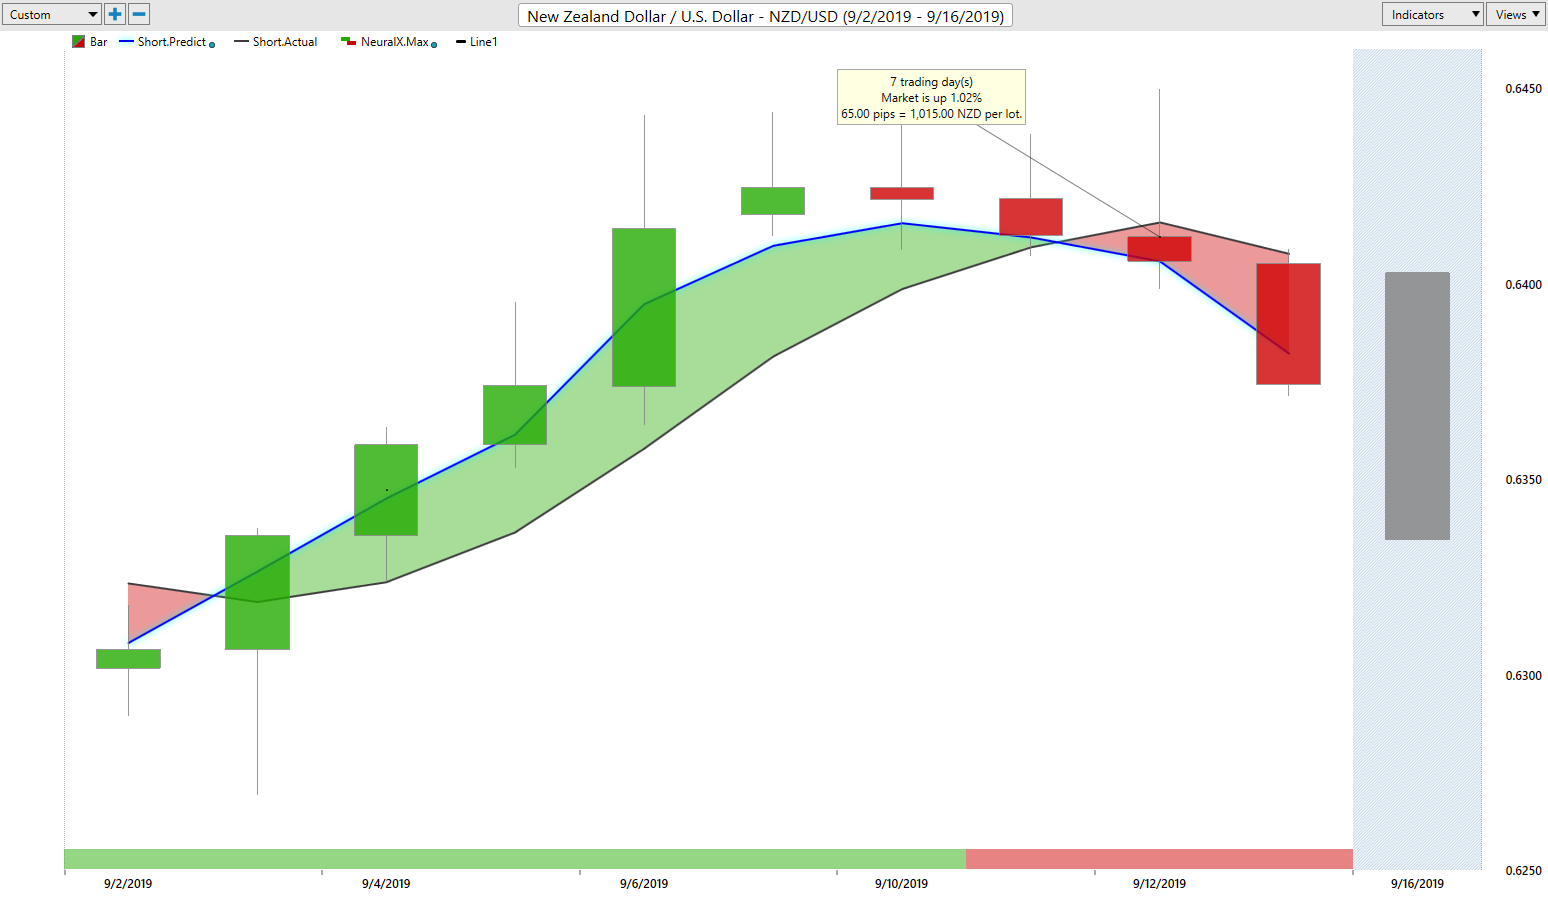
Now again, we can’t break through here. We’re closing below that key level of 63.94. Our Neural Index, our predicted differences, our RSI, all of this section of indicators that I’m looking at here, if I just highlight this for everybody, we’ve got everything basically we need. We’ve got a verified zone, we’re breaking below. We’ve got our medium-term crossing, our longterm predicted difference and we’ve just breaking below the 40 level. Watch out for a fake price on Monday, guys, and look for a potential short going into Tuesday. Remember, Monday is not a true price in any of the markets you’re trading, whether it be stocks, commodities, currencies, it’s not a true price. On Tuesday you will see that true price. And again, patience is what most people are lacking and trading. If your patient, good things will happen.
So with that said guys, this is the VantagePoint AI Market Outlook for the week of September the 16th, 2019.


