


VantagePoint AI Market Outlook for the Week of September 2, 2019
The Vantagepoint AI Market Outlook is designed to help traders. It’s important to remain aware of correlations in the global markets. Traders can become more profitable if they know how to get ahead of the trends. Utilizing the predictive indicators in VantagePoint Software can help traders find the right trades and the right times. Above all, traders know when to enter and exit those trades for maximum profit. Let’s look at the charts for the U.S. Dollar, Gold, Crude Oil, The Stock Market, and Major Pairs.
VIDEO TRANSCRIPT
Hello, everyone, and welcome back. My name is Greg Firman, and this is the VantagePoint AI market outlook for the week of September 2nd, 2019.
The U.S. Dollar
Now, to get started this week, we’re going to begin where we always do with that very important U.S. Dollar Index. We can see that the dollar is rallying on Friday in thin illiquid markets. Now, with the absence of bad news does not mean we have the presence of good news in my respectful opinion regarding the trade war and a number of other issues here. So it’s very unlikely that the dollar is going to hold onto these gains as we start to move into the first week of trading, coming out of that a very thin summer trading, very volatile summer trading.
So when we look at this right now, we do have a very weak buy signal on the dollar here as we move into an overbought condition. Again, I cannot stress enough in holiday thin illiquid markets, eight out of 10 times here, guys, it’s not a true price. So I would expect this move to continue into Tuesday trade and then on Wednesday, we are very likely to see a reversal. Now, the critical level to watch on the dollar right now is the 97, 99 area. A retracement to this particular area is very likely. Now, we can also see that we have very strong verified resistance up above these levels as we come back. The dollar basically running on about a two-year high here.
But when we look at this closer, there are far more negatives than positives for the U.S. dollar at the current time. As we know with the seasonality, and what I mean by seasonality is monthly patterns, is that the dollar is normally strong in the first week of the new month only to turn around and sell off very shortly there afterwards. We can see that with these verified zones.
The Gold Market
Now, the strength in the dollar is putting downward pressure on gold. We’re unable to break through a very strong resistance zone here that’s coming in at around 1565, but we are continuing to make new highs. That’s the main thing we want to understand here.
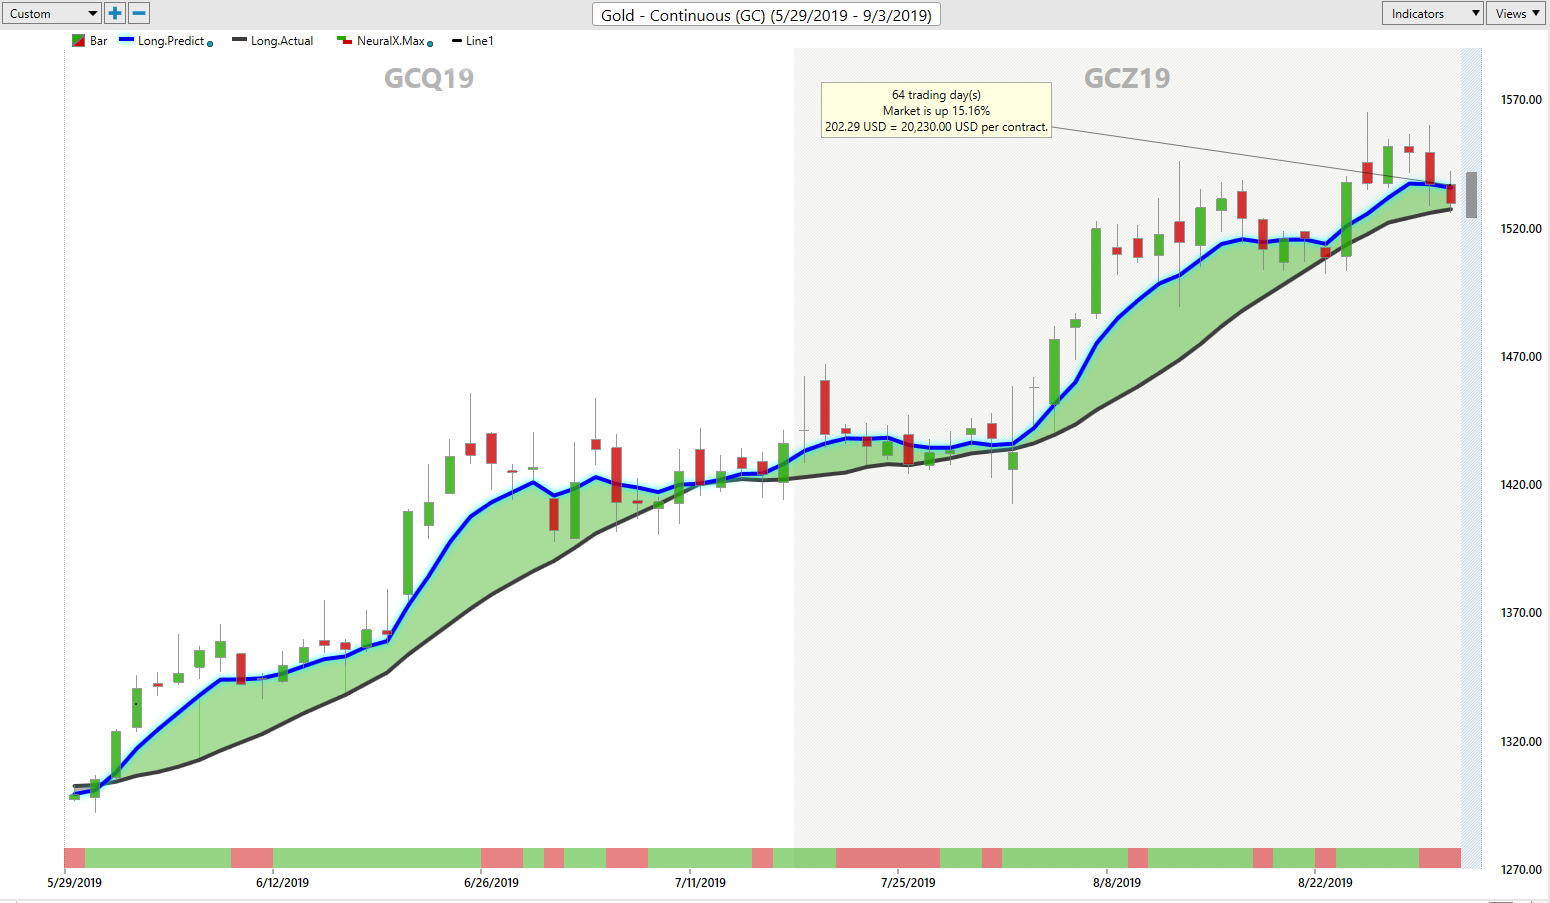
Now, when we look at the TCross long, 1517, we’re still closing above this level. But we also have very, very strong verified support to 1502. We’ve got additional support at 1488 and very, very strong support down here at or about this 1450 area. I would anticipate all of these… well, these lower levels, at the very least, to hold as we start ratcheting up the trade war starts heating up again. All of these things are positives for gold and negatives for the U.S. dollar.
S&P 500
Now, as we look at stocks here. Stocks at the first glance here tend to look mildly bullish, but we can see that we’re failing at this verified resistance zone yet again. Now, we can assess here that I’ve put this line of resistance on price action here, but this is not just about this year, guys. When we go back from one year to the date, we can see that the S&P 500 really has done nothing since last year. If you bought or sold this last year at this particular time, you’re down a little bit or slightly at break even. So not exactly a bullish setup here for the equity markets. When we look at it down here on the lower end of the support side, again… The only thing I can say about these stocks here, guys, is, again, the absence of bad news does not mean that we have good news or this is somehow positive for the equity.
So when we look at this closer, again, this resistance is not just about where this resistance is in the last couple of weeks here, guys, a lot of this move above this 2950 area, I’ll call it Fed-induced. But again, we really want to look at this. If we look at how the stocks were doing, again, from one year ago, once again, we had reached a high point by mid to late September and then we proceeded to go down the rest of the year. So I personally don’t see that anything has changed here. I’ve been a strong advocate for selling into rallies, not buying on dips. Not that there isn’t good money to be made short-term buying dips, but right now up here, this is beginning to look more and more bearish.
Crude Oil
As we look at oil going into next week. Oil basically, to some degree, confirming that bearish signal on equity markets as oil is simply unable to break above these verified zones. We’re now slipping and closing below our TCross long, 5513. So when we look at this right now, again, if the stocks remain under pressure, that’s being confirmed by the breakdown below the TCross long. We’ve got an RSI that’s at 50.2. We know the seasonality in oil. Oil usually is weak. Once we start moving towards October, oil gets weaker.
So oil and equities basically on borrowed time here in my respectful opinion to maybe the first part of October. But the trade war could send it lower basically any day here now. So we’re not going to make all our investment advice on a trade war, but we can’t, again, forget it or pretend that it’s not there just because we haven’t had any more recent bad news. That’s the one thing we want to take into consideration here. So these direct inner market correlations are absolutely warning us that both oil stocks are not in great shape here, to say the least.
Forex Weekly Outlook for Major Pairs
Euro/U.S. Dollar (EUR/USD)
Now, as we move into our main Forex pairs here. The first pair we want to look at is, again, the Euro. The Euro selling off on Friday. Now, this is what happens a lot, guys. What happens is that the brokers run stops in thin, illiquid market because real money is not in there on Friday. So what this looks like is a classic bear trap. So what I mean by a bear trap is the market pushes lower, breaks through a congested level of support, only for it to turn around and reverse a couple of days later. So we want to be very, very cautious here. Our predicted RSI sitting at 10.9 heavily, heavily oversold here. Again, the bulk of this move took place in thin trading conditions on Thursday and Friday.
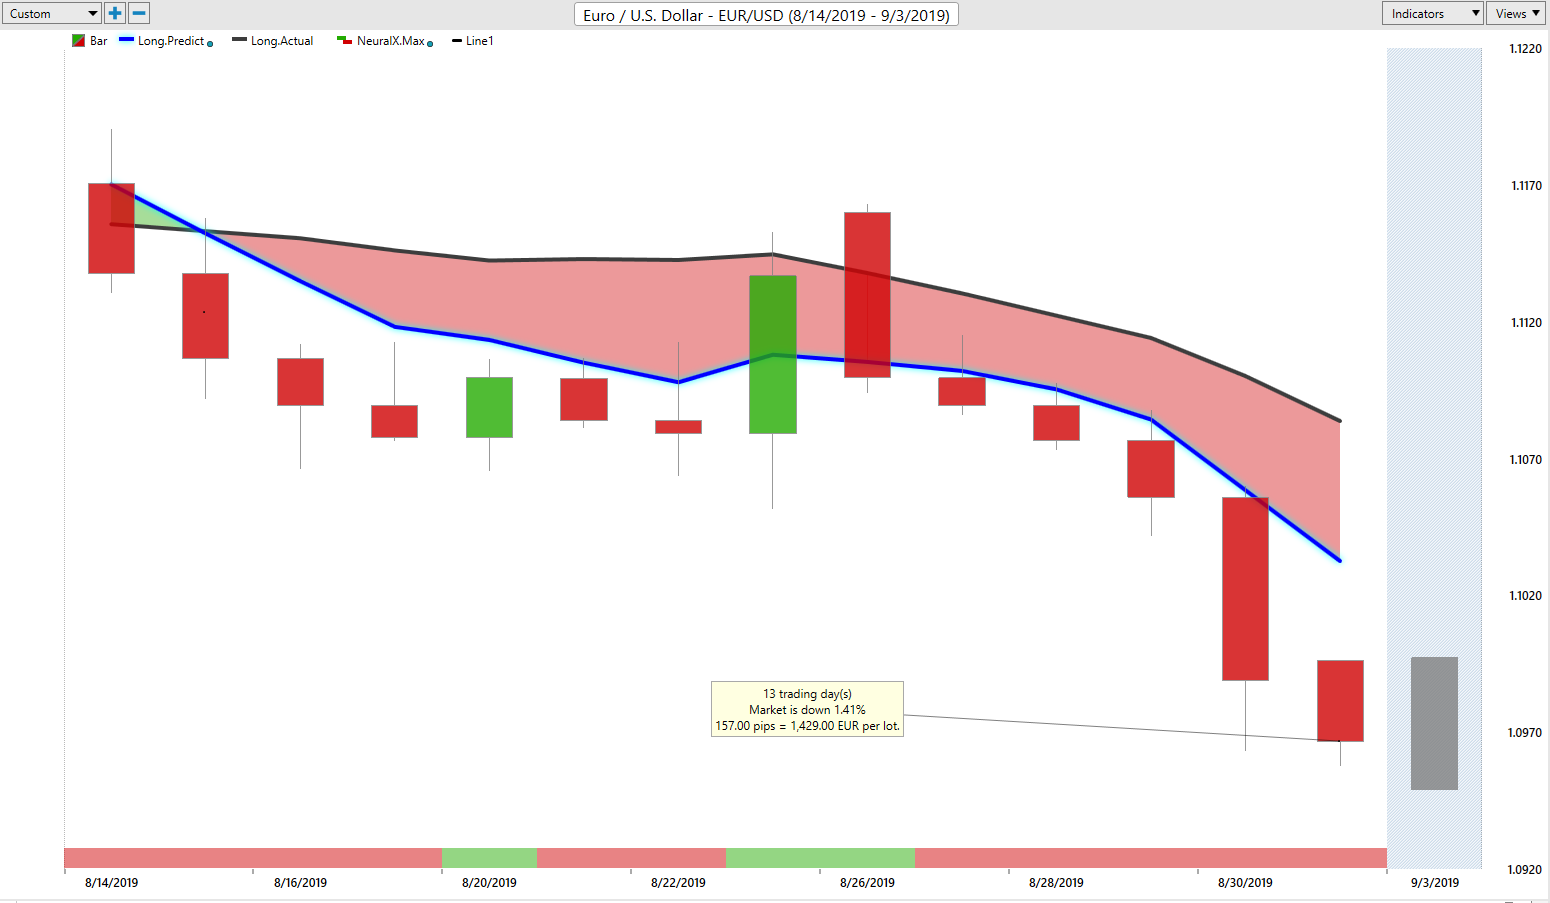
Now, the Euro definitely is primarily biased to the downside. But if gold reverses after this correction lower, the Euro is likely to follow gold higher. So we want to make sure we’re keeping a very close eye on that.
Our TCross long is that the one 1.102 area. When we click on our F8 on our VantagePoint software, our critical pivot area, that now is coming in at one 1.1058. I would absolutely anticipate a retracement to at least this level by Tuesday or Wednesday, maybe Thursday at the latest, and then we can reassess. But if we get back up above 1.1058, then the pressure would then be off the downside confirming that bear trap down below. Again, a lot of retail traders tend to fall for these traps because the number one thing I hear is that they’re trading the trend. Well, very seldomly is the trend your friend, in my respectful opinion over what I’ve seen over the years. The market is trading in a range 80% of the time with these false breaks on either side of that.
U.S. Dollar/Swiss Franc (USD/CHF)
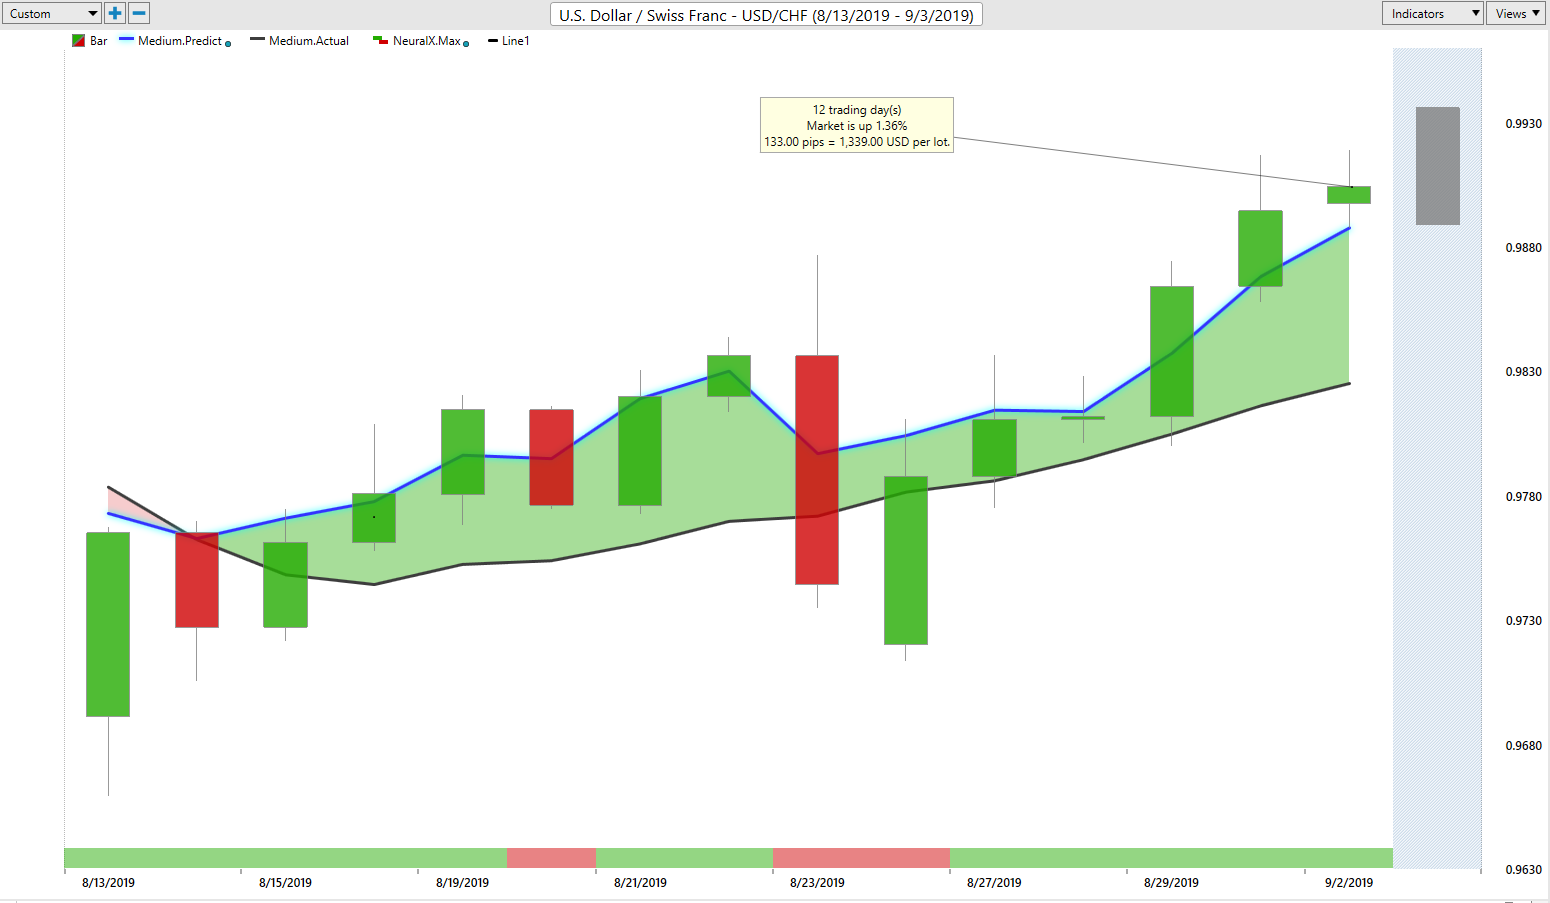
Now, with U.S. Swiss Franc, again, U.S. Swiss Franc is a pair that the market very much wants to get long on this because of the swap differentials on this. But remember here too, guys, that when we’re in a risk-off environment, money goes into the Yen and it goes into the Swiss Franc. So the probability that this pair advances slightly at the beginning of the trading week, looking at this area towards 0.9974 is very reasonable to start looking at setting shorts. We’re already in an overbought condition on the RSI at 83.9. We’ve got a little bit of room to extend, but watch the equity, the S&P 500 very closely. When it starts to tank, it’s going to pull this pair down with it.
U.S. Dollar/Japanese Yen (USD/JPY)
The other pair we’re going to see get pulled down with it will, of course, be the dollar/yen. When we look at the dollar/yen, we can see that very little has changed here, guys. These verified zones that go up towards this 107 area continue to hold. Our TCross long, our critical VantagePoint long-term, medium to longer-term pivot area at one 106.34, despite this, what I would call a false move up in the equity markets on Friday. This is how we look to confirm these things. The dollar/yen did not follow equities higher. So if nothing else, we would assess here that something is wrong.
If it’s a true rally on the S&P 500, then the dollar/yen would be going up higher with it. It’s not. So we want to watch these levels very closely. Now, if we can get above 107 and stay above 107, then we may have a shot of moving up somewhere close towards our upper verified zone, which would be one 109.31. But the amount of sellers that will be camped out between the two verified zones is pretty heavy up here, so we would be looking to set shorts. Our immediate area that we want to watch here is going to be that, again, right around that 107 area.
Now, things could change with the trade war. Things could improve. That’s possible. If that happens, we would be happy buyers of dollar/yen, but right now, the trend is clearly to sell rallies. That’s what we want to continue to monitor.
British Pound/U.S. Dollar (GBP/USD)
Now, with the pound/dollar going into next week, the pound/dollar here, guys, is basically is all tangled up with Brexit fears, Brexit rumors. We’re in a range, but looking at the current situation here, it’s more likely than not that we’re going to come back into this 1.2015 area.
Again, just when we think that Brexit is resolved, it rears its ugly head of yet again. So we’re going to be continuing to monitor this. But once again, when we look at that medium-term crossing, the long-term predicted difference, it gave a very clear signal that we were not going to advance after this break. Once we made a break of that resistance right around this 1.22 area, 1.2209, we couldn’t sustain it. So we’re going to watch it very closely. Our key VantagePoint level now coming in at 1.2102. If we can stay above that, we still have a shot at longs. But the indicators here are warning that this pair is getting ready to actually break to the downside.
The Commodities Currencies
U.S. Dollar/Canadian Dollar (USD/CAD)
Now, with our three main commodity/equity currencies. That’s what I’m going to call these now. Because the CAD dollar, the Aussie, and the New Zealand are very much responding to what’s going on with the S&P 500. But the Aussie and the New Zealand are lagging behind. The CAD, still desperately trying to hold onto these gains, but we are unable to break through these verified resistance zones in the VantagePoint software. That high now coming in at or about the 1.3340 area. If we can break through there and stay above that area, then it’s likely we’ll be able to advance to our next target, which would be the 1.3432 area.
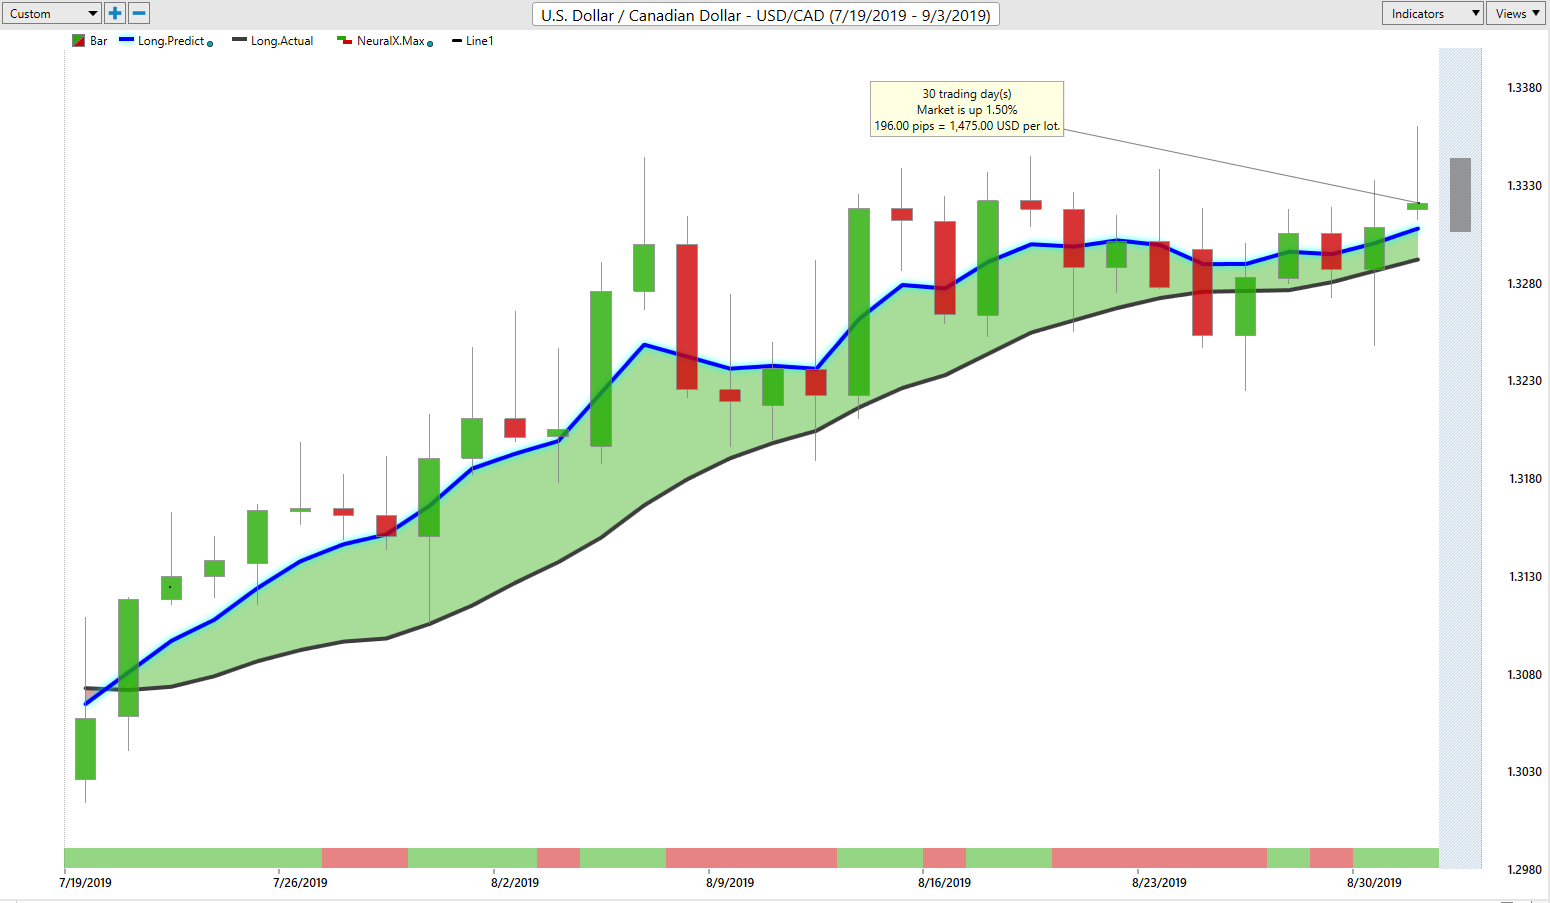
But in my respectful opinion only, I believe the Bank of Canada next week is going to flip flop yet again and they could take a more hawkish tone. It’s possible, but again, next week is going to be very much dependent on the information we get out of the Bank of Canada on Wednesday or Thursday of next week. Make sure you’re checking your economic calendars. But it’ll be very interesting to see how the Bank of Canada is going to respond to the trade wars and everything else that’s going on. Are they going to be on hold? Are they thinking about cutting, or are they actually still have the possibility of hiking later this year?
I don’t think so, but it’s possible. So what we really want to do is watch this support level from VantagePoint 1.3277. If we can remain above this area, then we’ve got a shot at breaking through this resistance. But I think it’s a more reasonable play that we’re probably going to come back down and test this lower support area that’s in and around this 1.32 area, 1.3189. If we break through that, then we’re likely going to come back into this congested support level all the way down at the 1.3014 area. But again, let’s see how we respond to this resistance level first.
Australian Dollar/U.S. Dollar (AUD/USD)
Now, with the Aussie in the New Zealand, they are indisputable bearish. Once again, another leading indicator that these stocks are in trouble. So when I look at this, if it was a true rally on the S&P 500 on Thursday and Friday, then the Aussie would be recovering, the New Zealand would be recovering. They’re not. So once again, we’ve got to watch these key VantagePoint level. We’ve got a predicted RSI that’s trying to recover, but significant resistance. Our TCross long at 0.6776. We’ve got a newly formed verified resistance at the high at 0.6788. What looks like would be such an easy long trade here, guys, it just doesn’t seem to come to fruition. We want to watch this very closely, but we must break through this critical TCross long at 0.6776. If we can’t, then we’re going lower.
New Zealand Dollar/U.S. Dollar (NZD/USD)
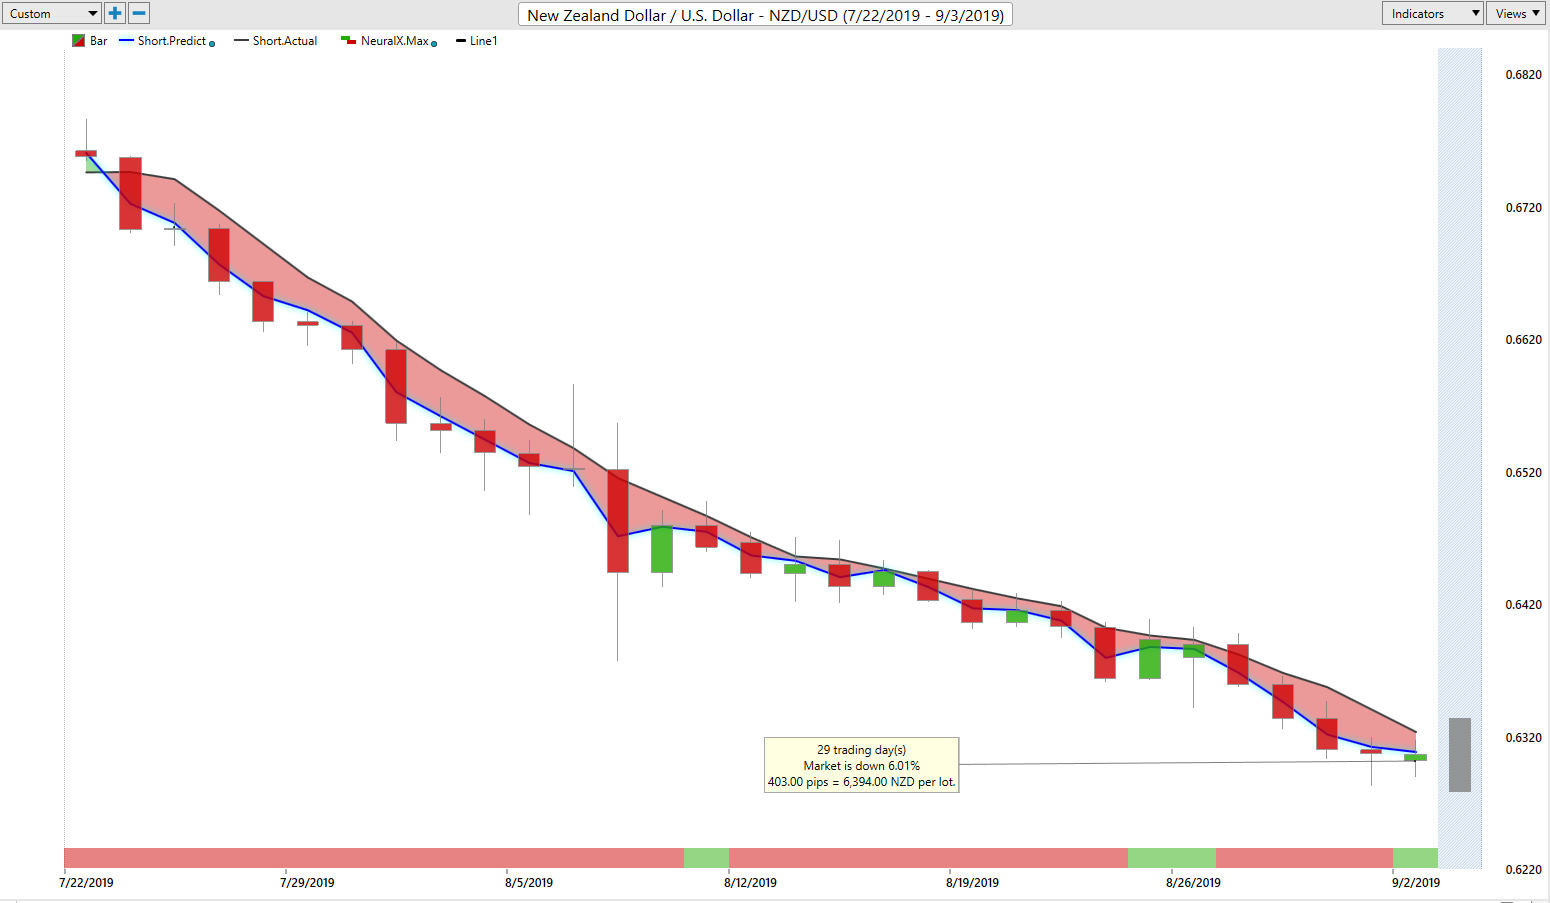
The same would apply for New Zealand. New Zealand is actually moving lower at a quicker pace than what the Aussie is. It continues to advance lower. Once again, our TCross long 0.6412. The indicators are in an oversold condition, but they’ve been oversold for weeks here, guys. And again, this is why we don’t want to solely trade off of any one indicator. We need a combination of indicators to tell us and say, “Okay, just because something is overbought, it certainly doesn’t mean it’s going lower. And just because something is oversold, certainly doesn’t mean it’s going to go higher.” We need to look at that. But once again, if the market is going to sell, they’re going to sell. If they’re going to buy, they’re going to buy. You don’t want to fight the market on this. But we absolutely want to make sure that we’re monitoring these direct inner market correlations. So with that said, this is the VantagePoint AI market outlook for the week of September 2nd, 2019.


