


Vantagepoint Forex Weekly Outlook for the Week of July 1st, 2019
The Vantagepoint Forex Weekly Outlook is designed to help traders. It’s important to remain aware of correlations in the global markets. Traders can become more profitable if they know how to get ahead of the trends. Utilizing the predictive indicators in VantagePoint Software can help traders find the right trades and the right times. Above all, traders know when to enter and exit those trades for maximum profit. Let’s look at the charts for the U.S. Dollar, Gold, Crude Oil The Stock Market and the Major Pairs.
Hello everyone and welcome back. My name is Greg Firman, and this is the Forex Weekly Outlook for the week of July 1, 2019.
A very volatile week is coming this week. We’ve got the non-farm payroll number, Canada Day, a holiday on Monday, and Independence Day in the US on Thursday of this week. On top of all that, we’ve got the non-farm payroll number on Friday, with nothing but headlines coming out of the G20 summit.
I think this coming Sunday we’re going to see a significant gap in the Forex market, particularly on pairs like USD/JPY, USD/CHF, and anything equity-based. It’s my understanding that Trump is not going to put additional tariffs on China, and everybody is back to the table. But again, these are rumors. We have to see how this plays out.
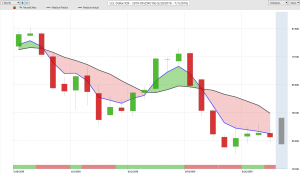
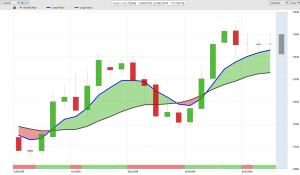
Looking at the Dollar Index via the VantagePoint software, we have a critical reversal indicator on our medium term crossing our long term predicted difference. The neural index is not completely in support here, but as I’ve discussed often, the dollar is usually strong at the end of the month and the first week into the new month. I don’t see anything that’s changed here. We have very, very significant support based around that yearly opening price at around $95.59. There’s a lot going on here.
It appears, if nothing else, the dollar is going to correct higher, towards $96.20. If that’s the case, we’ll see stocks recover next week. This is a concern, but what I’ve noticed since 2012, as the S&P 500 goes higher, the US dollar goes higher with it. It could be a decent week, next week, for stocks and the US dollar. I also believe that’s only a short to medium term play, and that the longer term picture is seeing money going into gold.
The Gold Market
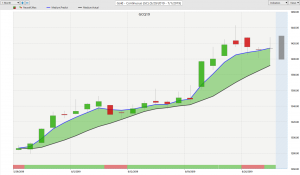
Whenever I see money going into gold like this, in my opinion, there’s several currencies that are going to be affected by that. It would strengthen the Euro, the Aussie, the New Zealand, the CAD, the Swiss franc, a number of different pairs. Now we do have verified resistance on gold going back several years. The main level that I’m watching is $1,434, seeing if we clear above that.
We’ve got a short term top in place at $1,442 that we should respect at this particular time. It’s a lone bar sitting there by itself. I expect on these headlines out, gold would move lower, at least in the short term, based around a known cycle of dollar strength. We look for gold to hold above $1,374, and I’d say a retracement is imminent. We’ll continue watching this. The medium term crossing the long term predicted difference is a leading indicator, but the neural index is still not convinced that gold is going to go too much lower.
S&P 500
When we cross reference that to the stock market, if the headlines are true, bearing in mind this Outlook was produced Saturday, before the market opens, not after it. This is not eyewitness weather here guys, where we forecast something that’s already happened. This is before the market opens. Looking at this right now, I still have the same verified resistance here at the $2,964 handle.
There is a very strong possibility that the equities could pop towards $3,000. I believe that any move higher in stocks ultimately is going to be met with selling. It’s just a question of how much the market is buying into what Trump is saying, along with China. We don’t have verification on any of that, and even if it does settle, the Fed is still talking rate cuts. All of this still points towards a recession, which is not good for stocks. So we have to bring that basic fundamental into this.
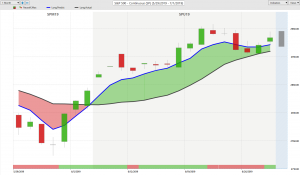
Stocks have been in a strong rally since 2011, 2010. It would be perfectly normal for these stocks to go lower. We’re going to see how this one plays out, but we’ve had a full retracement down to our t-cross long, and the indicators are still warning that we’re going higher.
A lot of this is optimism is based around the G20 this weekend. We’re not really positive what’s going to come out of this. I strongly recommend everyone take a breather on Monday and Tuesday. The Canadian markets are out on Monday; US markets are out on Thursday, and the non-farm payroll lingering there. It’s a very volatile week ahead.
Crude Oil
Oil continues to be a leading indicator. We can seeoil has significant resistance at $59.85. We’re starting to turn lower. We’ve hit this verified zone, identified by VantagePoint, three days in a row. In my opinion, we have to watch out as oil could pop higher if stocks do. The direct intermarket correlation we’ve got a monitor.
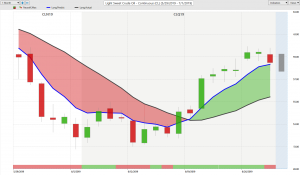
When we see a signal like this, the medium term crossing the long term predicted difference when the neural index is in agreement, our RSI is overbought and there is no buy trade there. If there is a long trade on oil, I believe it will be short to medium term, and will be based on those announcements we’re hearing. So be very, very cautious with that.
Forex Weekly Outlook for Major Pairs
Euro/U.S. Dollar (EUR/USD)
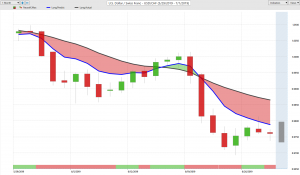
With our main Forex pairs this week, if stocks rally and gold moves lower short term, it’s not going to benefit the Euro one bit. The euro is again stalled out here. We’re on the cusp of a potential reversal signal. Watch this one very closely. The medium term crossing the long term predicted difference, we’re looking for the neural index to turn red. Our RSI is already starting to move lower. We’ve got a verified zone that’s formed, the top of that zone at $114.13.
Clearly, a corrective move is in play, but I’d advise everyone, based on the overall range here, we are still within the overall range. But, we’re pushing to a break through to some new highs. Gold is going to determine what happens with the euro. The direct intermarket correlation here is that stocks higher, Euro lower. I know that that may sound foreign to some, but for the last year that’s the direct intermarket correlation that I’ve seen.
U.S. Dollar/Swiss Franc (USD/CHF)
We certainly are speculating here, but looking at the USD/CHF, it has stalled. We’ve got the exact same signal on the USD/CHF as we have on the Dollar Index. The Neural Index is conflicted here. I think it will be a corrective move, but if stocks again move higher, then USD/CHF is unlikely to move much lower from where it is. It’s actually likely to move straight up.
We’re watching the S&P 500 and global equity markets very closely to see how they’re responding to this weekend’s G20. Right now, the headline news coming out is positive. We’re going to be watching these levels very closely. We appear to have a short term bottom in place at $96.93, and I fully support longs off that particular area.
British Pound/U.S. Dollar (GBP/USD)
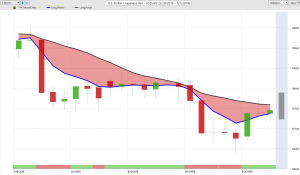
As we look at the British Pound/US Dollar, it probably won’t move much from here. We’ve talked about this one in the VantagePoint live training room, having several very lengthy discussions about this; I’ve warned everybody about two levels – one at 128.50 and the other one at this critical verified zone, at 128.10. In my opinion, if, and when, we take out 128.10, this thing is going to run all the way back up to 132; we’re going to have a very easy long trade. I’m not convinced that’s going to be next week. We’re in a period of known dollar strength, equity’s turnaround, the dollar turns around. That’s probably going to hurt the GBP and the EUR.
Right now we’re sideways around this verified resistance, with good, strong verified support down at the 125.06 area. I would be far more comfortable with longs in that area than I would be where the market currently is. Our t-cross long at 126.82, we’re closing 126.82, we’re dead flat here. Next week, shorts carry a slight biased, while below that key area between 127.50 and 128.10.

U.S. Dollar/Japanese Yen (USD/JPY)
The USD/JPY is going to be a sneaky one this week. It’s all about stocks. If the market – the S&P, the Nikkei, the DAX – all pop higher with what’s going on with the G20, the USD/JPY is going to pop too.
Here’s where I would be very cautious with this one. I cannot rule out a 100 or even a 200 pip gap in the market this Sunday night, because the second they get in there, anybody who’s short and hears these announcements may want to dump out of their shorts at this level. If they do that it’s going to cause a significant spike on the USD/JPY. I think there’s at least a 60% probability that’s going to happen.
Be very careful, but watch our verified zones, coming in at 108.80. More importantly, I would pay attention to the 109.50, 109.93 area. I support shorts on any kind of rally higher, but let this one shake out first. Let’s get into Tuesday trade before we really get aggressive either way. Be careful of a significant short term gap in the market on Sunday and Monday.
The t-cross long, 108.11, we’re closing 107.86. I don’t think 108.11 stands a chance on Sunday night. If any of the rumors we’re hearing are true, people are going to bail out of shorts here quickly.
The Commodities Currencies
U.S. Dollar/Canadian Dollar (USD/CAD)
With the long term shift, we’ve got three main commodity currencies – USD/CAD, AUD/USD, and NZD/USD. I believe within a matter of days, weeks, or short months, all three of these currencies reverse to the upside. What will trigger this will be a further breakout in gold. I’d like to point out in the most recent breakout, between gold and the S&P, it was gold that broke out. The S&P is still within its range. Gold is not, it’s moved higher. Even though we’ve got that resistance at $1,434, there’s more money going into gold and bitcoin than stocks. That’s based on what we see on the charts.
If everybody is happy, we get a pop in the equity markets, that could be the last one. But if gold continues to advance, USD/CAD will move lower, while the AUD/USD and NZD/USD will move higher, based around its high correlation to gold. For now, we’ve got to be cautious with this particular pair is we can see the medium term crossing the long term predicted difference to the upside. If our Neural Index turns green, we’ve already got an oversold condition on the predicted RSI. This is pointing towards, if nothing else, a corrective move back towards the 132.57 area.
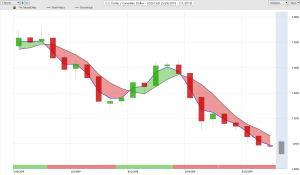
As I’ve stated in the live trading room, and with my own direct clients, I fully support longs at 130.55 and stops around 129.90. We want to put a tight leash on this thing, but reversal trades like this very often work. Just remember Canadian markets are closed on Monday. They’re not coming back in until Tuesday, so Tuesday’s the new Monday this week. Be very cautious with this pair, but watch your oil contracts and continue to monitor these indicators.
This indicator here from VantagePoint, is one of my favorite in the software, the medium term crossing the long term predicted difference, but I want the back support of the Neural Index. If I don’t have the Neural iIndex, a lot of times I’ll still go in, but I’ll pause and wait. In this particular case, when we look at the major support at 130.55, medium term crossing the long predicted difference, a heavily oversold RSI. It screams of a counter-trend long. But keep a tight leash on it.
Australian Dollar/U.S. Dollar (AUD/USD)
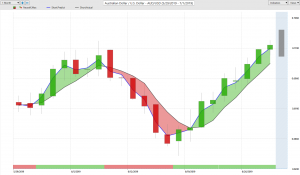
I’ve discussed the levels on AUD/USD and NZD/USD, and I’ll mention them again this week. If we can take out 70.50 and stay above it, more importantly the verified zone up here at 70.68, we could be looking at a much longer term reversal on the AUD/USD. Remember back in 2011, where the Aussie currency was when gold started to collapse. I can go back 10 years and you can see that the AUD was at $1.13 to the USD. That’s where it peaked; that’s where gold peaked back in 2011, 2010.
Let’s not lose sight of this. We don’t always want to play the short game. The long game can be very lucrative if we know what we’re looking for. If gold is getting ready to go into a long term reversal, as it’s been going down since 2011, then the AUD is to be on the rise. The indicators from VantagePoint, very good call off of here. The medium term, the long term predicted difference with the Neural Index, fantastic trade.
New Zealand Dollar/U.S. Dollar (NZD/USD)
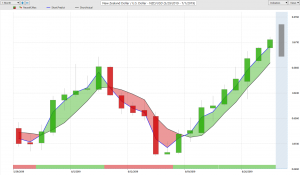
We’ve got to break through this area. If we can’t break through that area, I think in the short term, we’re likely going to correct a little bit back towards the 69.55. But, towards the end of next week we should be looking for longs again. The same applies to New Zealand. We’re up, with the same formidable resistance, but New Zealand is a little bit stronger. Though the RBA and RBZ is going to be cutting interest rates, so is the US apparently. If interest rates are being cut globally, the US has the biggest at 2.5%, with the biggest room for cuts here. It could be another nail in the dollar’s coffin. But, I don’t think that will be next week.
Let’s see how things play out and go from there. It will be a very volatile trading week next week. So take good care. With that said, this is the Forex Weekly Outlook for the week of July 1, 2019.


