


Vantagepoint Forex Weekly Outlook for the Week of May 27th, 2019
The Vantagepoint Forex Weekly Outlook is designed to help traders. It’s important to remain aware of correlations in the global markets. Traders can become more profitable if they know how to get ahead of the trends. Utilizing the predictive indicators in VantagePoint Software can help traders find the right trades and the right times. Above all, traders know when to enter and exit those trades for maximum profit. Let’s look at the charts for the U.S. Dollar, Gold, Crude Oil The Stock Market and the Major Pairs.
Hello everyone and welcome back. My name is Greg Firman, and this is the Forex Weekly Outlook for the week of May the 27th, 2019.
The US Dollar Index
Now to get started, we’re going to begin where we always do with that very important U.S. Dollar Index that we’ve been monitoring very, very closely over the last several weeks.
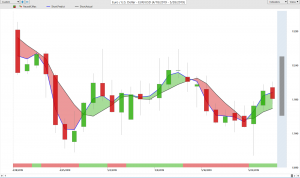
Now, what we have talked about in last week’s Forex Weekly Outlook was more specifically a level that we need to break and close above, 9808. We’ve come back up. You can see that we pushed slightly above that in intraday trading, only to basically close significantly below that level. This is a classic bear trap that I’ve warned people about more specifically in the VantagePoint live training room. We’ve discussed this, so we’ve prepped everybody and ready for basically a reversal.
Now, that reversal is coming on the exact same bar, after the false break above 98, only to close below that area, well below that area I might add, at 9772. From there we’ve got our medium-term crossing over our long-term predicted difference. Now, for somebody looking for a rule-based, a very specific rule-based strategy, whether it be with the trend, or against the trend, which is why I love this particular set-up, that you can see by shorting this, we’re clearly against this strong move up in the dollar. However, VantagePoint was precisely accurate on the medium-term crossing the long-term predicted difference, when we combine it with the Neural Index turning from red, or from green in this case to red, and we have a declining RSI, which basically is telling us we’re losing that upward momentum. Now, we’re closing the week, and I will remind everybody, it’s a holiday thin week next week, so you’re going to have a lot of people profit-taking.
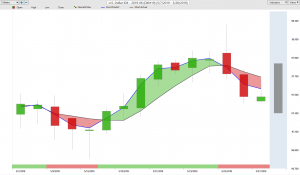
This doesn’t fully confirm that the dollar is reversing lower. Now, when I look at this, the closing price is 9747, our T-cross long is 9751, so we’ve basically closing right on this level. So, this could still be a corrective move in nature, but I feel at this particular time, we should be targeting more down towards this lower 9681, as the dollars starts to lose its luster.
It’s had a fairly good rally, but again, based on headline news and a number of these things.
The Gold Market
Now, with that dollar weakness, gold is desperately trying to break above our T-cross long on our VantagePoint software. We can see that level is now 1289. If gold is going to go higher, we must break through this area. Once we do, we can then target the next swing high at 1309. But, this is still formable resistance. What I’ve noticed as of late, that there’s more in a risk-off scenario, there’s more money going into Bitcoin than there actually is into gold as of late. So, something to keep an eye on. I think we may have a bigger trade on Bitcoin coming that maybe some realize. So, we’re going to be watching it very, very closely. But for now, gold again, must break through those levels.
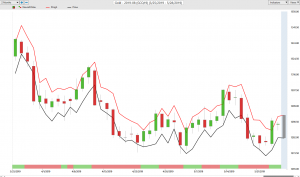
We don’t have a confirmed signal with our medium-term crossing our long predicted difference and we can further access that the RSI is turning sideways here, right on the breakout level of the 60 on the RSI. Now again, I have my RSI based on a 60/40 split. I am not interested in using the RSI as an overbought or oversold, I’m looking for more momentum. So, when the angle of the RSI starts to flatten, that tells me I’m losing my upward momentum. If gold is going to break, that is the level we need to watch very, very closely.
Crude Oil
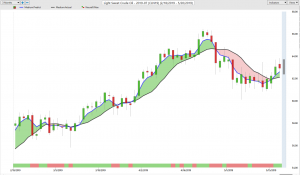
Now, oil in most cases will follow the equities higher, and that’s exactly what’s happening. But, we can assess here also that we’re getting tangled up around this verified resistance at 6348. So, we’re looking for a clean break of that area if we have any chance of targeting 6672, the additional verified resistance. I believe we will get back up to that area the closer we move to summer driving season. Now, the indicators from VantagePoint are still rather positive on oil so we could see further upside. But we need the SM500 and the global indices moving higher, to be clear.
S&P 500
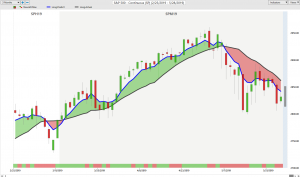
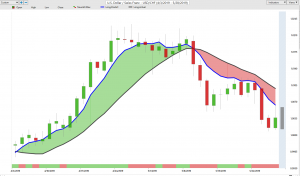
Now, with the S&P equities and oil contracts, basically one of the same, the fresh triple EMA cross on VantagePoint to be clear, took place way the back, way, way back on May the 7th, that we had talked about. We’ve made that triple EMA cross and we’ve had multiple retracement points since. This is looking more and more like a bare market in my respectful opinion, only. The reason I’m saying that is because we have this confirmed triple cross. We’ve had multiple retracements and retests of the long-predicted and of the T-cross long. So, when we look at this right now, we’ve had what appears to be a corrective move higher, but in order for the S&P obviously to break out to the upside, we need to resolve the U.S./China trade deal. I don’t see that happening anytime soon, but breaking above these critical levels; 2864 and our most recent swing high that we can identify, coming in at 2893. We are simply not getting above these areas. So, for now, shorts still appear to be the better play, but I will concede that the VantagePoint indicators are still somewhat mixed here. So, we’ll watch it very closely, but the equities are very much headline driven.
Forex Weekly Outlook for Major Pairs
Euro/U.S. Dollar (EUR/USD)
Now, as we move in towards our main Forex pairs again, starting with the Euro, U.S., the most heavily traded Forex pair, once again as I talked about in last weeks outlook, and as I talked about in the VantagePoint live trading room, that at least for now, I anticipate this major low on this verified zone down at this 111 area. I expect it will hold. We can assess that we came right down to that level on Thursday, only to see vicious buying pull it up and out of there.
Now, when we look at this, our medium-term crossing our long-term predicted difference, when combined with the Neural Index, clearly told us that this was going to happen. Very nice to have that additional verified support with an indicator that has an accuracy rating of at least 80%. Once again, bang on the money, Euro/U.S. now closing above the T-cross long at 111/90. But, I will further point out that we have significant verified resistance that we must break above. 112/64, you can see that we’ve got these two areas back in here, neck and neck, so essentially the range that we’re dealing with Euro/U.S. is between 111, 112/64, a break in either side of that will lead to the next move. Right now the VantagePoint indicators are suggesting we’re going higher, but remember, we’ve got the EU elections that we’re going to have the results of that on Sunday night, so be careful of some very, very choppy markets on Sunday and Monday, along with, of course, that U.S. holiday.
U.S. Dollar/Swiss Franc (USD/CHF)
Now, the Euro/U.S. counterpart is U.S./Swiss Franc. We talked about this one extensively in the room this week also. What I had talked about in this week’s live training room with VantagePoint is that this trade, on the long side, is going to be absolutely dependent on stocks moving higher. We can throw every indicator under the sun at this thing. We can throw Eliot Wave, Fibonacci, Williams, the VantagePoint, a lot of the different VantagePoint indicators are highly effective, but the inner-market correlation, the core reason why this pair will go up and down is specifically related to the S&P 500 and the global stock markets.
So what I had stated very clearly is that in order for us to buy this, we need the S&P 500 moving higher. We didn’t get that and now we’re breaking down lower. But, remember, if the S&P 500 basically recovers and breaks above the 2860/2870 mark, then that will send U.S./Swiss Franc back to the upside. Right now the indicators from VantagePoint are not in support of that particular move.
British Pound/U.S. Dollar (GBP/USD)
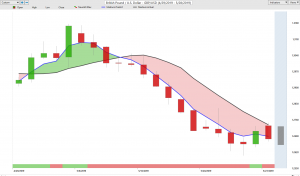
Now, with Brexit at front and center stage yet again, looks like Theresa May’s out, this pair, very, very dangerous. Now, one of the key indicators in trade set-ups that I always look at, because it’s a top producer, is the medium-term crossing the long-term predicted difference when combined with the Neural Index. We have that signal right now here, but guys, we have to be very careful with this pair right now. It is 100% headline driven. So, for next week, we’ve got our low point right now. That low point is 12605. If we can hold above 12605, that will validate this signal. We’ve got a rising RSI, we’ve got the medium-term, and we’ve got the Neural Index in agreement, but, the move right now would appear to be corrective, back towards 12835. Still a reasonable play here guys, but we’ve got to be careful with this. I don’t know what’s going to happen with Brexit.
U.S. Dollar/Japanese Yen (USD/JPY)
Now, with Dollar/Yen, again, next week, this is a U.S./Swiss Franc trade in an equity trade. I’ll reiterate what I stated in the live training room this past week, that we need stocks going higher if Dollar/Yen has any chance of moving up. Basically they’re running tick for tick. We have good support down here from about a week and a half ago. That’s coming in about 10902. But this level very much needs to hold and equities need to turnaround or else we are going lower, okay?
So you know, often times, not often times, but in the past I’ve heard people say, “Just give me a trade. I don’t want a one hand on this, or on the left hand, if this happens we do this. And on the right hand if this happens we do that.” Well, of course that’s the way we look at our trading guys. That’s the way any experienced trader would look at things, because you’re going into battle here, guys. You have to have a plan B. If the trade that you have, that you’re looking for doesn’t pan out, you have to be prepared with a back-up plan. So, in this particular case, if we lose this critical level here at 10930, the probability that we start moving back down towards the lower 108 or 107 area is likely about 80%. So, what I’ll say here is what I say to my own direct clients, know your levels, guys. Know your inner-market correlations and identify these, and always have a back-up plan, right?
You’re going to have traders next week that are going to want to buy Dollar/Yen because Trump right now is over in Japan this weekend, I believe, so China talks about China, are definitely going to be on the table here guys, right?
So that we could see some positive rhetoric coming out of Japan while Trump is there, right? And then he’s off to China, I believe … Correct me if I’m wrong, the first week of June or something. So, he’s going to ratchet-up the rhetoric and everything. It could be positive, could be negative, but it’s headline driven. So for now, watch the key levels that I’ve just discussed here, and be prepared to deal with these headlines as they come out. Again, always have a plan-B, right?
The Commodities Currencies
U.S. Dollar/Canadian Dollar (USD/CAD)
So, going into our three main commodity currencies with U.S./CAD. U.S./CAD continues to play the range: 13517 on the top side and we’ve inched slightly lower down to 13357, outside of this verified zone. Oil prices, however, again are the core reason why U.S./Canada went higher. It had nothing to do with Fibonacci, with Eliot Wave, with anything that I’ve stated, or another analyst have stated. It has to do with the direct inner-market correlation that Canada has to oil, right? Oil crashed and U.S./Canada immediately reversed higher. So next week, we’re looking to see by Tuesday and Wednesday, if oil and the S&P 500 can recover. If they recover, then U.S./Canada will hold the range, but if they don’t recover, then U.S./Canada actually could break the top-side above 13517. Right now, respecting everything that’s going on globally with the equity markets and oil, I can’t rule that out, that we’re not heading to our next target level. So again, plan B guys. You always want to know to look.
If this level breaks here, our next likely target is clearly identified in our VantagePoint software at 13663. So, if we can break and close above 13530, stay above 12520/13530 for two days in a row, we’re likely on our way towards the 137 guys. So, understand again, where those key levels are and watch the VantagePoint indicators very closely.
Australian Dollar/U.S. Dollar (AUD/USD)
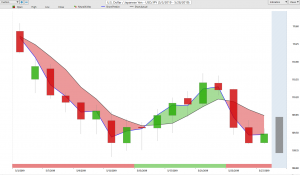
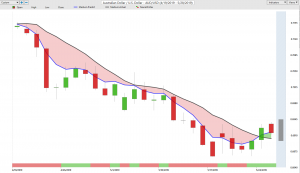
Right now our medium-term crossing our long-term predicted with our Neural Index is suggesting that this range top is going to come under pressure as early as next week. Now, with Aussie/U.S. and New Zealand/U.S., very similar trade. Again, we’re working extensively on this one, buying this pair in the VantagePoint live trading room. We’re doing that based around this failed breakdown of our May 17th price action. It’s broken down below there, and our medium and long-term predicted differences are starting to rise. Our RSI, our momentum indicator is not moving lower, it’s actually moving higher. Right now, for next week, the low point at 6863 is holding. As long as that level holds, you can see that you have the potential for a long trade, four or five days in a row. But, I will further advise that this still appears to be corrective in nature, in the broader downtrend. So, 6952 guys, we need to break free and clear of 6952 so we can then very clearly target the next high, which will come in at or about the 7047 level.
New Zealand Dollar/U.S. Dollar (NZD/USD)
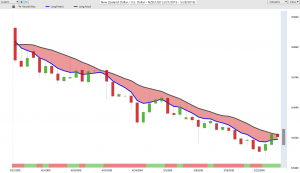
But again, this is a very difficult level, right around the 6934 and again, the T-cross long, which comes in at 6952. Significant resistance here. If it breaks, then we can add to further long positions. If not, I would advise trailing stops up to this particular area. Now, as I said, the New Zealand trade, New Zealand/U.S. Dollar is almost the same trade. It too is stalling below 6570, that T-cross long. The theory is, if it’s above the T-cross long, we’re long, and if it’s below, we’re short. That’s the primary trend. Right now, indisputably, the primary trend is clearly down, looking at this chart. But, we’ve got a rising RSI, predicted differences are rising, the Neural Index is positive, and again, even if we come down to our shorter-term indicators from VantagePoint, our short-term crossover is saying, we are going to the first price target, which again, is about New Zealand is about 6614. So, from where the market is right now, it’s not a huge trade, but it’s still pretty decent. Our medium-term crossover is not confirming that this is a long-trade yet.
So, we’ll continue to monitor and combine all of the indicators together, to get the best possible entry point. More importantly, to do the best possible analysis that we can do. So with that said, this is the Forex Weekly Outlook for the week of May the 27th, 2019.


