


Register for a Free Live Training
The Hot Stocks Outlook uses VantagePoint’s market forecasts that are up to 87.4% accurate, demonstrating how traders can improve their timing and direction. In this week’s video, VantagePoint Software reviews forecasts for SPDR SPY ETF ($SPY), ON Semiconductor ($ON), Amazon ($AMZN), Nvidia ($NVDA). Pitney Bowes ($PBI), Hims & Hers Health ($HIMS), Nucor ($NUE), J.B. Hunt Transport Services ($JBHT)
VantagePoint AI Hot Stocks Outlook for April 24, 2026
Hello again traders and welcome back to the hot stocks outlook for April 24th, 2026. I hope you all have had an excellent week out there in the financial markets. And as always, we’re here to take a look at the most recent Vantage Point AI predictive forecast.
So, if you haven’t already, be sure to go ahead and click the link down in the description below and get signed up for a live demonstration where you can learn all the specifics about how these predictive technologies are helping traders make much better trading decisions out in the marketplace. Uh, and so we’ll revisit many of the markets that we’ve looked at uh in previous sessions. Here we got SPY, Amazon, Nvidia, but there’s just so many great opportunities that really demonstrate how all of these predictive tools work together.
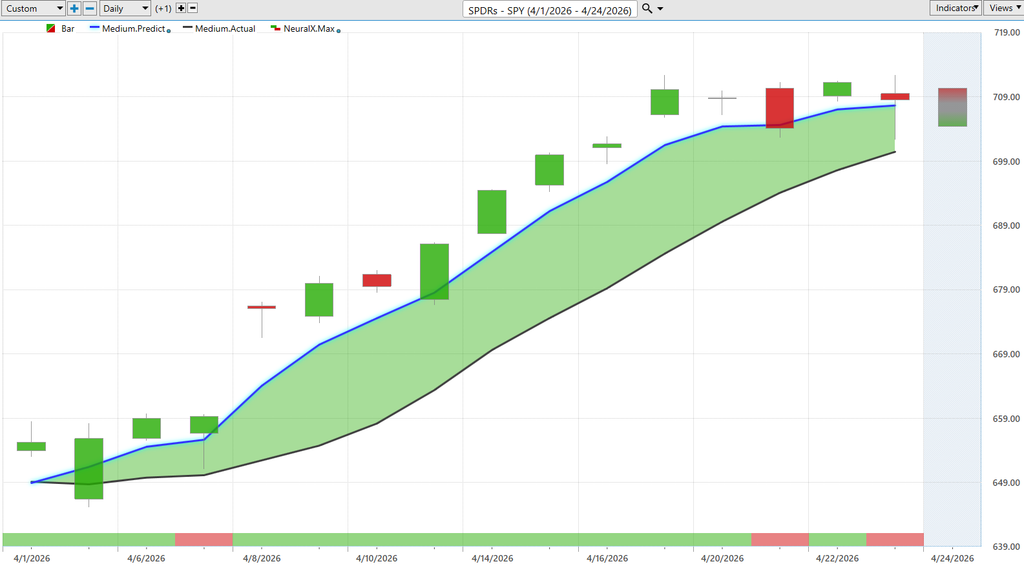
But let’s go ahead and start out with SPY. Uh, and of course we have daily bars and candles each week. And really any forecast works exactly the same way. So against these daily bars and candles, well the first thing we need to understand is what is this blue line and black line value. And so the black line that you’re seeing there, well that is a simple moving average. It’s a very common technical analysis indicator. Very simple to calculate as it just takes the previous 10 close prices, adds those all together and then divides by that number. And this acts as a baseline for VantagePoint traders.
Now mind you, all this data just comes from the past. So it has no predictive capability but acts as a good summary of what’s already occurred. Now, VantagePoint traders, however, are able to look at this blue line value. And for this number, which is essentially a price for that to get calculated and plotted and placed on the chart every evening for the vantage point trader. Well, this is where the technology of artificial neural networks come into play. And they’re performing what we would call intermarket analysis. And so, obviously, markets are driven by other markets, whether that be ETF groups, individual stocks, major indices, major commodities. And so this is where VantagePoint Edge comes in is it’s looking at dozens of markets that are known to drive and influence the future price of SPY. So obviously artificial intelligence taken huge amounts of data to generate highly accurate predictions.
Well, really the data set that’s going in to generate these highly accurate predictive indicators are things like uh the broader stock indices whether that be S&P 500 or the NASDAQ or potentially the Dow and Russell 2000. Uh, it can also look at other individual stocks that may share some valuable price clues onto where the index is headed next or how likely it is to continue trend. But this really goes global. This looks at things like the value of major currencies, the value of the bond market and interest rates uh and potentially even global commodities where applicable. So when we’re doing a forecast for a gold mining stock, well certainly it’s going to be heavy weight heavily weighted by the commodity itself. Uh and so again for that blue line to get plotted against the black line well that allows VantagePoint traders to identify these important trend shifts. So whenever we get that blue line again moving above the black line what’s suggesting that these average prices are going to start moving higher. Uh and we took a look at this back on this Friday which actually would have been uh let’s see back here on the second. So on the second we did the hot stocks outlook highlighted that we’re seeing crossovers on the S&P 500 and it might be a great time to look for bullish opportunities within stocks and also potentially more specific tech stocks. We looked at the cues as well. So you see here almost a 9% rally. We’re starting to gap up here again today going into the next Friday and a really nice opportunity to get on the bullish side of the market but that’s not the entirety of the forecast. Certainly, that was some valuable information that things are likely to move higher, but VantagePoint’s predictive tools work on different time frames to solve different problems. So, when you look at the very bottom of the chart here, you see this bar that goes from green to red, back to green. Well, this is the VantagePoint predicted neural index, and it’s able to predict short-term strength or weakness over the next 48 hours with a extremely high level of accuracy upwards of 86 – 87% across a wide range of markets. And what’s important here to understand is that this is regardless of geopolitical things going on in the world, earnings reports, Fed announcements, it maintains that extremely high level of accuracy.
So you can have confidence in utilizing those predictions. And of course, lastly, we have the predicted high and VantagePoint predicted low. So literally intraday levels where these neural networks are expecting price to move. Uh and so what we do each week is look back and say, “Well, how accurate are all of those predictions, those predicted highs and lows against the uh actual market data, once that get fills in, we’re going to get a candle filling in this uh expected range.” And you see how this works going all the way back to to uh really the beginning of the month in April, moving down towards these predicted lows here. You see an excellent entry on the S&P 500. Uh and then even the next week after this gap up, moving down towards these predicted lows, you see actually gapping down right towards the vantage point predicted low and then continuing trend. Uh and even just this past week, uh going into the week, we’re moving down to these predicted lows. But notice how the neural index goes bearish. And sure, we got that weakness uh really yesterday, the market just for a couple hours really started to sell off aggressively, but the overall trend is up here and we see things continuing uh to march higher. you see actually before that trading day that you know this 48 hour forecast saying there’s actually strength here 48 hours later uh and we’ll see as this uptrend continues.
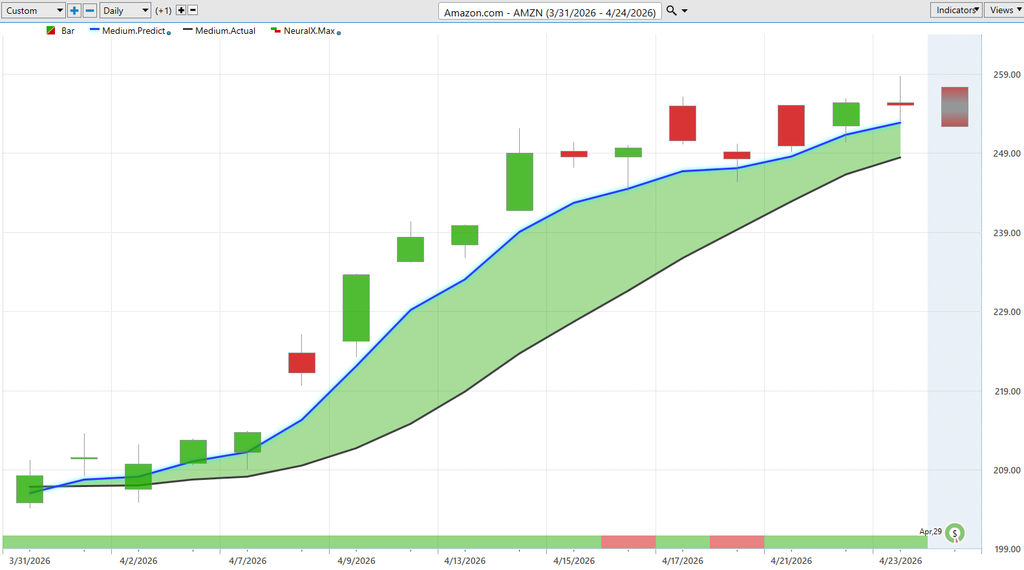
So very exciting stuff here uh but we can apply this to individual stocks. So here’s shares of Amazon and you see a very similar picture. We start to see the market turn up. You’re likely to see these big names uh inside of the index start to go higher as well. But this is where VantagePoint’s allowing traders to really fine-tune these entries into the market. And you see here, here’s Amazon actually on Monday, scooting right down to that predicted low and immediately continuing this uptrend, moving up towards predicted highs. Uh, and again, offering a potentially very nice entry from the beginning of the month to add more to the position or potentially a day trade where you’re buying at the predicted low, targeting these short-term predicted highs. Uh, and sort of a rinse repeat behavior here. uh taking these pieces out of the market. So really exciting stuff here from Amazon. Really seeing how these trends continue, but also how you can manage and adapt to these changing situations uh and benefit off of the highly accurate predictive forecasting ability of these artificial neural networks specifically utilizing that intermarket analysis and generating these predictions.
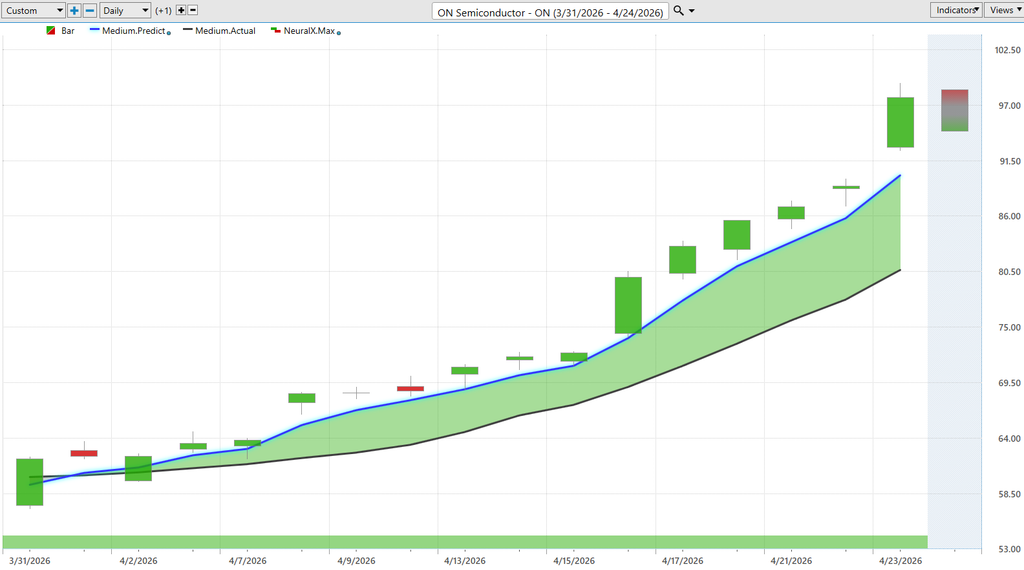
Here’s On Semiconductor. Last week we looked at alpha and omega semiconductor. Really just the tech space, right? We highlighted the QQQ’s. There’s some strength coming in. But when it comes down to those individual names, you can benefit off of these VantagePoint predictive forecasts. And we can see how accurate all of these daily predicted highs and lows are. So you see here’s our predicted high and low range for today. Obviously, the trend is in a strong uptrend. And look at this neural index every single day saying, look, there’s pretty much no weakness here. You should not be expecting weakness at all. Uh if anything, look down towards the VantagePoint predicted lows to accumulate a position whether that be a long uh a swing trade or position trade or just day trading targeting these upside predicted high values uh and taking these pieces out of the market. But this has been a huge move uh really nice individual stocks again that are benefiting off of this broad-based strength we see across the index. And definitely some cushion here, right? 59% move. Even if the markets start turning lower, uh you’re very likely be able to trail stops and stay very profitable in many of these opportunities that for the past three or four weeks, I mean, there have just been huge movers spread out throughout the market.
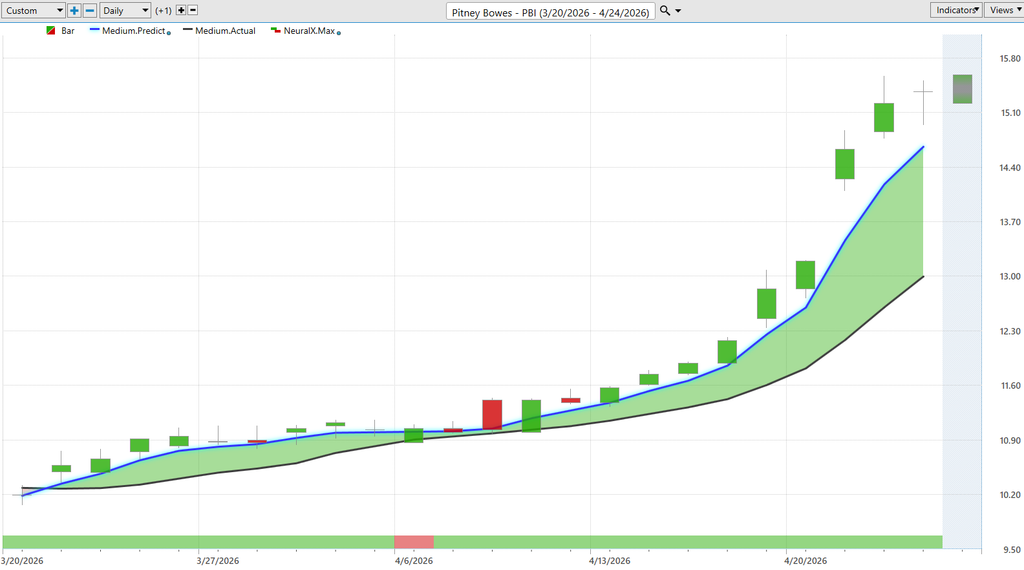
Here’s Pittney Bowees, PBI, very good example of this blue line crossing above the black line. We have this one trading day here where that neural index goes bearish. And look at the subsequent 48 hour price action, right? We’re in a strong trend, grinding higher each day. Neural index goes bearish. We run sideways for a couple days but almost immediately reverts back to the bullish side and then we see this momentum really kick into the share price. And of course the daily predicted highs and lows. So you have a road map and it really makes doing technical analysis quite simple is really all the heavy lifting here is handled for you. Now the beauty of this is we can actually apply this to VantagePoint scanning features. So actually use these predictive indicators to highlight where fresh signals are coming through. And look how many opportunities here we are scooting right down to the predicted low and pretty much immediately within 48 hours trading considerably higher and outside of that previous range. So again really nice move here in shares of PBI. And again seeing things actually fairly broad base spread out but you need to be in the right names here. Uh here we see up about 46 47% in just 23 trading days. So, we’ve had just some monster moves here uh in April and that’s again where we see the indices turn up and where we see a lot of stocks performing quite well.
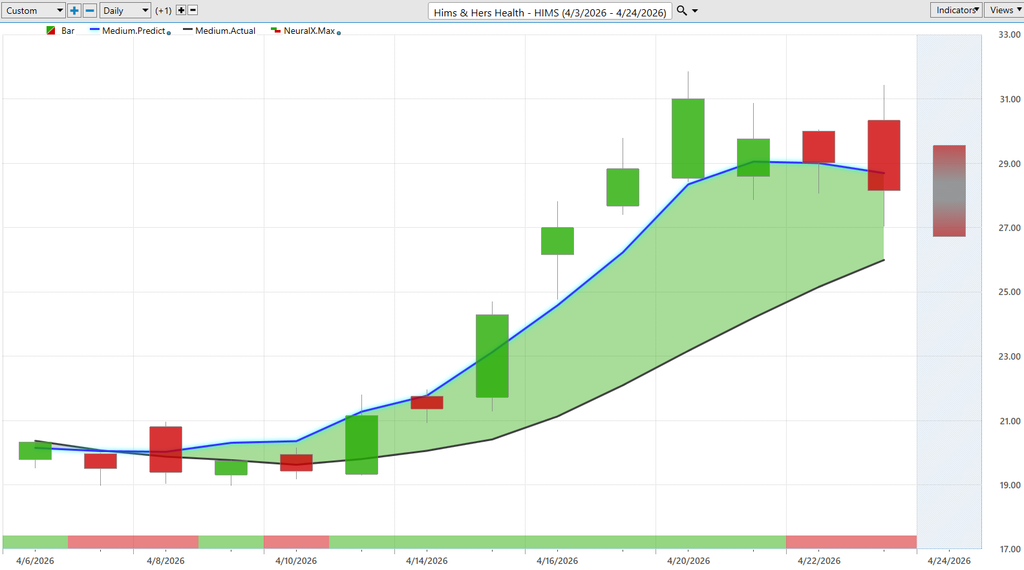
I wanted to bring him and hers in here because this is an example from uh this week here, but a great example of how all the predictive tools work together. So, a trader can come in with their time frame, their approach and create systems and and approaches off of the tools that solve the problems that are more applicable to them here. But here you see this blue line cross above the black line. But notice the neural index still bearish. Well, that makes perfect sense because look, we’re actually trading at that same price, right? There has been some selling here. We’re not quite advancing, but notice how the blue line is actually getting further and further away from the black line. So again, while in the short term we may have some short-term weakness, the trend is up. And you’d only want to look to take long positions. You see again the neural index getting bearish, seeing some lower lows, but a very bullish forecast here. A ton of separation between that predicted moving average and the actual moving average. And you see here, shares up 41% in 12 days. So just a absolutely huge move here and of course the VantagePoint predicted highs and lows. Not only are you able to catch that 40% move, but you’re getting in when the market’s just barely moving against you at all uh when you get in at those predicted lows. So getting that intraday level uh getting in in that 48 hour situation and making sure you’re in line with the overall trend often gets you ahead and in front of these really nice opportunities.
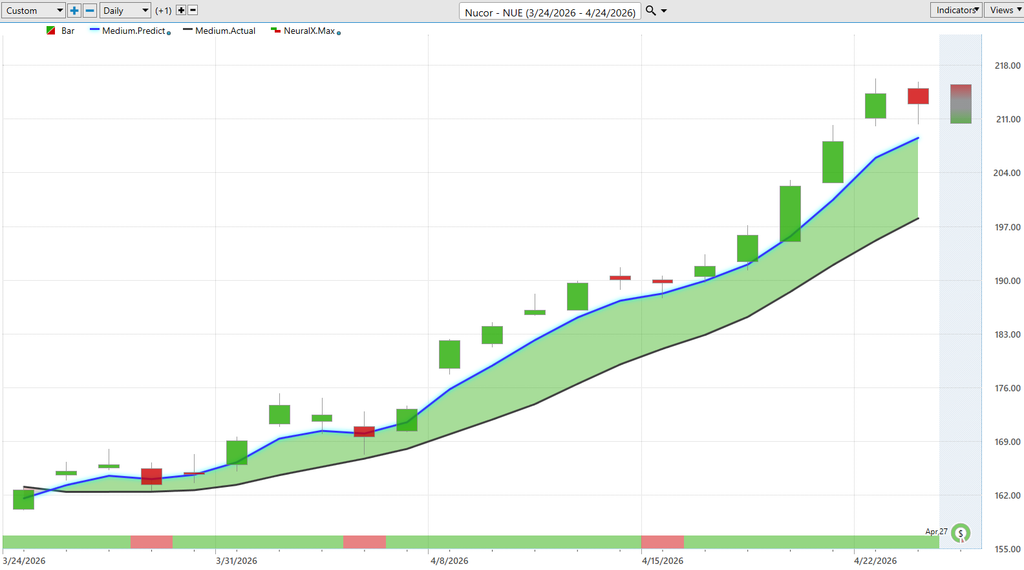
Here’s Nucor ($NUE). So we’ve seen a steel manufacturer see like cliffs natural resources. Here’s new core blue line over black line. Neural index bullish here. You see we get uh the neural index bearish. You get the sideways price action. Here’s one day where you could say I guess it’s incorrect because we didn’t get any weakness. But clearly it’s telling us the uptrend is is bullish here. you’d only want to go long, take profits on longs. Uh, and we see shares continuing to advance here. And of course the predicted highs and lows getting down to that minutia of intraday price action where you might want to scoop up some shares. And what makes this simple is you can just set limit orders into the market, right? If you say, “Okay, I want to be long this market. Maybe you already have an existing position, but you want to make sure that you manage it effectively.” And this is probably one of the strongest cases for these artificial neural networks is their ability to adapt. So we saw that, you know, the broader stock market go this huge sell-off, everyone sort of freaking out, uh, responding to a lot of these geopolitical situations going on. And in the background, there’s some monster trading opportunities opening up, offering, you know, 30 to upwards of 100 plus percent on many of these opportunities. Here you see 29% in $NUE just in 21 trading days. We see now earnings coming up and really giving you that cushion potentially to take on that earnings risk. Potentially see this trend continue higher.
J.B. Hunt Transport Services ($JBHT)
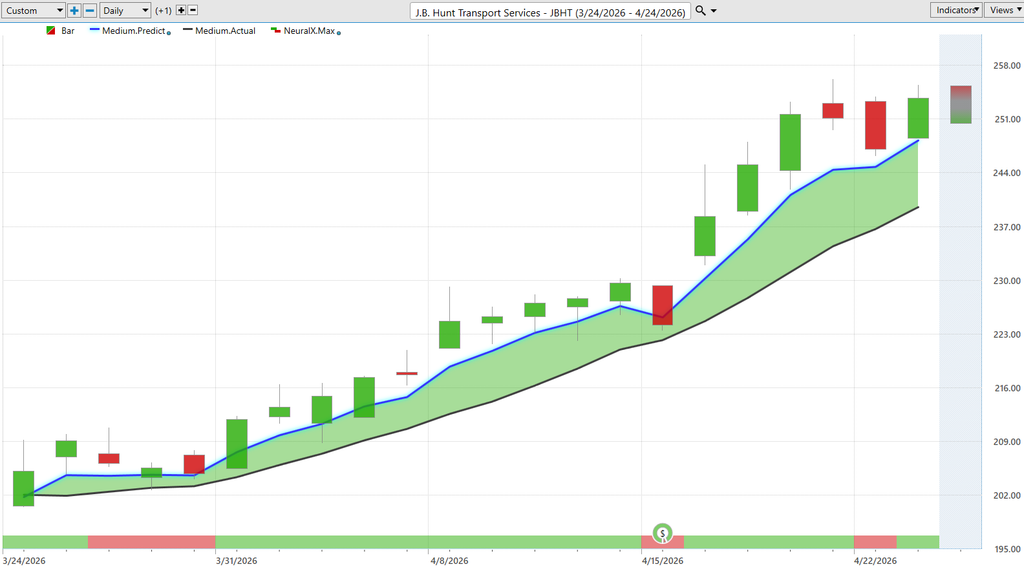
Here’s JB Hunt Transportation Services. Well, here we go. Blue line over black line. Notice that Neuralindex goes bearish and you settle out for a couple days, but the last thing you want to be doing is sort of freaking out here as the market’s not really moving. Not really moving. Maybe starts to sell off a little intraday. But the overall trend here is bullish. Uh, and we see shares pretty aggressively moving higher here, constantly bouncing off of these vantage point predicted low after predicted low after predicted low. Here’s earnings. I always like to bring things like this through because, you know, the software obviously doesn’t know what the earnings report numbers are going to be. But when you’re getting entries at a really nice uh, uh, entry price, you can often again take on some of that risk, and volatility. And oftent times that works in your favor and you see shares really responding to that the volume coming and things going aggressively higher here. So uh once again overall got a very nice move here 23 plus%.
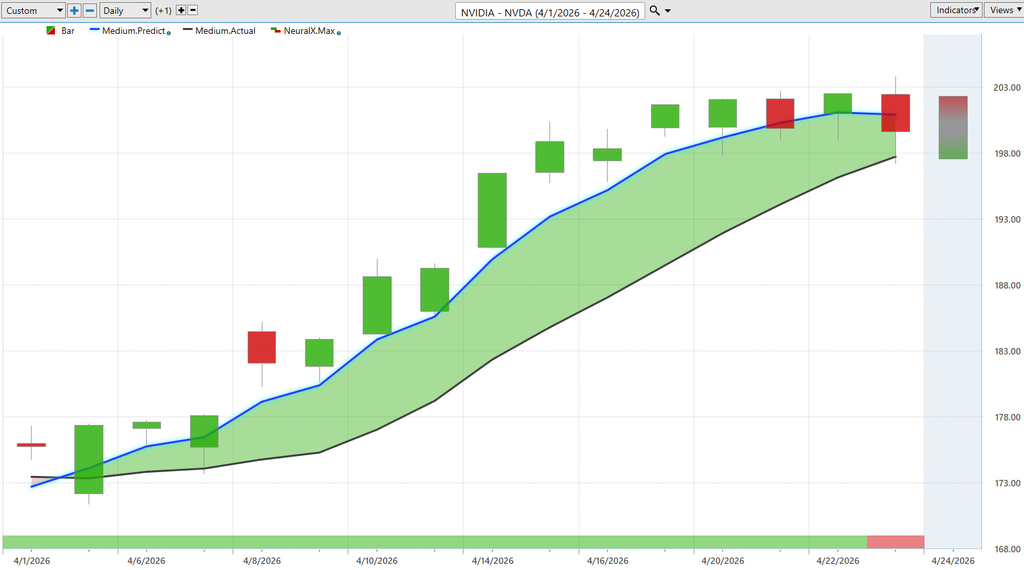
And lastly here just ending on Nvidia of course uh making this about as clear as possible. Blue line over black line. This is really what’s so effective about this is VantagePoints and Intelliscan features can really be tuned to say Hey where are those high volume stocks where we are seeing the predicted moving average create a fresh signal. and we just see again Nvidia, SPY, Amazon the cues and that can drive you to saying hey let’s go ahead and look for these choice opportunities potentially focus on these you know tech stocks and semiconductor opportunities. And really seeing those outsized gains as it makes sense to take some shots here and be on the bullish side of the market well no different here in Nvidia, but obviously a much more mature opportunity, mature stock here, up about 13 – 14% over the past couple of weeks. Very respectable. But being able to really fine-tune that, right? So, saying, look, you can maybe build a larger position uh because you don’t have to risk as much when you have a tool that’s extremely accurate uh at forecasting those short-term price movements uh and uh really adjustments made day-to-day in the stock. So again, great opportunities all over the place and some of these really extreme like Hims and Hers Health, On Semiconductor. There are numerous names out there that again are up you know upwards of 50 60% just in the month of April here. So with that we’ll go ahead and leave it there for today. But once again this has been our Hot Stocks Outlook for April 24th 2026. Thank you all for watching.
Best of luck out there and bye for now.

