Register for a Free Live Training
The Hot Stocks Outlook uses VantagePoint’s market forecasts that are up to 87.4% accurate, demonstrating how traders can improve their timing and direction. In this week’s video, VantagePoint Software reviews forecasts for W.W. Grainger ($GWW), Franklin Resources ($BEN), CSX Transport ($CSX), Ford Motor ($F) and Nucor ($NUE)
Hello again traders, and welcome back to the Hot Stocks Outlook for August 12th, 2022. Hope y’all are having a excellent week out there in the financial markets, and as always, plenty to cover here in today’s outlook. But before we jump into things, make sure you go ahead and click on the link in the description, get access to that free demonstration so you can learn more specifics of how this technology can help you make better trading decisions. We’re going to start out here with WW Granger, move on to Ben Resources in the financial space. We’ve got CSX Transport, Ford Motor, and lastly, New Core in the steel and metal side of things.
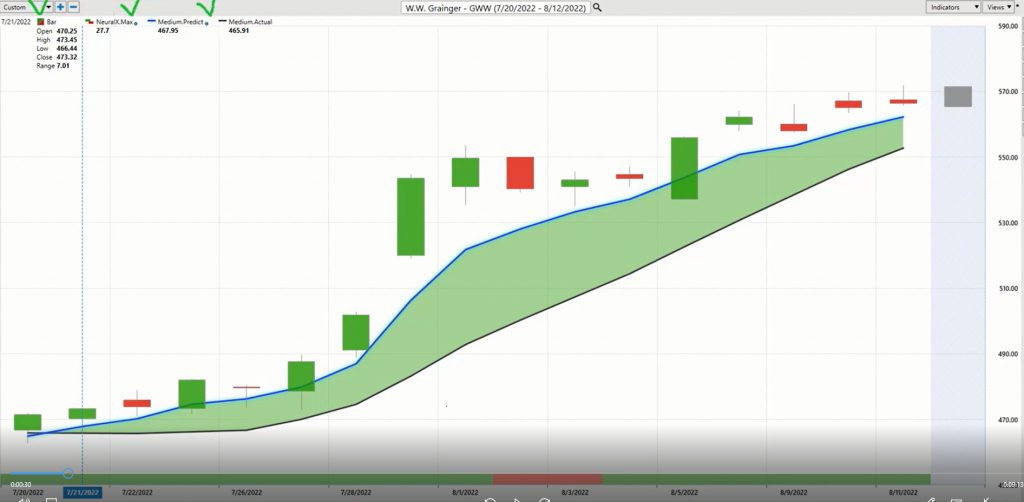
But starting out with WW Granger, which is a stock we looked at last week, really good example of how these tools are going to help you as markets move forward and you need to make those trading adjustments and adapt to things.
So what we have here is daily price action, right? So each one of these candles is representing a full and complete trading day, and right up against that price data, you’ll notice that there is a black line and also a blue line. So the black line that you’re seeing there is actually a simple moving average. So it’s a very common technical indicator. And what it’s doing here is just looking back at the previous 10 close prices. It’ll add those all together and divide by 10. And what that does is smooths out the existing price action, and lets traders know where the market has been over a given period of time. But obviously the savvy trader needs to be ahead of that next price move.
And so what Vantagepoint users are able to do is compare that lagging moving average to this proprietary predicted moving average. But for this number to get plotted and calculated against the chart for the trader every evening, this is where that technology of artificial neural networks is coming into play and it’s performing what’s called intermarket analysis. So what that means, is it’s able to understand how other markets are influencing and driving the target market that you might be trading. So this becomes very obvious when we think about things like the S and P 500, or the NASDAQ affecting your tech stocks like Apple, which we looked at week after week after week. But there’s subtle relationships happening even between individual stocks and ETF groups. And we can pull out these very important price clues that can let us know where even a certain sector may be headed next. But it bleeds all the way into commodities and interest rates and crude oil prices and metal prices, right?
And so this is what the software’s able to do, is take in all of this information, understands specifically how it’s affecting the target market that you’re interested in, and then it generates true price predictions of where things are likely headed. And it takes those price predictions and actually uses that, that technologically driven value, to construct these indicators, turning what we’re lagging indicators that are just going to get dragged around by price, into forward looking predictive tools. And so whenever that blue line crosses above the black line, suggesting average prices are going to start moving higher, therefore you might want to look to take a long position or really just express your trading style in accordance with what these forecasts are dictating.
So you see here, as that blue line crosses above the black line, you get about a 20% rally just over the past 16 trading days, but how the neural networks are trained to solve this average price problem with our predicted moving average, it’s tuned to solve a different problem here at the bottom of the chart. You see this bar, and it can go from green to red, back to green, and it gets updated each and every trading day as well, but it’s forecasting for short term strength or weakness over a 48 hour period. And it gets this right with a very high level of accuracy, upwards of 80 plus percent across all markets, through interest rates, earnings reports, all that. So this is a very effective tool to help traders manage their position and understand what they might want to do.
So as that blue line crosses above the black line, you can get that confirmation from the neural index, there’s strength over the short term. And you’ll notice that as the market runs sideways over a few days here, you get that little blip down with the neural index, but then things advance and you just see how accurate this forecast is at telling you, “Hey, there’s short term strength. The trend is up. Therefore, what would you like to do?” But that’s not it, right? You’re even provided a intra day predicted high and low level, which really rounds out the entirety of this forecast. So you got the overall trend direction, short term strength or weakness, predicted highs and lows.
And the trader can bring in any other trading approaches that they might want to do, whether they be short term, longer longer term trading options. And so what we can do, and as we do every week, is take a look at how accurate those actual short term predicted high and low price predictions were against the actual market data that occurred. And you can see how effective this is for the trader, who has a directional bias, understands if they want to be getting long or short, and then can keep exploiting that opportunity. Here where the neural index gets bearish, well, perfect time to look for those cheaper prices to express that long position, and take some pieces out of that 15 plus percent move you got over the past few weeks.
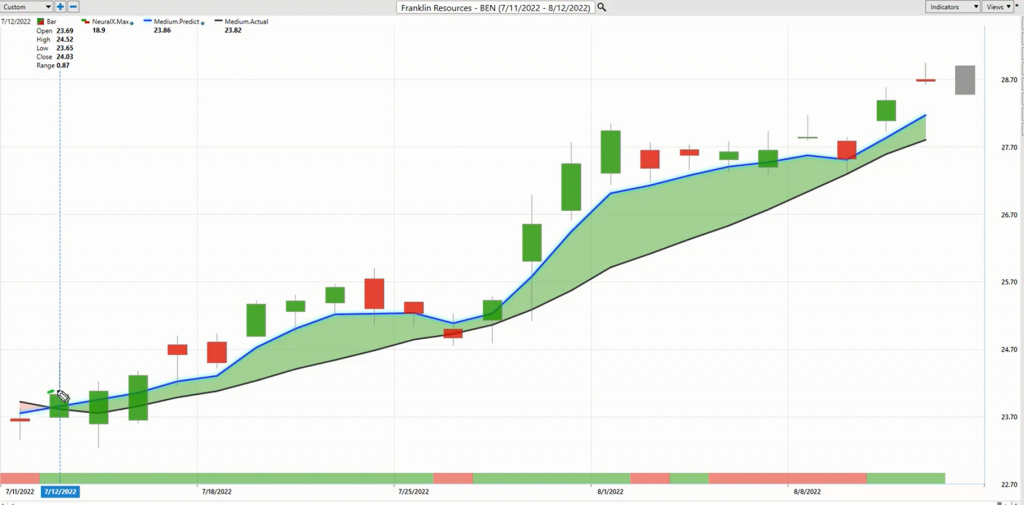
Now, here’s Franklin Resources. And we actually looked at this while the S and P and the broader markets, Microsoft, all these things actually took a leg lower. It was actually a big clue that things had to go lower still. And so what we see here at the really midpoint of July is that Franklin Resources has a blue line crossing above the black line, a neural index very bullish. And then we can look at the duration of this forecast. Now we have a little bit of some sideways price action here for that 48 hour period moving forward, a little bit of sideways price action over this period, but overall, the markets are very bullish. As long as that blue line is remaining above the black line, well, you’ve gotten an excellent entry on this market and you’ve got exposure to the financial space here, about a 20% rally in 23 trading days.
And again, for the short term trader, who over that 23 trading days consecutively may want to say, “Look, if doing anything here, I should be looking to buy down at these predicted lows, and looking for the bigger move to continue to the upside.” So here, just a tremendous rally here. But it’s really wrapping up the entire markets, right? And this is why it’s so important if you want to make money, you got to be doing the right things in the market. It’s either completely up or completely down, and you really don’t want to be on the wrong side of this big macro volatility that comes through the indexes and the dollar and crude oil.
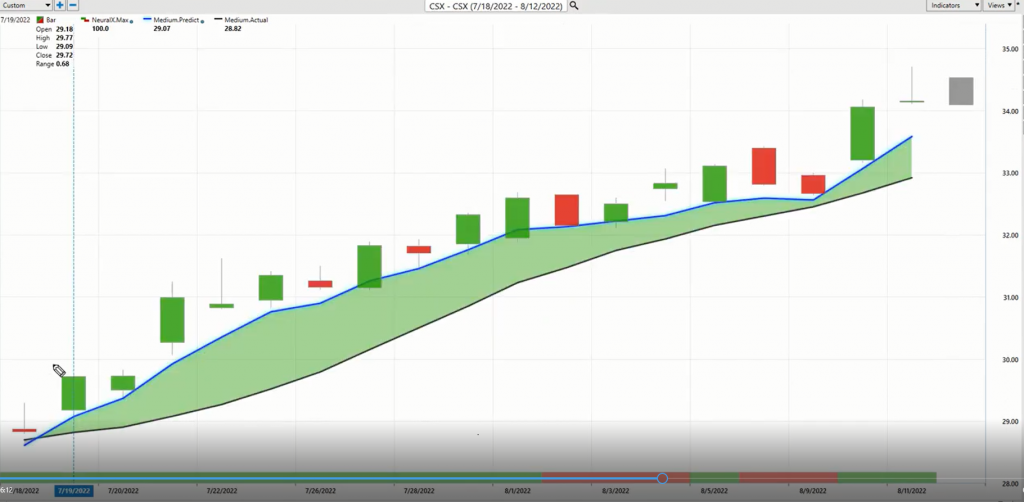
But here’s CSX. They’re moving over the transport space, and very interesting sort of move here as we see that blue line crossing above the black line. And what’s so interesting about this is, sometimes it’s really hard to participate in those trends that keep moving higher and higher. But what we’re going to notice is when we go ahead and bring in those predicted highs and lows, and we can look at this, the neural index as the market runs a little bit sideways here, but look how accurate these predicted highs and lows are at forecasting, “Hey, in the short term, where do you want your attention to be? Where do you want to be looking if you want to start accumulating a position here in CSX?” And even though it keeps grinding higher every single day, this software keeps updating those forecasts so that you can stay in accordance with that and make some money as this rally moves higher in shares of CSX. So another opportunity here, blue line over black lines, shares up about 17% in the past 18 trading days.
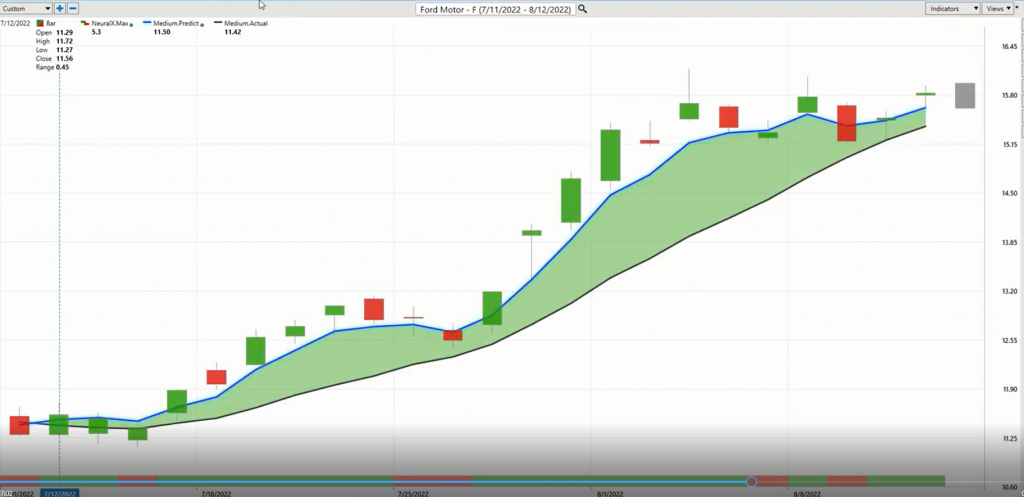
Here’s Ford Motor. Now we looked at this a couple of weeks ago, and it’s just been a really fantastic trading opportunity. And so, yeah, I definitely encourage you to go back and really watch these forecasts from really late June, moving forward here, it’s pretty much been all bullish. Here Ford share is up 37% in the past 23 trading days. And you see just how bullish this forecast is over the duration. You have a blip here in the neural index, little blip here, little blip here sideways, but very clearly you want to be on the right side of that 38% move. So I definitely encourage you that if you’d like to learn more specifics about this technology, click on that available link, get that live demonstration and understand how this technology is really going to help you see where your blind spots might be and open yourself up to some really tremendous opportunities that don’t seem entirely obvious when they get started here. So really nice rally there in shares of Ford Motor.
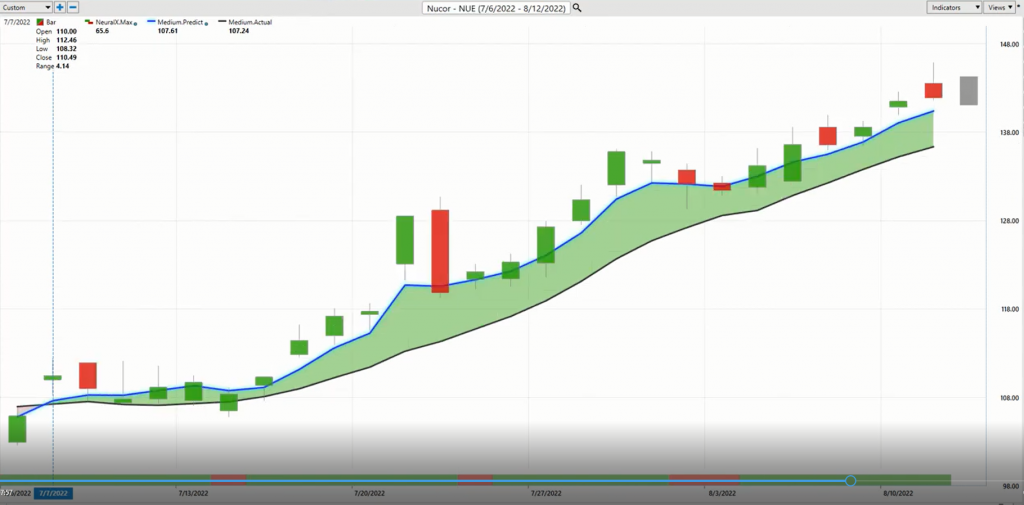
And here’s NuCor. So steel, metal, mining, getting some exposure to the commodity raw material side of things as well through individual stocks. And here you see just how tremendously bullish this forecast has been. When you look at this, we can look at how many days this rally has moved higher, just as a little bit of a study here, this market’s moved higher over 26 trading days, 25, 26 trading days about a 32% rally. And you see here, over those 26 trading days, there’s only four days where that neural index has read bearish. So when you’re looking at these areas of the market and trying to figure out, “Hey, short term, long term, well, what should I be doing? What would my behavior be potentially over this 26 days?” Well, it’s going to skew you to taking those long positions and recognizing all this bullishness throughout the market.
And to that point of recognizing the bullishness, well, we have tremendous features that are helpful in here, like the Intelliscan. So you can literally scan through all the sectors of the stocks, hundreds and hundreds of different stock opportunities, and identify the strongest forecast where this technology is recognizing that there’s a strong condition there that you may want to be a part of that matches your trading style. So this is what’s really fabulous about this, is a trader can really tune this up to really identify the types of opportunities that you want to trade. Whether it’s capturing the whole swing on this 32%, or day trading, or trading options. However you want to express that trade, you got to get on the right side of things and understand that bigger picture of where stock’s headed, where is oil headed, and how is that going to affect your overall portfolio? So once again, this has been our hot stocks outlook for August 12th, 2022. Thank you all for watching. Best of luck out there, and bye for now.