


Hot Stocks Outlook for the Week of
August 21st, 2020
The Hot Stocks Outlook uses VantagePoint’s market forecasts that are up to 87.4% accurate, demonstrating how traders can improve their timing and direction. In this week’s video, VantagePoint Software reviews forecasts for John Deere (DE), Hormel (HRL) Whirlpool (WHR), Alexion (ALXN) and Overstock (OSTK).
Register for a Free Live Training
This Week’s Hot Stocks Outlook
Hello again, traders, and welcome back to the Hot Stocks Outlook for August 21st, 2020. Hope you’re all having an excellent week out in the financial markets and as always, a lot to cover in this week’s outlook.
John Deere (DE)
So we’re going to go ahead, start out here with shares of John Deere. We also have Hormel Foods, Whirlpool, Alexion Pharma, and lastly, Overstock.com. So starting out with shares of John Deere, a really good example of how this software works. What we have here with these candles is daily price action. Each one of those candles represents a full and complete trading day. You’ll see right up against that price data, you have a black line and also a blue line.
Now, the black line that you see on the chart there, that is a simple moving average, very common technical indicator. What it does is it looks back over the previous 10 candles, adds all those close prices together, and divides by 10. It acts as a good measure, really a rolling value of where market prices have been over a given period of time. But obviously, as traders, we want to understand, “Okay, well, where are prices going moving forward?” So what we’re able to do is actually compare that black line to this blue value that you see against the chart, and that’s actually Vantage Point’s proprietary predicted moving average. So what that means is Vantage Point is actually utilizing a technology of artificial neural networks and performing what’s called intermarket analysis. What’s happening here is rather than just looking at the past prices of John Deere, what we’re doing is looking at other markets that are known to drive and influence the future price of John Deere moving forward.
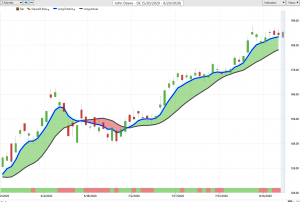
Now, markets share very important relationships, whether that be things like the S&P 500, that can be other individual stocks, ETF groups, global currencies, and global interest rates, and also the futures and commodity markets. So what’s happening here is by understanding those relationships, we’re actually generating future price predictions that are actually built into the value of this predicted moving average. So rather than having an indicator that only looks at what’s already occurred in the past, you have actual predictions going into the value of not only this indicator, the predicted moving average, but also this neural index at the bottom of the screen and also being used to pick out intraday predicted high and low levels for the next trading day.
So when we look at this chart for John Deere, what we can see is when we have this blue line cross above the black line, it’s suggesting average prices are going to start moving higher. Now, in addition to that, you also have, again, this neural index at the bottom of the chart. This indicator can go from green to red. It is a binary, sort of a one-zero, yes or no, up or down output. That’s always looking ahead 48 hours. What that’s highlighting is short-term strength or weakness in the market over that shorter-term period. When we combine that with the overall trend and then use the help of these predicted high and low values, we get a good overall forecast guiding us forward with our trading.
So what we can do is understand that, “Okay, well, once this blue line crossed above the black line, we can clearly see that the market went into a nice uptrend. As long as that blue remains above the black line, the overall trend is still up.” So you’ve got a 23% rally here just in the past 35 trading days, so a 500-share position there has you up about $18,000. But here’s the thing is obviously one can do some trade management or even some shorter-term trading over the course of a trade like this, and we can actually bring up those predicted high and low values against the actual price data. So if we look to the right of the chart, we can see really a shadow candle here that are the projections for today, but we can look back and see how accurate are all of those predictions on the actual market data before it occurred. You see that you get this very accurate measure of where you should look to be buying into a potential market.
Once you identify that overall trend direction, you can gauge that short-term strength or weakness. You see you get that neural index moving to the red configuration here. You’re having lower lows over those 48-hour periods and moving towards that predicted intraday low level. But over the course here, you see about one, three, four, five, six, seven, eight, nine, 10, 11, 12, about 12 entries as the market moves up. What that gives you the potential to do is add to or manage an existing position. So once the market has started its ascent, you understand that look, if the trend is still moving higher, you can go ahead and use those potential profits or those unrealized gains and manage that position effectively taking profit along the way but being able to get those better entry prices near those intraday low levels.
Hormel Foods (HRL)
So we can take the same approach add that to Hormel Foods and same thing. We see this market moves into an uptrend. We have that blue line crossing above the black line. Very little red from the neural index here. You see, you get a couple of days here where you run a little bit sideways here, but not really at all. But you have that blue line well above the black line saying, “This is a very strong trend.” Of course, on an intraday basis, day-to-day as we move forward, we want to say, “Okay, well, what level should I be looking if I want to go ahead and add to a position or potentially take a day trade?” Understand that if this market’s in an uptrend, I can buy at the lower half of the range and look to take profit towards the predicted high.
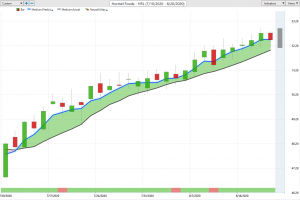
You see, pretty much in all of these instances within 48 hours, you’re getting a very nice push in that market and moving towards those next day’s predicted highs. So this can set up some shorter-term trading for you or again, manage a existing trend. So if you get in at the beginning of that move, holding onto the position and using those accumulated profits to potentially build a even larger position here. So we see in this market, it’s only up about 8%, but that’s just over the last month here. Another 500 shares has you up about $1,900 here.
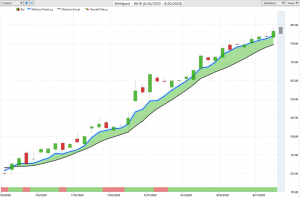
Now, same approach, we can take that to shares of Whirlpool in a very similar situation where we’ve gotten a lot of markets that have been in very strong uptrends. So when you can recognize that and say, “Okay, well, if we can find a market where this blue line is above the black line.” We can actually do that with the help of the scanning feature, where we can find fresh trading opportunities as far as new crossovers or markets that are in strong uptrends to identify a directional trading for us. But we see her in Whirlpool, a strong move higher back all the way at the beginning of July. Again, you can see how accurate all of these intraday levels are, where you see you’re getting one, two, three, four, five, six, seven, eight, nine, 10, 11 entries over what’s probably about 30 trading days or so as this market makes a nice advance over really the past couple of months of calendar time here.
Whirlpool (WHR)
But shares here of Whirlpool up 44% just in the past 35 trading days. Again, just 500 shares there has you up $28,000. Even a 100 shares is going to have you up over $5,000, so really nice opportunities here to take out a relative small position and potentially build that position as that trend continues. Again, as long as that blue line remains above the black line, the overall trend direction is up, and therefore, you want to remain long.
But we’ve actually seen some weakness in some areas of the market. Actually, a lot of the pharmaceutical stocks that gave done really well really towards the end of March when the entire market started to turn higher, have not really performed well here. We see Alexion Pharmaceuticals an example of this. So usually on the way down, you end up getting a lot of choppy markets. You see this big move lower, a big retracement, and then that continuation. But over the duration here, that blue line remains above the black line. Of course, you would want to look towards those predicted highs as areas to potentially short. So again, you see even on a day like this where you close towards a predicted high, that predicted high and low for the next trading day is saying, “Look, expect some higher prices over the next trading day.” You get a bounce there, but the overall trend, again, then eventually moves lower here.
You sometimes get days like this where you see that all the price action carried things lower. Next trading day, you move pretty much straight up to that previous predicted high level, and then that downtrend resumed once again. But you get that really good measure of, “Okay, well, if I want to be short, where do I want to come in and stake out a claim on that market?”
Alexion Pharma (ALXN)
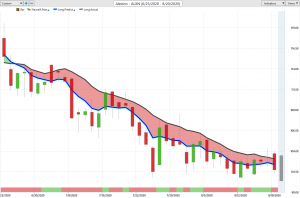
Shares of Alexion have not performed well here at all. So over the course of this move, seen a pretty nice decline about 10%. Obviously, the overall market’s still quite bullish. You’ve seen a lot of markets just move to new highs. The NASDAQ, tech stocks, a lot of these things doing very well, but we can also find those areas that we really should avoid, that really aren’t poised to see the sort of percentage gains that we’ve seen in some of these other areas.
Overstock (OSTK)
Specifically here, Overstock.com, so this is a market we’ve brought in really repeatedly. I think the last time was about July 30th, so really the end of July going into August. You see how when a market really starts to trend, that volatility can really crank up and you want a tool that’s really adaptable. That’s where a Vantage Point comes in and is able to really adjust as the daily volatility and the range expands, those predicted highs and lows do a good job of taking that into account. So when we look at this move, we see getting a uptrend all the way back here, going back to around $21 a share, getting that blue line crossing above the black line. But we can, again, look at those predicted highs and lows and more specifically, after the last time we brought this through on the 31st.
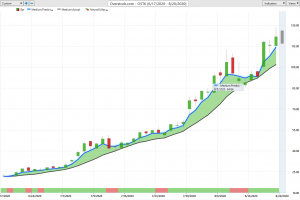
You see that if you’re still participating in this market, we understand the overall trend is up. We may get those days where we blast past that predicted high. But notice on days like this, you get a move lower, close pretty much right at that predicted low, says, “Look, expect some lower prices over the next trading day.” That happens as well. But as this market recovers, some more entries to participate on the upside and really just buying on a retracement or we see here this market moving lower, saying, “Look out towards these predicted lows.” Just in the last six or seven trading days, you’ve got another 37% rally to the upside. When we look at this over the course of the entire move, really looking at a 450% rally. Again, a very small position for a $20 stock. 500 shares has you have about $50,000 there.
So there’s really tremendous opportunities. But of course, you want to understand that, “Okay, well, if I should get into Whirlpool here, should I stay involved in the market?” As long as that blue line remains above the black line, Vantage Point is still forecasting that trend to the upside, and you can use the guidance of those predicted highs and lows to deal with, again, short-term volatility. See, the neural index goes bearish, you get that weakness over the next 48 hours but you know intraday what level should you be looking at good intraday by points if that trend is still in fact to the upside? And a really nice rally and move there where, again, since the 31st, probably up about 40%, 45% or so. So once again, this has been our Hot Stocks Outlook for August 21st, 2020. Thank you all for watching and best of luck out there in the markets and bye for now.


