


The Hot Stocks Outlook uses VantagePoint’s market forecasts that are up to 87.4% accurate, demonstrating how traders can improve their timing and direction. In this week’s video, VantagePoint Software reviews forecasts for Motorola (MSI), Callon Petroleum (CPE), IAC/ Interactive (IAC), Incyte (INCY) and Joyy (YY)
Register for a Free Live Training
Hello again, traders and welcome back to the Hot Stocks Outlook for August 27th, 2021. Hope you’re all having an excellent week out there in the financial markets. And as always, plenty to cover here today in the outlook. Now we’re going to start out with shares of Motorola really to act as an example of how all of these indicators work. But then we’re going to get into a lot of the nitty-gritty of the things we’ve been covering over the past couple of months, notably what’s going on with energies and specifically equities as we saw some volatility coming to the markets mentioned a little bit last week that this actually looks like opportunities are arising.
Motorola
Those deep dip in prices may actually be a good opportunity to get long. And it looks as though those global intermarket relationships are driving a lot of this. So we’ll take a look at Motorola here and what we have is daily price action. So regardless of the markets that you’re trading, all the forecasts work exactly the same. And so what you’re seeing here is end of day data. So every one of those candles represents a full and complete trading day and right up against that price data, you’ll see that there is a black line and also a blue line there.
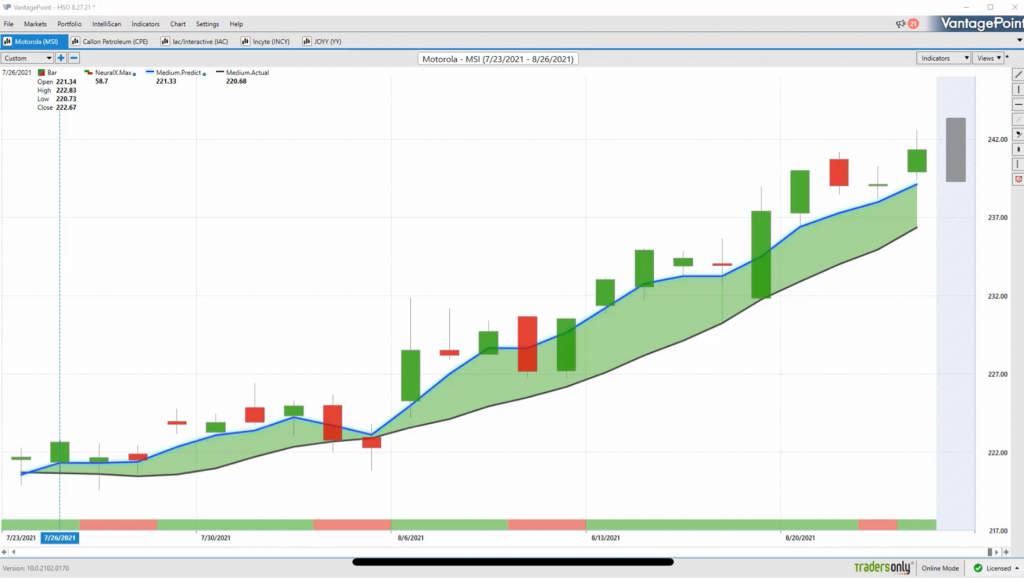
Now the black line that you’re seeing there is a regular simple moving average or what we refer to as the actual simple moving average and a very common technical indicator. And that is just going to look back over the previous 10 closed prices in this case, divide by 10. And that gives you a good rolling measure of where market prices have been. But traders obviously need to be ahead of the move and understand where prices likely to go moving forward ahead of time. And so what we’re able to do is compare that black value or that lagging moving average of where the market has already been to this predicted moving average.
And it’s important to understand for that value to actually get plotted and calculated each and every trading day and generate this Vantagepoint predicted moving average, what’s happening is Vantagepoint is performing what’s called intermarket analysis. So looking at relationships between markets and utilizing the technology of artificial neural networks to do that. Now, what that means is that rather than just looking at the past prices of Motorola like traditional technical analysis does, Vantagepoint is able to understand what markets drive and influence future price.
Now that can be things like ETFs. That can be things like individual stocks. That’s certainly going to be things like the global indices like the NASDAQ or the S&P 500. But it’s also going to be things like global currencies, global commodities like crude oil, global interest rates. So this is what’s going on and actually driving things like the S&P 500 higher. Driving things like oil lower, driving the dollar higher and all of these things are affecting the markets that you’re trading in whether you like to believe that or not.
So when we look at Motorola, what we have here as far as the forecast, did you see this blue line crossing above the black line? and that’s suggesting average price are going to start moving higher. You can bring in whatever strategy you want, but as a trend trader, meaning a version trader, however you want to approach this, you suggest you might want to take these directional trades to the upside. It looks like average prices are going to move higher.
Now at the bottom of the chart here you’ll see you have this bar that seems to go from green to red back to green. Well, what this is doing is actually again utilizing that same technology of artificial neural networks applied to intermarket analysis looking at relationships between markets. But if you understand a little bit about artificial intelligence and neural networks that you have to train the neural networks to find what the end goal is. What are you actually trying to get at? And so, while our predicted moving average is trained to utilize that predictive data that gets generated and build it into a predicted moving average. And it does include some past prices as well like a regular moving average, but the predicted neural index is specifically looking ahead 48 hours. And it’s looking for very short-term strength or weakness in the market. And of course, that’s updated every single trading day.
So this again is only looking ahead, very short-term weakness typically we can tie it in. Are we in an uptrend? Are we in a downtrend? And can help us with the overall trade management. Now to really round this all out, you’re also given a predicted high and a predicted low. And if you really understand this, you’ve got the trend direction, you’ve got short-term strength or weakness, we’ve got an intraday predicted high and low. And what’s really happening is you’re getting a very good adaptive technology that as the market shift, as the dollar moves, as ETFs move, it understands how those are likely to play out and affect the future prices of these markets.
So you’ve got the overall trend direction, short-term strength or weakness as well as even intraday levels to be buying from. So you don’t need to be looking at five-minute candles or 10-minute candles or any of this. You’ve got the levels ahead of time that say, “Just put a limit order the day ahead the night before the market even opens.” And you’re going to be waiting here. And typically in markets like this you have very little volume takes place at these price levels, especially things like this where you get picked up at the open. You’re going to be immediately picked up and the market’s going to immediately start resuming that trend.
But you see about five entries as this market has moved higher, but there’s many strategies you could execute here. If you’re a day trader, you understand, “Hey, you only want to be a buyer in the market.” Want to buy at or near those predicted lows, target the predicted highs. But you want all that behavior in a period where the market is moving up 9% over the past 22 trading days. And even throughout that volatility, you’ve seen here very straightforward as far as the forecast saying, “Look, this is up, there’s strength here.” And if we get again that S&P made a move lower, now it’s coming back and we see this as just benefiting the whole time.
Callon Petroleum
Now let’s go over to Callon Petroleum because this is a stock that we kept bringing through over the past couple months and highlighting that you really need to get out of the way of energy and oil stocks. We saw this play into the Russell, but Russell hasn’t gone anywhere since February of 2021. Whereas the S&P has moved higher and moved higher. And so what happened was this period where it became very clear that energy stocks are a problem. You either want to short them and actually add them to your portfolio to hedge your long positions that are doing quite well or just outright look to short energy, short crude oil, or all these things.
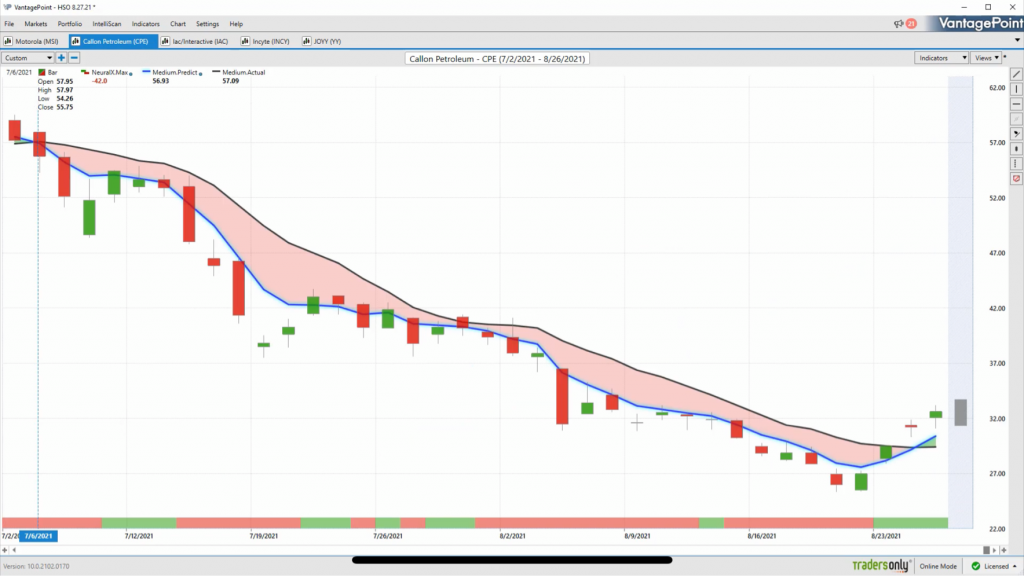
But this has happened really at the beginning of July, early end of June, July we start to see these problems emerge. And so with Callon here and we see that we’ve just got crossover to the upside that very clearly says, “Look, this is over. Cover your position.” But what I want to highlight here is not only just the 44% decline and we can go ahead and look at those predicted highs and lows. They’re going to help you short this market with very little risk as far as the market moving aggressively against you over that time period. At the end of the move here, we start to come higher.
But what we understand here is that crude oil was very weak. We knew that you don’t want to mess around with crude oil futures. If anything, you want to short and you want to short from a couple months ago. And we’ve seen that volatility come in and the markets absolutely sort of the upside, but what’s really happening here? And what you can really recognize when you have a tool like Vantagepoint is we can run these scans of through the IntelliScanFeature. And what that allows us to do is actually scan for these predictive indicators, whether that be fresh crossovers because we’re trying to trend trade or we’re looking at predictive high and low ranges.
But we can enter whatever we want into this IntelliScan to really find us exactly what we want to see. So I can go ahead and open this up and you can see a little bit about what goes on here, but you want to go ahead and set these things up according to your trading strategy in here. We have our predicted moving average, our neural index and these tools are again using that neural network technology, but forward-looking and predictive. So that what we’re able to see is when the market start to shift.
IAC / Interactive
So not only is this scan helping us recognize that, “Hey, Baker Hughes and Callon Petroleum and crude oil futures, all these things are moving to the downside. We need to take short positions.” But conversely, more recently what happened is we had that big dip in the S&P 500. And so as you’re running the scan, you start to realize that it looks like there’s actually a lot of opportunities coming through to the upside. Now, whether those will turn into longest established trends, well, we’ll have to see. And that’s where the adaptive aspects of the technology are going to help us manage the position as it progresses.
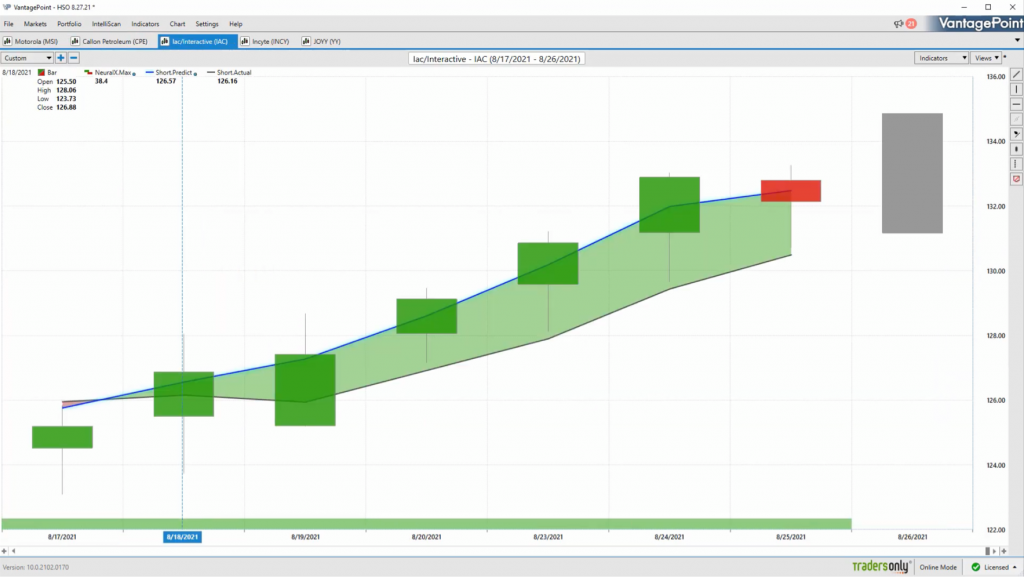
But we saw a lot of similar positions come through and it was indicative of there are some areas throughout the S&P 500 and stocks where you want to go ahead and start taking long positions. You see this crossover coming through on 818? Meaning by 819, this is the day you’re looking to start taking positions. You can see we’ve hit predicted highs. You can take profit along the way, again, in accordance with your trading strategy. But you got about a 6% cushion on some of these entries from a few days ago.
Incyte
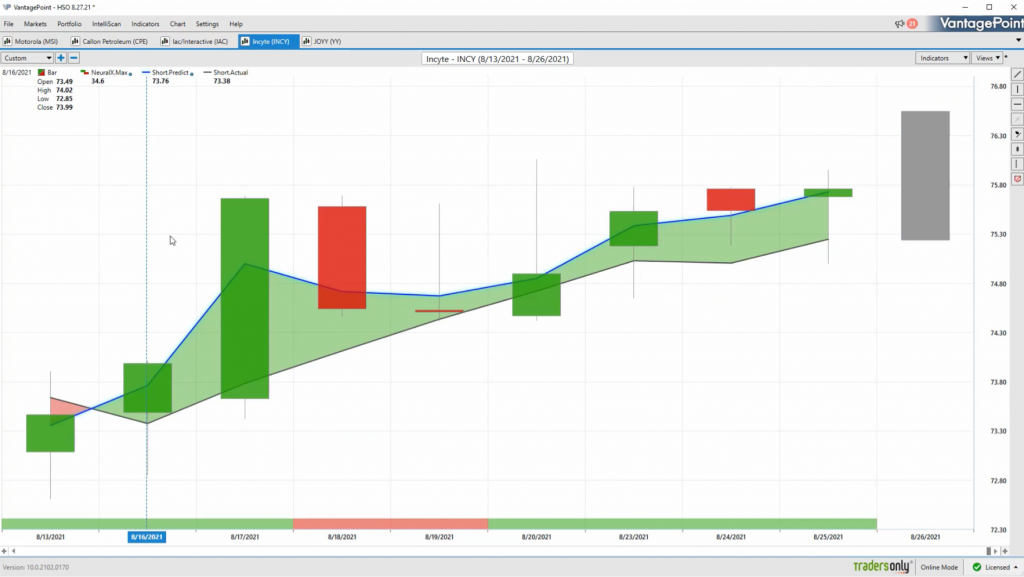
And if again, the S&P keeps moving higher, well, these will likely benefit and keep trending higher as well. Here’s insight crossover to the upside here on 816. You see we get a big move higher, a little sideways action as the neural index goes bearish. Again, this is a 48-hour indicator. So it’ll highlight that short-term weakness in the market, but the overall trend is up. If you’re using predicted highs and lows intraday. Well, you’re trying to buy, target the predicted highs and that’s the game plan. You’ve got this roadmap going forward how you might want to approach this, but all your entries were coming through a couple of weeks ago when many of these crossovers came to the upside in many of these markets. And that’s also sent the signal that they’re strength in equities, a decent amount of it. That’s bullish for stocks generally.
Joyy
So we understood, yes, energies have been weak, but keep a close eye on these things. Sure enough, you see these things reversing and you see a lot of stocks like here’s JOY getting very bullish here. So you just crossover again to the upside and just how similar all of these markets look. And the reason that I’m bringing this through here is to highlight that when you have a tool like Vantagepoint that’s utilizing this predictive technology and you’re able to scan huge sectors of the market. We’re scanning dozens and dozens of energy stocks, technology stocks, financials. We can get this good cross section of the market and when we’re doing that we’re able to identify these big shifts that happen in the market.
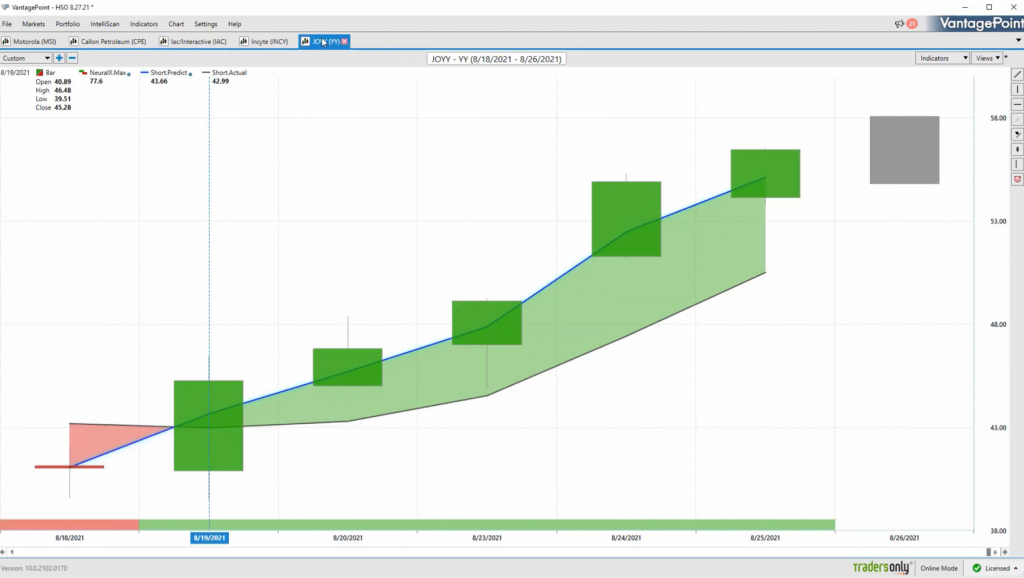
And so, what it looks like potentially is happening here is a big shift in dollar. We’ve had a big rally in dollar. Dollar has been extremely strong for the past couple of months. That’s probably been a aspect of why you see gold went down very aggressively. You see crude oil going down, but a lot of those conditions are shifting. And that would actually be very bullish for things like energy, which you’ve seen really perk up, commodities generally and even stocks where we’ve seen at least entries into many of these opportunities coming through with the Vantagepoint software. And again, things like JOY here, this thing is absolutely broken out. I think it hit 65 or so today. It was just gapping up and going crazy already about a 31% move.
So again, hopefully if you’ve been watching these Hot Stocks Outlook over the past what’s now going back, we can go back to July. We talked about mid-May as well, was a big bullish swing higher and here’s First Solar. So go back three months and watch how we’ve pieced together these narratives and then can go in with the Vantagepoint tools with these short-term forecast and really make the most of these trading opportunities when they open up.
But obviously, we want to be ahead of the big narratives and understand that over the past couple of months, crude hasn’t been the place to be. But something recently shifted in stocks and also energies as well. So we can be ahead of that and understand, adjust the portfolio and set it up to benefit as more volatility comes in the market and things start to move. So once again, this has been our Hot Stocks Outlook for August 27th, 2021. Thank you all for watching, best of luck out there and bye for now.


