


Hot Stocks Outlook for the Week of
August 30, 2019
The Hot Stocks Outlook uses VantagePoint’s market forecasts that are up to 87.4% accurate, demonstrating how traders can improve their timing and direction. In this week’s video, VantagePoint Software reviews forecasts for Barrick Gold(GOLD), Alliance Data Systems(ADS), Facebook(FB), United Healthcare(UNH), and JetBlue Airways(JBLU).
This Week’s Hot Stocks Outlook
Good afternoon traders and welcome back to the Hot Stocks Outlook for August 30, 2019. Hope y’all are having an excellent week in the financial markets and there’s always plenty to cover. We’re going to go ahead and start out here with shares of Barrick Gold. We’ve got Alliance Data Systems, Facebook, UnitedHealthcare and lastly, JetBlue Airways.
Barrick Gold(GOLD)
Starting out here with Barrick Gold, we can see that what we have here are daily bars. Each one of these candles represents a full and complete trading day. And against that price data, you see there are a few indicators. Well, right up against price, you see there’s a black line and also a blue line.
What that black line is is what we call an actual or simple moving average. Very common technical indicator, just takes the past 10 close prices, adds them all together, divides by 10 and just plots that line moving forward.
The problem with that is it gives you a good barometer of where market prices have been, but it doesn’t tell you where things are going. So what we want to compare that value to is this blue line generated via the artificial intelligence found within VantagePoint.
What VantagePoint is able to do to go ahead and plot this predicted moving average is actually look at other related markets and how they’re known to drive and influence future price of Barrick Gold. So that can be again, the Gold Futures markets, ETF groups, individual stocks, currencies, interest rates. So very important information is actually utilized and brought into that calculation.
It’s actually used to generate future price. It’s built into the indicator. So once we have that blue line crossing above the black line, it’s signaling that look, average prices are expected to move higher.
Now, in addition to that moving average, we also at the bottom of the screen, you see that we have this indicator that goes from green to red each and every day. This is a very short-term indicator, so it’s only looking ahead 48 hours at a time and letting you know really about short-term strength or weakness in the marketplace.
Once you have that overall trend direction, this can help you understand, Hey, are we likely to have some continued strength and a breakout or more likely to have some retracement and then a chance to get in at better prices?
As long as that blue line remains above the black line, you can then go in and use tools like the predicted high and low, which now we actually have an intraday level that’s generated via that neural network process. When we really bring this all together, you get a good roadmap that says, “Okay, well, I’m going to go ahead and look to start getting long in the market, but intraday at what levels would be advantageous to add to that position or initiate a position.”
You see really how this works out and you see interesting days like this. We have a predicted high and predicted low, market closes, gaps up almost immediately the predicted high and then moves back into that predicted range there. But multiple opportunities here, about five or six opportunities to go ahead and get long over the past few weeks here in Barrick Gold and shares are up over 12% to the upside.
So really nice opportunity there as gold breaks out and continues some of these trends higher. We’ve been watching the gold market for a significant amount of time here as these markets just continue to move higher along with a lot of these gold stocks.
Alliance Data Systems(ADS)
Here in shares of Alliance Data Systems, just the opposite. So we see just over the past few weeks, traditional stocks outside of gold, silver. You really want to be shorting the market or have something in your portfolio that takes advantage of the weakness and volatility of the downside.
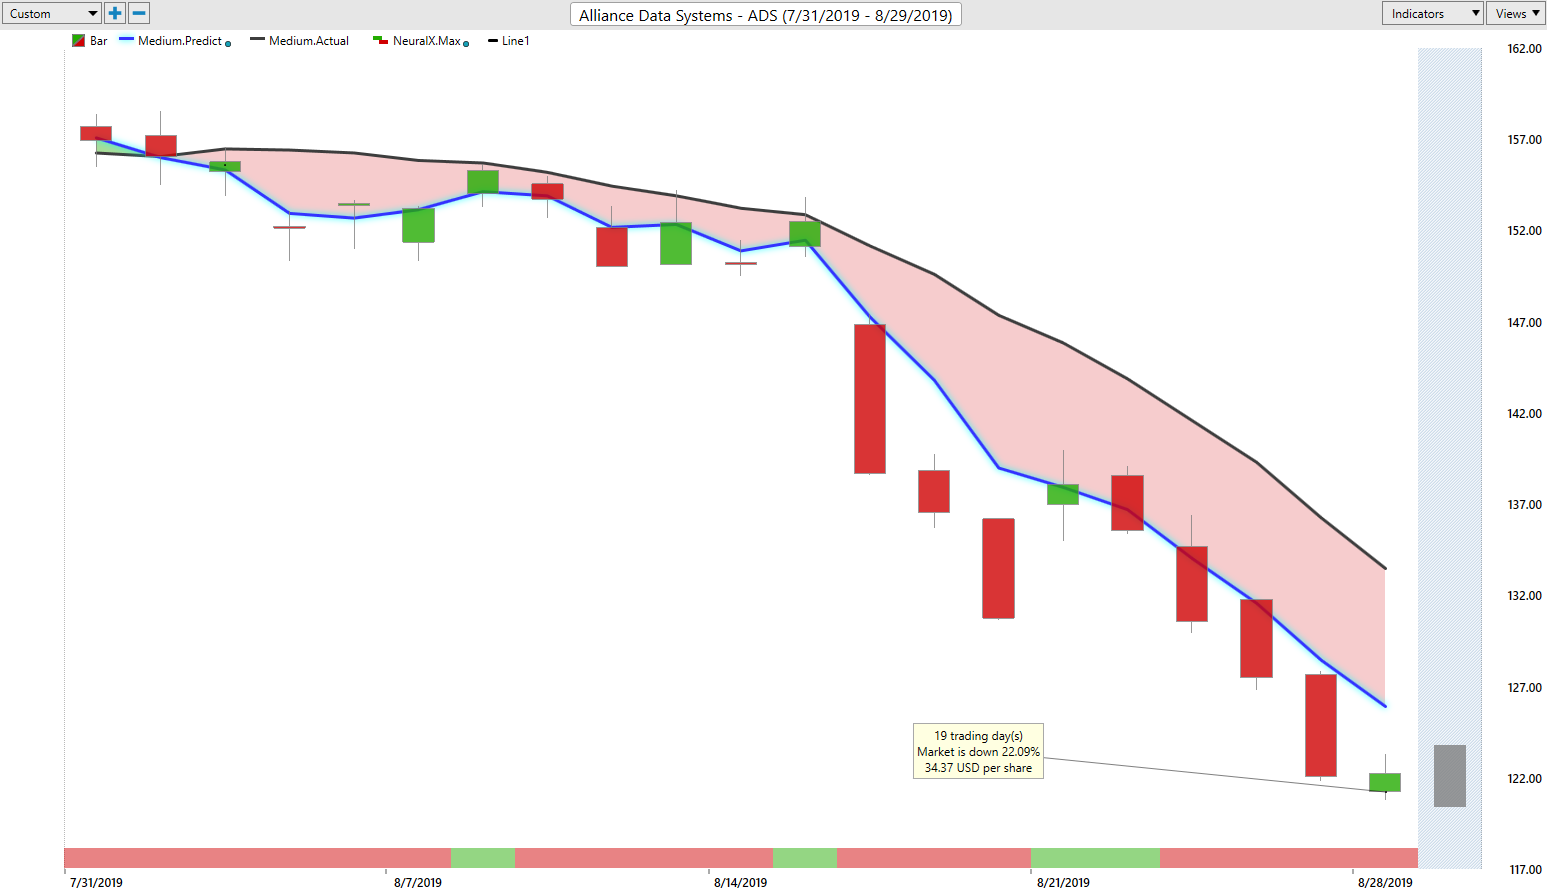
But here’s Alliance Data System’s crossover to the downside. You see the neural index is very bearish there. It only pops up a couple of times over the course of this trade.
But again, you want to be using those predicted levels. So understanding that, okay, well intraday, if I’m going to come in and look to short the market, where do I want to start those trades? You see this market off 20% just in the past 17 trading days and you see the trend obviously still very much to the downside here.
What happens is you get those opportunities to make some money, take profit along the way and add to your position at those subsequent predicted high and predicted low levels, but huge opportunity here to go ahead and short Alliance Data Systems.
Facebook(FB)
Also, shares of Facebook, a lot of weakness here as we get this crossover between those predicted values and you see that over the past several weeks the appropriate thing to do has been shorting up at these predicted high levels. So understanding, look, the trend is down, intraday up at these predicted highs would be a better place to go ahead and look to set a short position.
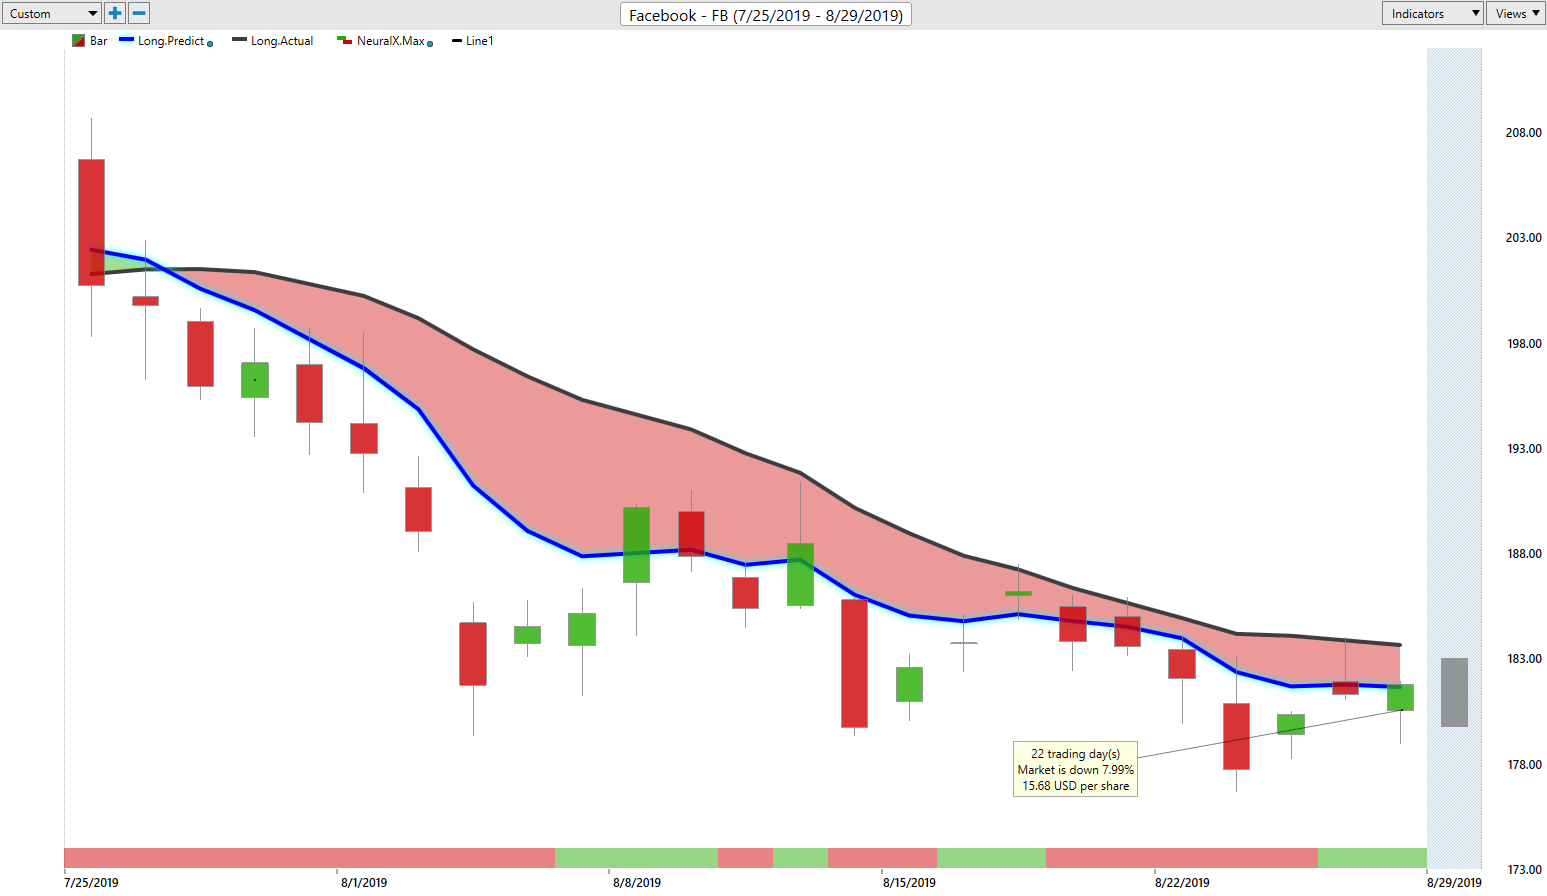
You see again, just multiple opportunities as the market grinds lower and lower just about each and every day here, but overall, pretty significant move here over the past month here. You definitely want to be aware of shares starting to… You know, not just Facebook and Alliance Data Systems and some of these things that we looked at, but overwhelmingly, a lot of these stocks turning to the downside, these forecasts getting lower and telling us that we’re moving into some downtrends. So go ahead and go in line with that. If the market corrects and things start moving higher, then we can always get long again.
United Healthcare(UNH)
Here’s UnitedHealthcare. So a very big company here, crossover to the downside. You see, you get these little flurries where neural index, you get a little bit of a pop-up or sideways action in the market, but overall, the trend is still overwhelmingly to the downside.
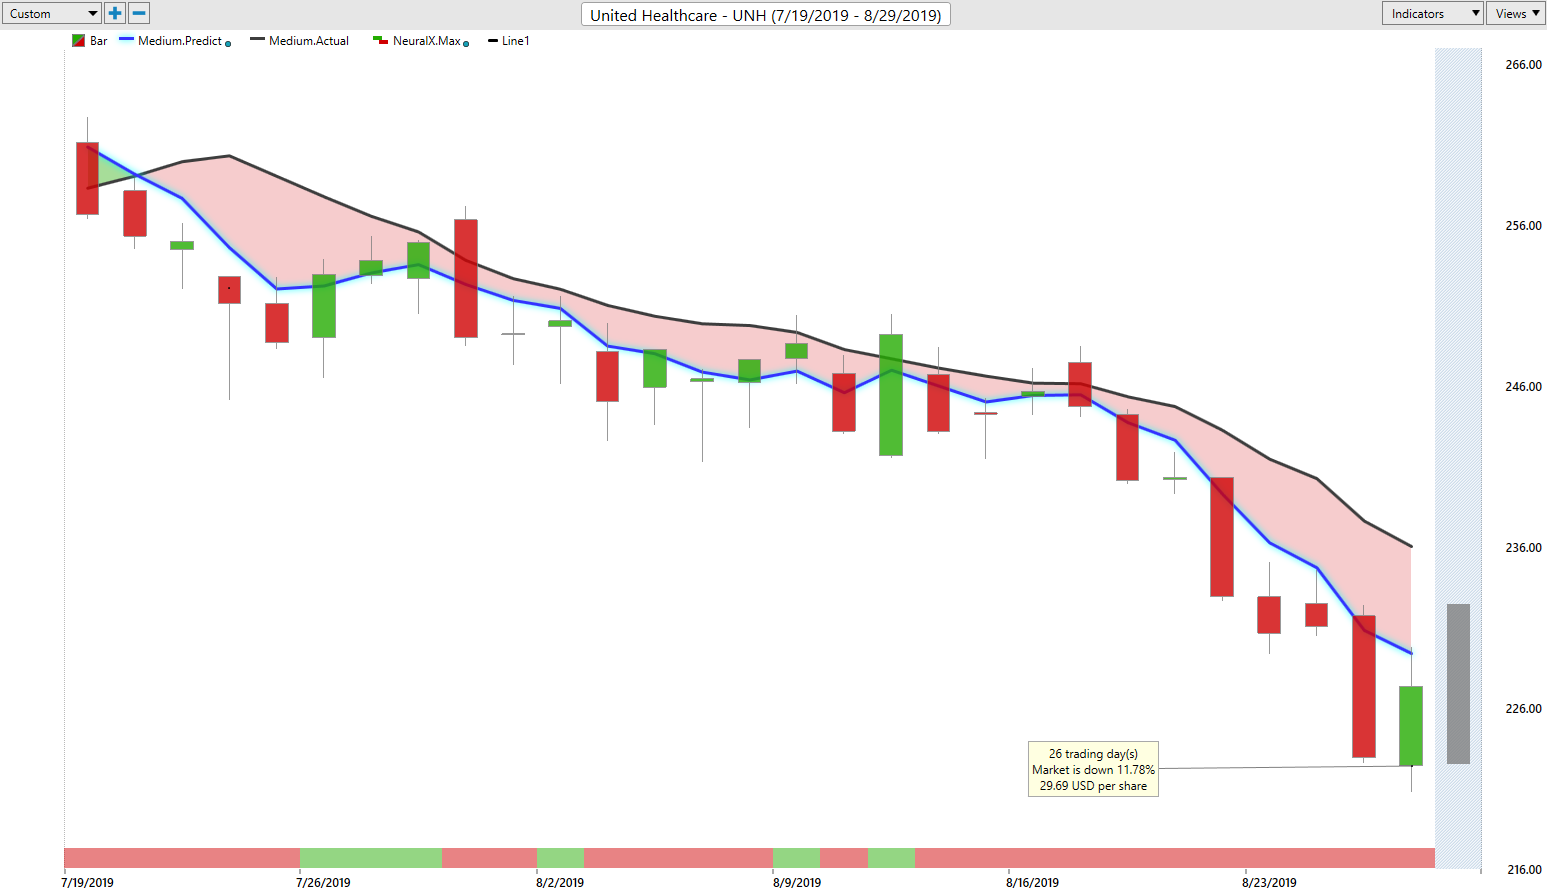
You see that huge amount of separation between that blue line and black line as well signaling that average prices are expected to start moving lower. Again, multiple opportunities to go ahead and get involved in this move before things really start to accelerate to the downside.
You just see these periods running into neural index weakness. You see that acceleration of the downtrend there and opportunities again to add to your position, right? Be more aggressive when more of these tools are in agreement and in your favor.
But here again, mark it off, almost 11% in shares of UnitedHealthcare in just the past 22 trading days, so really just about a month period of time chance to go ahead and get short, buy some put options but definitely no reason to go ahead and be long at all here in in many, many of these stocks here.
JetBlue Airways(JBLU)
Lastly, shares of JetBlue. Another very clearly crossover to the downside. These little bits of retracements where you get a little bit of a gap up but just a huge amount of separation once again that says look, find areas to short the market aside from the gold market and really more defensive plays.
You want to go ahead and be short here. But once we start seeing these crossovers move to the upside, we can go ahead and cover those positions, start to look to get long.
Right now, a lot of shares over the past few weeks made sense to go ahead and short. We got JetBlue down over 12% in just the past 12 trading days. Once again, this has been our Hot Stocks Outlook for August 30, 2019. Thank you all for watching. Best of luck and bye for now.


