


Hot Stocks Outlook for the Week of
December 18th, 2020
The Hot Stocks Outlook uses VantagePoint’s market forecasts that are up to 87.4% accurate, demonstrating how traders can improve their timing and direction. In this week’s video, VantagePoint Software reviews forecasts for 3D Systems (DDD), Micron(MU), United Therapeutics(UTHR), Walt Disney(DIS) and ElectronicArts (EA)
Register for a Free Live Training
This Week’s Hot Stocks Outlook
Hello again traders and welcome back to The Hot Stocks Outlook for December 18th, 2020. Hope you all are having an excellent week out in the financial markets and as always plenty of opportunities to cover in today’s outlook.
So we’ll start out with shares of 3d systems. We also have Micron Technology and a few opportunities that we’ve looked at over the past few weeks, so we can update those forecasts and see how accurate those short-term predictive indicators are.
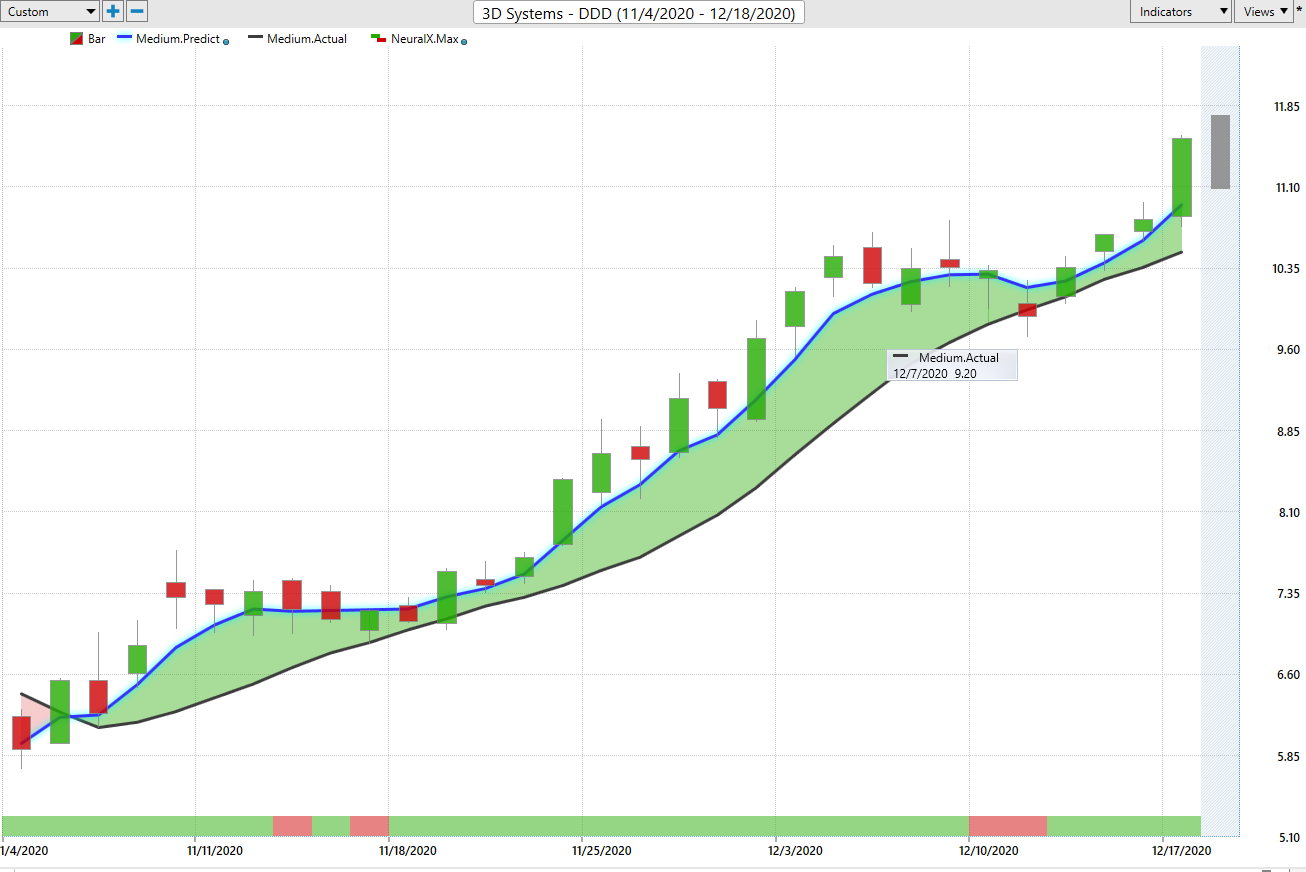
We’ve got Electronic Arts, United Therapeutics and lastly, Walt Disney. But starting out with shares of 3d systems. Now what we have here is daily price candles, so all of the indicators that you’re going to see here work off of end of day data and right up against that pray stay do you see there is a black line and also a blue line.
3D Systems (DDD)
Now, the black line on the chart, that is a simple moving average, so a very common technical indicator, but there is a weakness with simple moving averages in that they only look at one market at a time, in this case 3d systems and they only look at past price. So they act as a good measure of where market prices have been, but to be an effective trader, we have to understand where our market prices moving forward.
So what we’re able to do is actually compare that black value on the chart. That measure of where things have been to that blue line, and for that value essentially to be calculated each and every trading day, Vantage Point is performing what’s called Intermarket analysis. And so what that means is rather than just looking at shares of 3d systems and plotting where market price has been, it’s able to look at very important market relationships.
Now those can be in big markets like global futures markets, like the S&P 500 or the NASDAQ, things like global interest, global currencies, like the US dollar, foreign currencies, global interest rates, but it’s also looking at relationships between individual stocks and broader ETF groups. And what happens is it takes all of that information and understands these relationships and how these other markets drive and influence future price of the target marketing question in this case, 3d systems.
So what happens is Vantagepoint takes those Intermarket relationships, utilizing those neural networks and artificial intelligence and actually generates future price predictions. The things that have not yet occurred but as a true prediction and takes those values actually builds them into the value of this moving average turning what was a lagging indicator that gets dragged around by the most recent close price into a forward-looking predictive tool. And what this allows traders to do is get an early jump on trend changes in the market as well as have an accurate average of where our market prices trading moving forward.
So whenever that blue line crosses in this case above the black line, it’s suggesting average prices are going to start moving higher, but that’s not the entirety of the forecast here. That technology of artificial neural networks is also used to generate this bar at the bottom of the chart. Now this USI can go from green to red, and again, it gets updated at the end of every trading day, but this indicator is tuned a little differently.
And what it’s looking at is very short term strength or weakness, actually over a 48-hour period. So it’s not looking at the overall trend, it’s not looking at average prices, it’s looking at the next couple of trading days. Is there a strength or weakness in the marketplace?
And lastly, if you look at the very right-hand side, top of the chart, you’ll see that there is a shadow candle there. And what that is, is actually a predicted high and a predicted low. And again, neural networks are trained actually two different ones independently to pick out those specific intraday trading levels.
And so those can be used to set entry prices, profit targets and what you want to do is tie all these indicators into your overall trading system, whether that’s shorter term, longer-term trend trading. You have an accurate forecast of where things are headed and what to expect over the next few days in the marketplace.
So you see in shares of 3d systems, we get this crossover here at the beginning of November and that’s been pretty much the theme. You saw a lot of stocks move higher in November. We looked at a lot of the energy companies that really accelerated as the S&P 500 and stocks moved higher. But here in 3d systems, we can look at the entirety of the forecast and understand that okay, well, had you gotten long when that blue line crosses above the black line, you’ve had a really nice move here of about 70%, so an extremely strong rally, but let’s look more closely at those predicted highs and lows.
So all of these levels, you see how we have a shadow candle there. Well, what happens is the actual trading day fills in those predictions. So we can actually see how accurate each one of these forecasts was on that independent trading day. And you see multiple levels where if you’re trying to buy near that predicted low, you’re getting an excellent entry price in the overall uptrend.
So as that market moves up 70%, you’ve got multiple entries to accumulate a position and potentially if you’re shorter term, take profit along the way or understand to hold out over the longer term as well. And what you’ll notice here is there’s only a couple of points where any weakness comes in via that neural index.
So it’s very clear you want to hold onto your position over this period as the neural index is very strong, but you see that a couple of periods here where after this trading day, you got some weakness over the next couple of trading days, same thing here, a pullback in the market, but that blue line remains above the black line and the overall trend continues to the upside. So this is how you really want to combine all of these indicators to fit your trading style and your approach.
Micron(MU)
Here are shares of Micron technology. Again, that blue line crossing above the black line signaling the overall trend is up, pretty much a straightforward, very strong forecast, all the way up until really a midpoint of December. You get to pull back, but that blue line still remains above the black line and the overall trend is up. We can again take those predicted highs and lows.
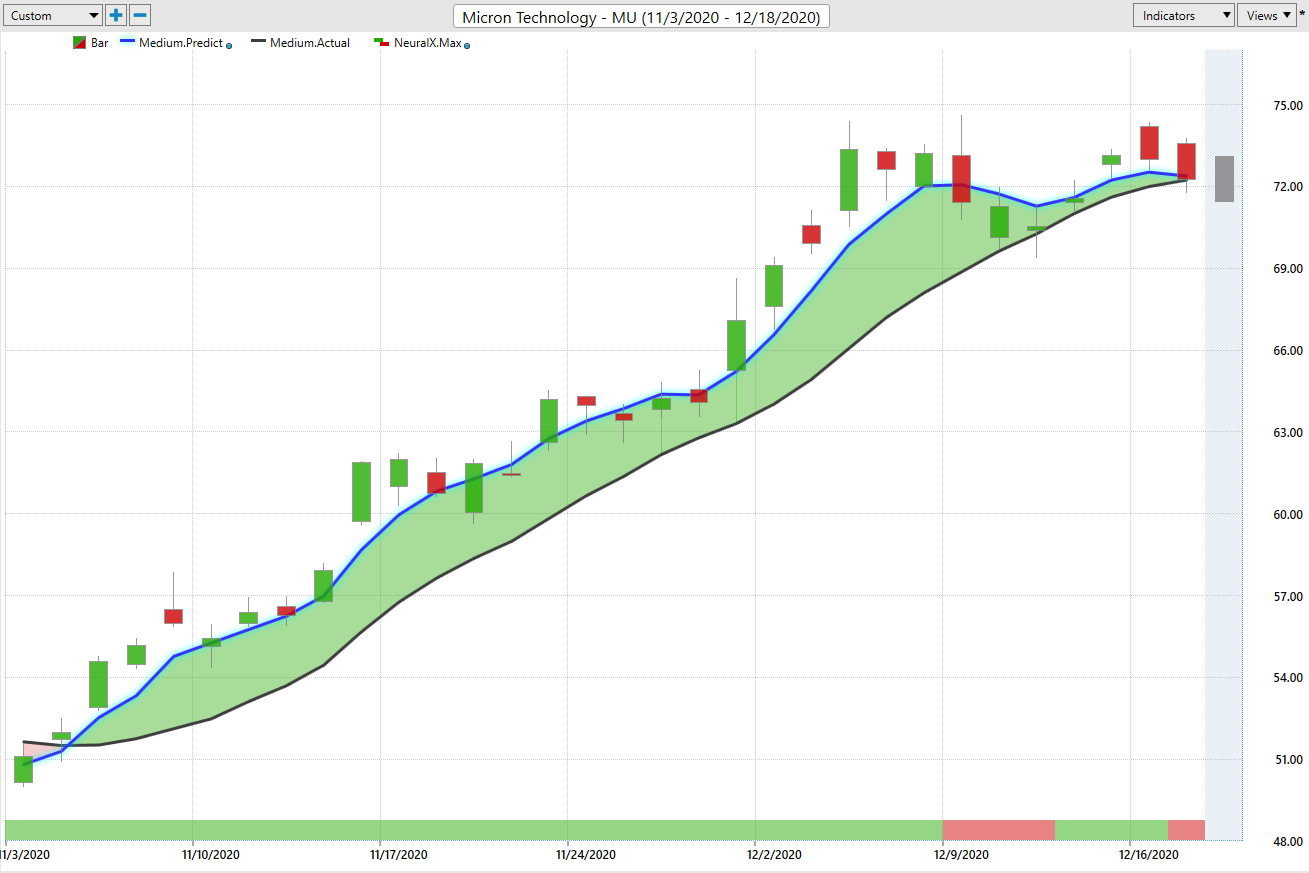
And what’s really exceptional about the software is, you see on trading days like this, if you have an order waiting down at that predicted low, you’re going to get filled on the open when that market gap down and get an excellent entry but understand you want to be a buyer in this market and you see as the days go by over the past couple of months here, there have been multiple levels to go ahead and take an entry, but you can also use that predicted low as a good measure of, what should I expect? Where should those stop-losses be to hold on to that overall trend?
So we see here in shares of micron getting a very nice rally as well, shares up overall 39%, just in the past 29 trading days.
ElectronicArts (EA)
Now, Electronic Arts. This is something that we actually looked at last week. And in the same way, you’ve got your blue line crossing above the black line, the trend very much to the upside, but it’s been five days since that forecast. And you can see that we’ve had a very strong forecast from both the short term neural index, as well as that predicted moving average remaining above the simple moving average.
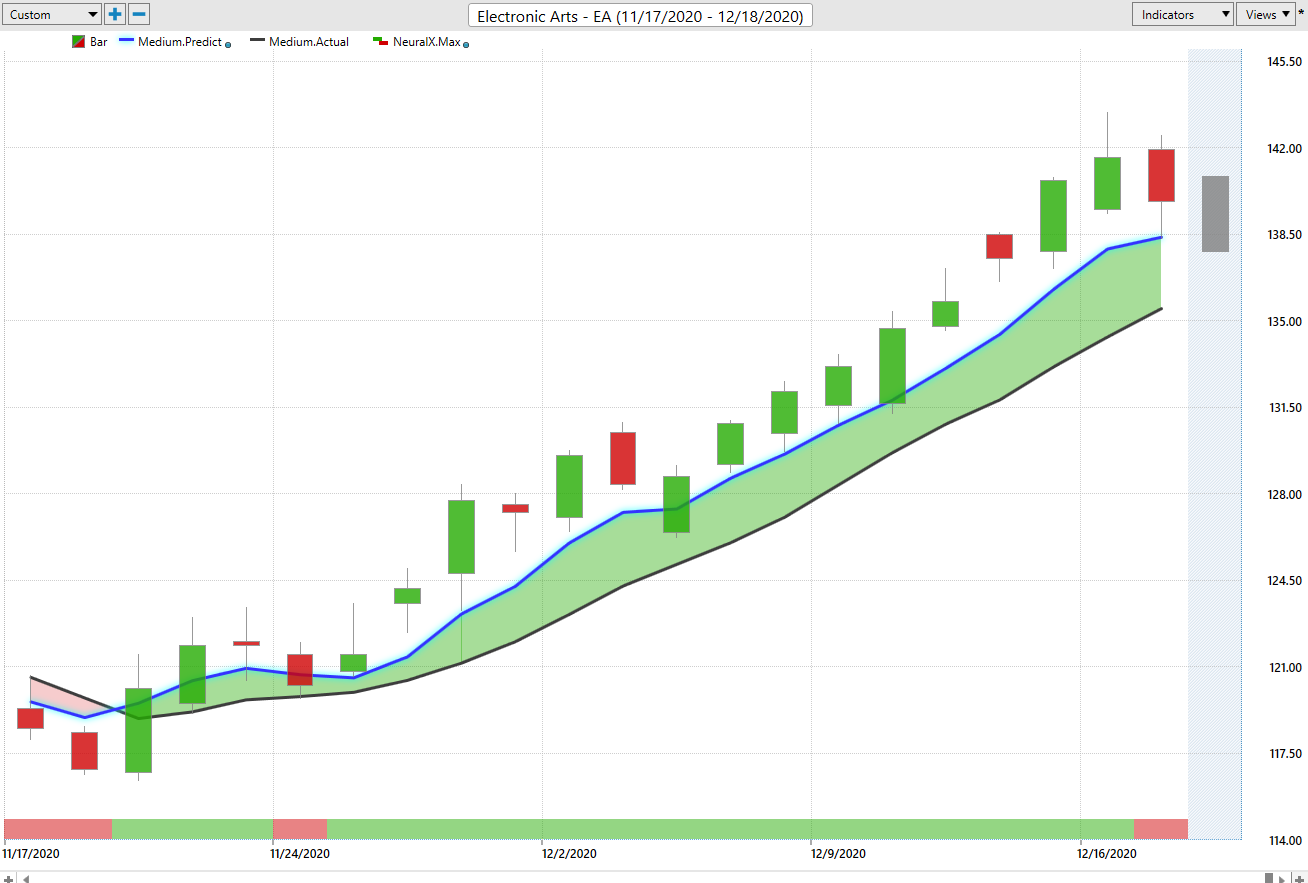
And again, we can look towards those intraday levels. So those predicted highs and predicted lows. And again, you see that if you’re using the guidance here, you’re getting an excellent entry in the market and continuing as that trend continues here. But the thing is to really understand is if you can get that early jump on a trend reversal and really add to your position along the way, it allows you to potentially lock your stops and break even and build an even larger position to make even more money with very little overall risk as far as the core capital that you may be losing on that singular trade there.
So here we have a move up about 18% in the past 18 trading days, but just in the past five trading days over the last week, market’s up an additional six and a half percent.
United Therapeutics(UTHR)
Now United Therapeutics was actually a market we looked at a couple of weeks ago because we had a downtrend here, and you see that blue line crossing below the black line.
It was very clear that stocks are moving higher in November, but this isn’t an area where you want to be long, at least not through this period. And we can bring up those predicted highs and lows and there are some very good levels to take some short positions from.
But you see that the forecast changes and that’s really the key here, is to really evolve with the changing market conditions. You get that forecast of the blue line, crossing above the black line at this point here, and very clear to stop shorting the market from this point on look for opportunities to actually go long and we can see, intraday, if that’s what we’re looking to do, where do we want to accept prices?
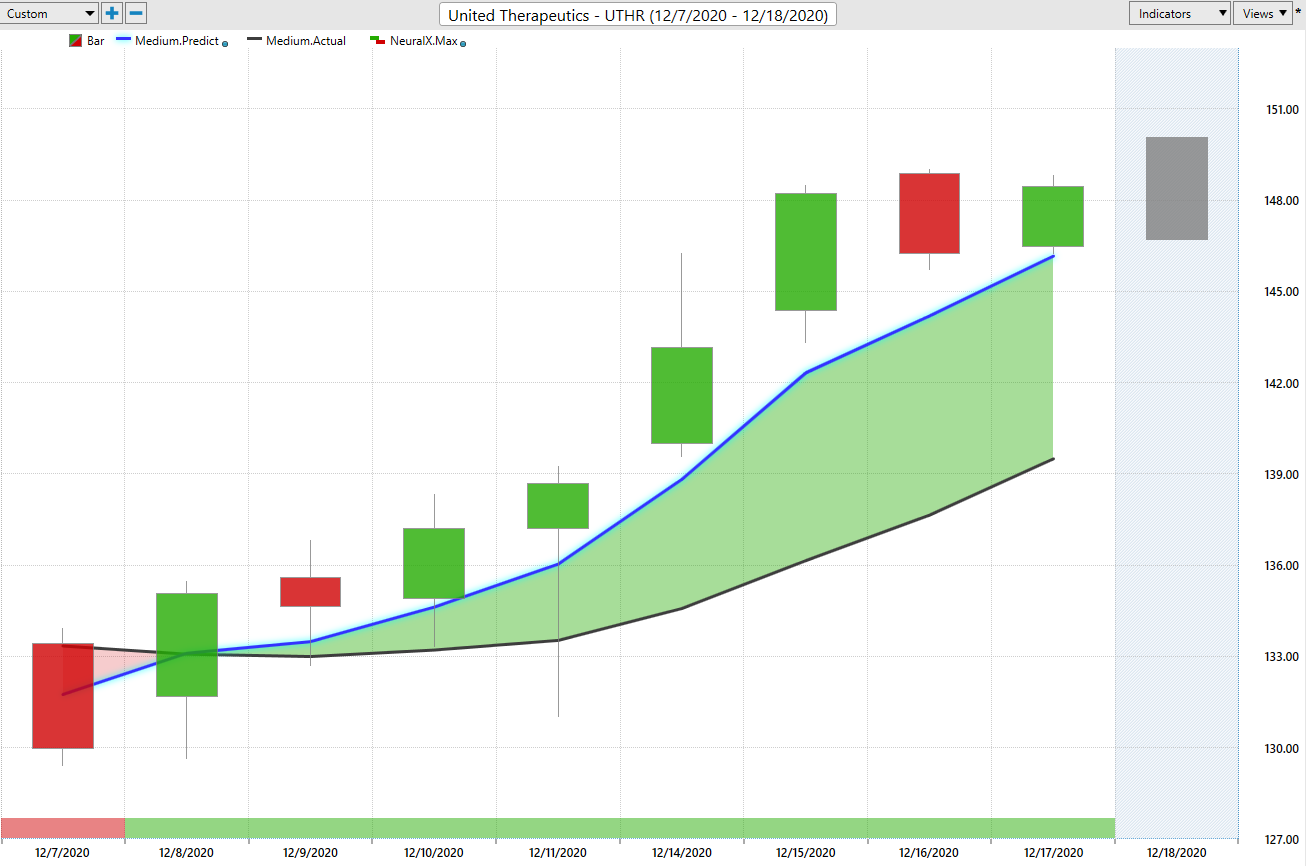
And you see that market advancing pretty aggressively over the past few trading days. But you don’t want to see through way, eight, nine, 10% draw down as the market is declining. But from this point of entry, we have the market up 11, almost 12% just in the past five trading days. So definitely clear to cover those short positions, look to go long and benefit as that strength comes through more of the marketplace.
Walt Disney(DIS)
Lastly, here are shares of Walt Disney. Looked at this really in late November, so really back here on the chart. But again, we see that utilizing these forecast to trade these markets, you see the neural index getting weak over the next couple of days to see things run a little bit sideways, but from this point on, if you understand that the trend is very much to the upside. Let’s use the short term forecast to accumulate a position and you see you benefit as that market advances and things move higher once more.
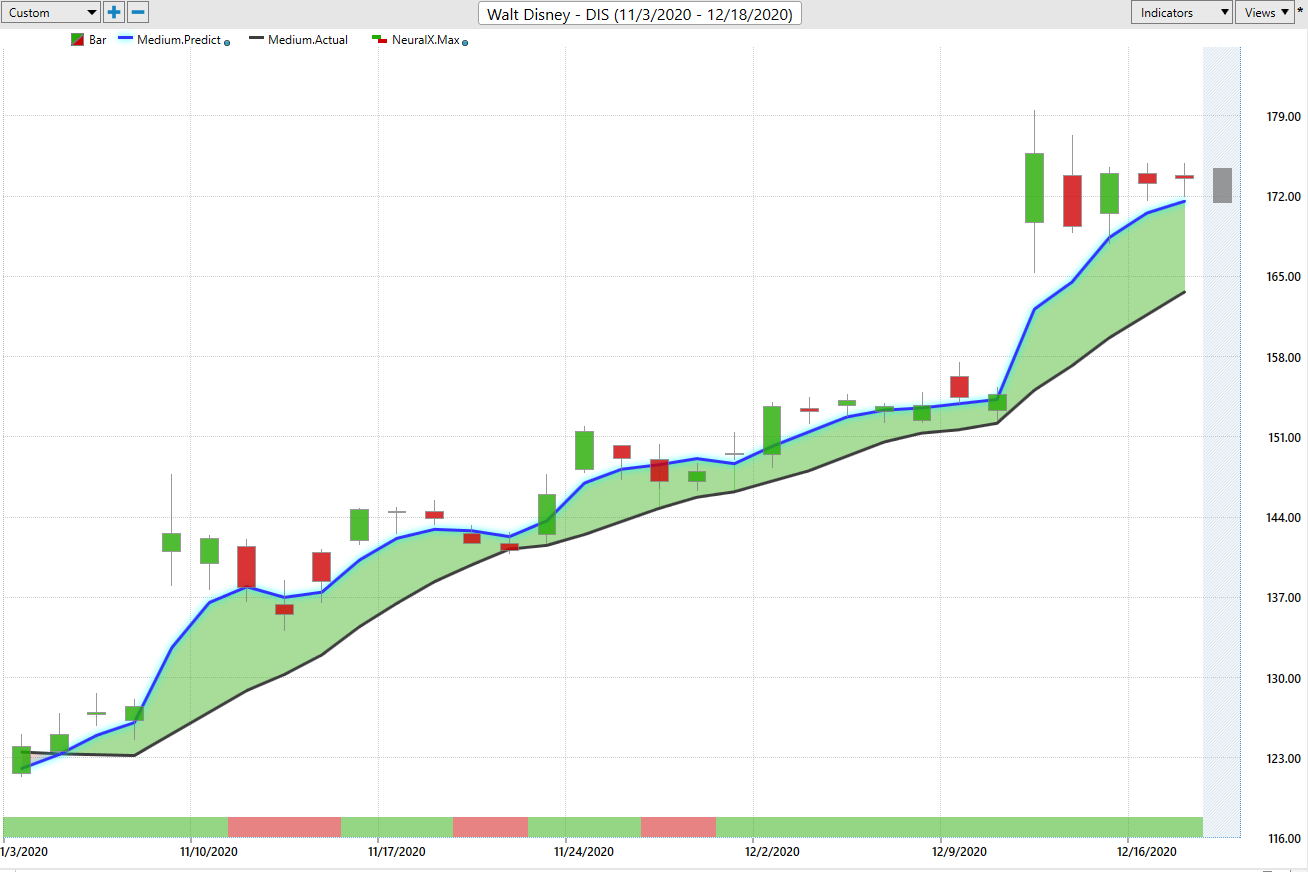
So overall, from where those forecasts originally came through, you’ve got a rally of 36% here and shares of Walt Disney, but just over the past couple of weeks, things moving up again, an additional 15 or 16%.
So you haven’t seen a lot of markets change direction, right? So since November, we’ve had the S&P and the broader markets have continued higher, and it’s very clear that that’s where you want to benefit and identify these markets that are in those strong uptrends, and then use those shorter-term predictive indicators, like the neural index, like the predicted high and low, truly fine-tune that entry price, minimize the risk and make as much money as possible on the upside here.
So once again, this has been our Hot Stocks Outlook for December 18th, 2020. Thank you all for watching, best of luck and bye for now.


