


Hot Stocks Outlook for the Week of January 3, 2020
The Hot Stocks Outlook uses VantagePoint’s market forecasts that are up to 87.4% accurate, demonstrating how traders can improve their timing and direction. In this week’s video, VantagePoint Software reviews forecasts for Intercept Pharmaceuticals (ICPT), Halliburton (HAL), Newmont Mining (NEM), AMD (AMD), and Cheesecake Factory (CAKE).
Register for a Free Live Training!
This Week’s Hot Stocks Outlook
Hello again traders and welcome back to the hot stock’s outlook for January 3rd, 2020. I hope y’all are having a great start to the new year and of course ready to have a fantastic trading year throughout 2020. So starting here, we’re going to go ahead and take a look at we’ve got Intercept Pharmaceuticals, obviously healthcare and biotech, huge theme for the last quarter of 2019. We’ve seen energy stocks pick up here so we’ll take a look at Halliburton. We’ve got Newmont Mining benefiting from the gold market, AMD, and lastly Cheesecake Factory.
Intercept Pharmaceuticals (ICPT)
But starting here with Intercept, just another one of these opportunities where we saw Humana, United Healthcare, a lot of these biotech firms just really start to move up in October and November. It was a great way to end 2019 but what we have here and it works the same regardless of what area of the market you’re trading in, individual stocks, futures, but what we have here is daily candles. So each one of these candles here represents a full and complete trading day and you see that against that price data there’s a black line and also a blue line. Now, the black line is what we refer to as the actual simple moving average. It’s a very common technical indicator, obviously very easy to generate. You just take the past prices, add them together and divide by that number and it gives you a good measure of where market prices have been over a given period of time. But of course, as traders, we need to know where are prices expected to go going forward so we can be ahead of the market.
Now what we’re able to do is compare that black value to this blue line that you see against the chart and this is VantagePoint’s proprietary predicted moving average. So it’s actually utilizing what’s called neural networks, the type of artificial intelligence, to perform what’s called Intermarket analysis. And what that means is that instead of just looking at past prices of Intercept Pharmaceuticals it’s going to be looking at things like pharmaceutical and biotech, ETS, healthcare stocks, individual equities. It’ll look at things like the futures market, the S and P 500, the dollar index. And so, this all goes down the line even the things like commodities, like crude oil, commodities that can affect the marketing question especially when you’re trading things like oil stocks or Newmont Mining and things like this
So, what the software is able to do is take all of that information and actually look forward and generate future data for the marketing question. And it’s really doing this by understanding those relationships between markets which is a very important aspect of what’s happened with globalization and how the markets have changed. So, what this is able to do is generally what we refer to as a predicted moving average letting you know well where are average prices expected to move going forward.
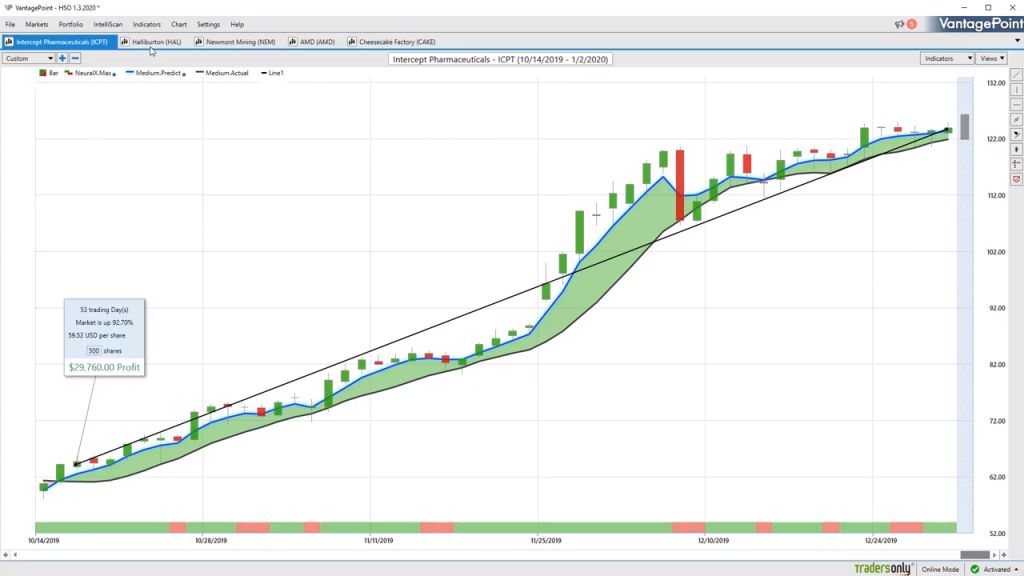
Now, in addition to that predicted moving average that really gives you the measure of the overall trend up or down moving forward, we also have other tools that are utilizing that neural network approach to price prediction here. Now what we have here at the very bottom of the screen is what’s called the neural index and this is a highly accurate 48-hour indicator. So, every day it gets a new value, well not a new value it can stay green or stay red, but it’s only looking ahead two candles at a time and letting you know short term strength or weakness in the market. So again, a very, very short term, really great tool to help you manage an existing opportunity.
And lastly, you’re actually getting if you look all the way to the right-hand side of the chart here you get a predicted shadow candle here which actually has a predicted high and a predicted low for the upcoming trading day. So, all of this information really known ahead of time. And really where the benefit comes in is understanding, “Well where do I want to belong or short the market?” They have that directional bias on the overall market and then you can go in with the help of these predicted levels and really make the most of these trading opportunities. So you see here very early on a really nice entry in this uptrend but you see how accurate these predicted ranges are day today. So you really have a measure of, “Well directionally which way do we want to be going? What do we want to look for as far as intraday price action and also short term strength or weakness in the market from that neural index?”
And where this is really helpful is helping you go ahead and look at something like the predicted moving average. When that neural index gets bearish you’re more likely to move to the negative side of that predicted average. So we expect the market to trade above and below an average but that can really help you again manage the opportunity very effectively. And we see here going into the end of 2019 this is just a tremendous opportunity and it was almost, biotech healthcare stocks almost anywhere you look here this market pretty much doubled. You’re up 92%, 500 shares would have you up $29,000 but obviously if you’re a smaller trader even a hundred shares has you up several thousand dollars there.
So as we move forward let’s go ahead and we’ve really brought in the theme of energy stocks performing quite well.
Halliburton (HAL)
So very similar to biotech and healthcare turning up towards the beginning of October energy stocks have done very well recently and we take a look here at Halliburton and it’s the exact same thing. You’ll notice that we get this blue line crossing above the black line. When this neural index you see goes down to a red telling you well expect weakness over the next couple of trading days. But the overall trend here is very much to the upside and you see once again you get that strong rally prices moving higher but then that neural index again saying well this rally tampering down a little bit. You’re expecting prices to move to the lower side of this predicted moving average but you still haven’t gotten that cross saying that you should actually go ahead and short the market, sell your long position, just telling you to improve your price, go ahead and look to get involved in the market towards these predicted lows.
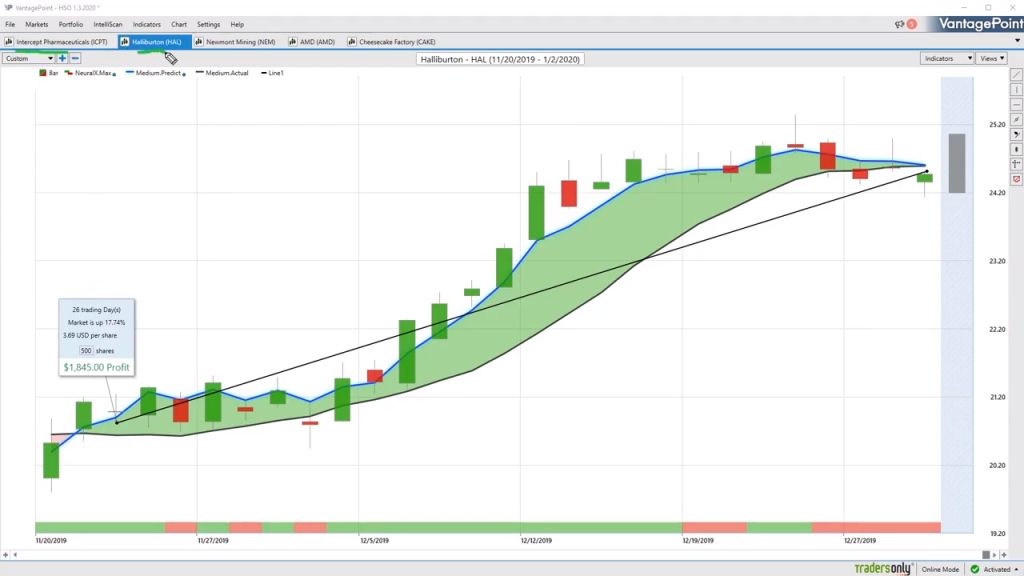
And again, you see how these markets work where you have these predicted lows you come a little bit outside of the range there but you’re really just coming to yesterday’s predicted lows in a lot of these cases. And then moving forward again finding better levels to get involved with the market understanding that short term movements that you’re likely to see there. So, a really nice opportunity again throughout this energy space and we really have the benefit of a really there’s a scanning tool here within a VantagePoint that allows you to every day identify where are the new trends and new opportunities opening up here. And it really helps direct you to broad sectors like healthcare, biotech, like energy. And you see Halliburton up here 17% just the past 26 trading days.
Newmont Mining (NEM)
Moving forward to Newmont Mining, so gold obviously performing very, very well recently and you’ve seen a lot of these mining stocks really ahead of this move here. You see Newmont Mining, you get this crossover between the blue line and the black line. And again, notice how this neural index it gets bearish and you’re really likely to see some weakness but again very short term just over the next couple of days. And that can help you improve that overall position and understand, “Well where exactly do I want to get involved?” And you see how these predicted ranges really guide you moving forward to say, “Well intraday if I’m looking for a spot to actually take a position where should I be looking to add to that existing position or just initially get involved with the trade?”
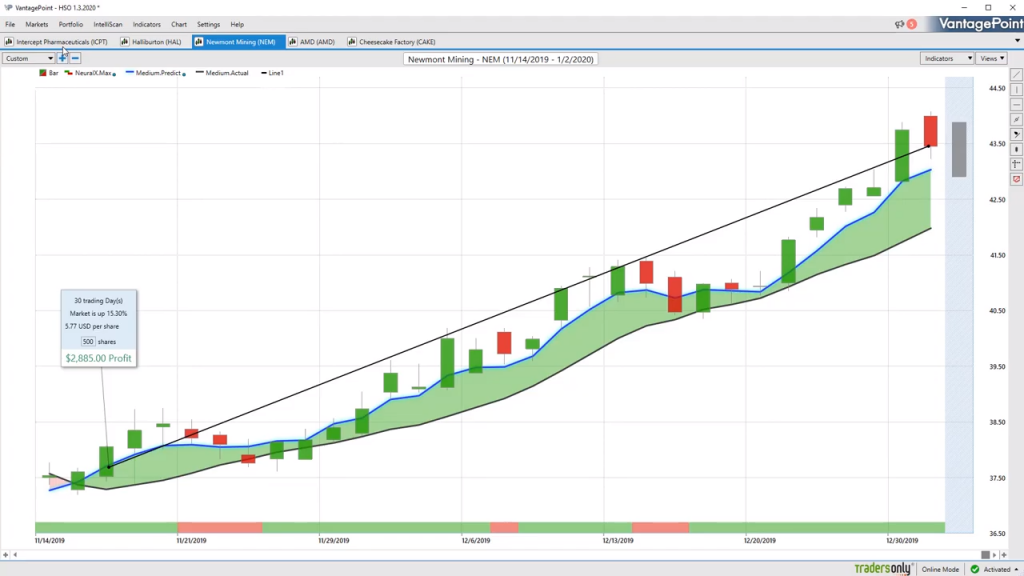
So again, once again, super nice opportunity here and the markets are performing very, very well here. So there’s plenty of these areas as far as broad sectors where you can look but there’s also just individual stocks broadly across the board doing well. But of course, it helps to again find those sectors, healthcare just being a great example recently of many of those stocks up 40, 50%. Humana is up over 40% just in the past few months here. So we see Newmont Mining just the past 30 days rallying over 15%, 500 shares have you up about just under $3,000 in profit over really just the last month here.
AMD (AMD)
Shares of AMD, so we had a little bit of a dip in the S and P 500 at the beginning of December but all that really did was open up more opportunities, opportunities like this here in AMD. Now we see we have this cross over the blue line, over the black line. You get this neural index that says well expect some weakness, you’re likely to trade to the lower part of that predicted moving average. But you see the trend in that space, that green space in between the two still very much to the upside and again one of these really great opportunities to get reinvolved with a market here. And in this case, you’re getting a really nice entry and taking advantage of this move. Here you see again another 16% rally higher in shares of AMD, again over $3,000 profit in just about 500 shares. So not having to take huge positions in these markets and you’re just seeing tremendous rallies from a percentage basis.
Now we always like to bring in some of these areas of the market where things aren’t performing well. So not only do you know, “Well where should I be getting long?” But there are good opportunities to actually hedge your portfolio, have some short positions. So if that volatility really heats up as far as the broader equities you’re making money really on both sides of the market. You can trail stops on your longs and step aside if the broader markets start to move lower and then ride some of these short opportunities. But you see here Cheesecake Factory clearly not a place where you want to go ahead and belong. We have that blue line crossing below the black line. You see these areas again where this neural index is accurate upwards of 80% of the time. So when you’re looking at that very short term forecast of over 48 hours is the market moving lower or higher it’s a very high level of accuracy to help you manage those opportunities.
And you see here, when that neural index goes bullish you tend to get the market at least running sideways, moving towards these predicted moving averages but very clearly the trend here to the downside and you, therefore, want to look for opportunities to remain short. And what that’s going to have you doing is shorting up at these predicted highs and this case if you have a limited order you’re going to get filled at the open in a lot of these cases where the market gyrates around a little bit. And you can even see how these predicted lows are fairly effective at identifying at least intraday how low you’re likely to move, where there’s a good point to take some intraday profits and then just go ahead and reset shorts at a better level. But having that guidance pretty much every day moving forward and saying, “Well where’s the best levels to get involved based on the timeframe and type of trading that you’re doing here?
Cheesecake Factory (CAKE)
So, shares of Cheesecake Factory we see down over 10% here just in the past 19 trading days. So again, clearly highlighting where are the areas where you can get long and where are really the areas that you should go ahead and avoid. Now where things like identifying the healthcare and biotech starting to perform all things like the energy stocks, where we can really benefit is this intelliscan feature. And what this allows us to do is actually drag any of these opportunities where we can drag literally hundreds and hundreds of different stocks inside of this and intelliscan and look at these things.
And what I like to do is really look at these things by sector so you can go through and really set your conditions to look for fresh opportunities so you can see, look at your medium-term crossover here. You can set that to a value of one, directionally set these conditions so that if you’re looking for a bullish opportunity you can set a lot of these predicted indicators to the upside. But then, more importantly, identify that there’s broad-based strength in many of these different sectors to look through. And that’s really a big theme of these hot stocks outlooks is when we have moves and significant moves in the market you usually don’t just see it on a one-off stock, you see the whole market start to move together or the whole sector, group of ETFs really start to move in tandem. And that’s where these tremendous opportunities like Intercept Pharmaceutical open up where you get almost a hundred percent rally in some of the biotech stuff and even some of the just general healthcare stuff like Humana, United Health, Centene. These things have moved up 30, 40, 50%.
So once again this has been our hot stocks outlook for now, January 3rd, 2020. Once again, I hope you’re having a great trading year and continue to have a great 2020. Thank you all for watching, best of luck and bye for now.


