


Hot Stocks Outlook for the Week of
January 8th, 2021
The Hot Stocks Outlook uses VantagePoint’s market forecasts that are up to 87.4% accurate, demonstrating how traders can improve their timing and direction. In this week’s video, VantagePoint Software reviews forecasts for United Therapeutics(UTHR), OfficeDepot(ODP), ONSemiconductors(ON), FedEx(FDX) , ClevelandCliffs (CLF) and Goldman Sachs (GS)
Register for a Free Live Training
This Week’s Hot Stocks Outlook
Hello again traders and welcome back to the Hot Stocks Outlook for January 8th, 2021. Hope you’re all having a great start to the new year and as always plenty of opportunities to cover here today. So we’re going to start out here with shares of United Therapeutics and work our way down the line. But this is a good example of how all of these indicators work really regardless of the markets that you’re trading. And what I really want to summarize here is that there’s really three major indicators on each chart that really summarize the entirety of the VantagePoint forecast.
United Therapeutics(UTHR)
What we have right up against this price data and all of this, again, works off of end of day candles. So all these indicators are updated at the end of each and every trading day, but what we have right up against that price date, you’ll see that there is a black line and also a blue line. Now that black line is a regular simple moving average, very common technical indicator. And for these purposes, it’s really acting as a summary of where market prices have been. It smooths out that overall price action, but traders need to understand, well, where are prices going in the future so we can be ahead of these moves. And so what we’re able to do is compare that black lagging moving average, or that measure of where market price currently is, to this blue value that for it to be generated each and every trading day, Vantage Point is utilizing the technology of artificial neural networks, a type of artificial intelligence, to do what’s called intermarket analysis.
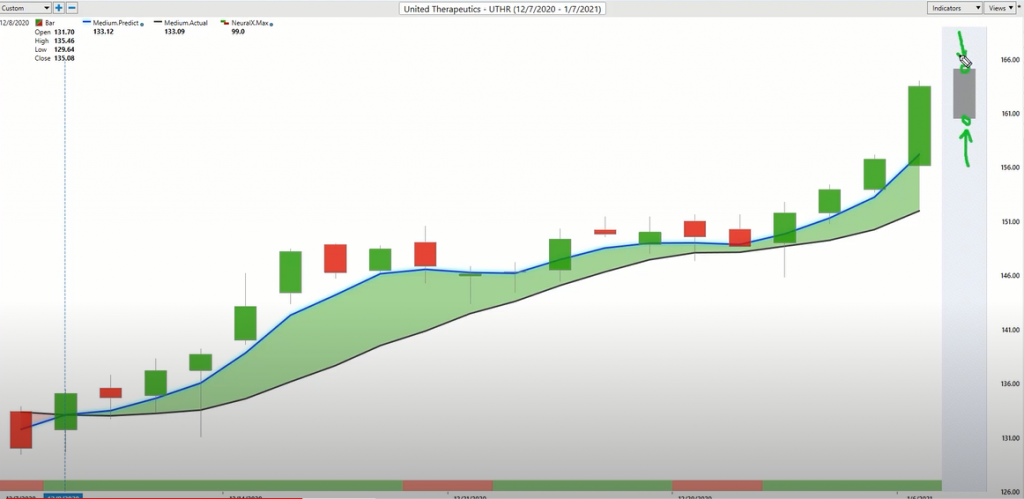
And what that means is there’s known relationships that are known to drive, in this case United Therapeutics. Now that’s going to include very basic things like the S&P 500, the NASDAQ, the major stock indices, ETF groups, as far as biotech ETF groups, but you’re going to see other things as far as individual stock relationships, maybe currencies or global interest rates, and it takes all of that information and summarizes it, and actually uses those relationships to forecast future price. So actually predictive price that hasn’t yet occurred, and those values are taken in and actually built into these indicators, turning what were lagging indicators that just track where a market price has been to a forward-looking predictive tool.
So whenever we see that blue line cross above the black line in value, it’s suggesting average prices are going to start moving higher. You’d therefore want to look to take long positions in the market. And it really depends on your trading strategy, you may be shorter term, longer term, but you have these forecast, and really the thing here is it updates each and every trading day. So it’s very adaptive and understanding what happened in the target market, what’s going on in those inter markets that may affect the future price of this market, and then generate an updated forecast so that you can make good trading decisions each and every day.
At the bottom of the chart here, this is what’s called the predicted neural index. And again, this is also generated by using that predictive data via that artificial intelligence process. But what this is tuned to do is really only look ahead short-term. It’s actually tuned to be a 48 hour indicator forecasting short-term strength or weakness in the market. Now, combining that with the overall trend, we can understand that, okay, well, the overall trend is up, but where are there 48 hour periods where you may experience some price weakness? And remember, these are daily bars and candles. We’re not looking at intraday levels or five minute candles. You definitely want to know if there’s some weakness over the next couple of days. It doesn’t mean that the trend is over and you should get out of that trade, but it says, be warned of lower prices, or essentially sideways action in the current trend.
And to we round this out, you actually are provided intraday predicted high and low levels. So we’ve actually separate neural networks that are used to forecast a predicted high and a predicted low. And again, that’s updated each and every trading day. So after the trading day concludes, you’ve got a new forecast for tomorrow. What’s expected to be the predicted highs and lows? And what we can do here is actually look back and see how accurate all of those predictions are. So we see that going back to really the first week of December, you get that crossover to the upside that says from this point on, you really want to look to be a buyer in the market, but where do you want to accept prices? Well, you would want to look towards the Vantage Point predicted lows, especially if you’re a short-term trader and want to get the best price possible.
And again, the benefit here is when price really starts to move, you have that updated forecast that says, “Okay, well, things really got moving here, but get cheaper prices over the subsequent trading days.” And after the market closes here, you see you get a neural index, a bearish signal, some sideways action for a couple more trading days. But very clearly the overall trend is still very much to the upside. So taking that same approach, we can utilize this to trade really any market that you’d like to trade here. Now, United Therapeutic since that forecast, as far as the predicted moving average crossing above the actual moving average, you have a 21 and a half percent rally just over the past 19 trading days. Again, depending on your position size, 500 shares there, maybe you trade options, but you’re looking about a 14, almost $15,000 move in the stock price.
Office Depot(ODP)
Here’s Office Depot and a very similar situation where that blue line crosses above the black line. You’ve got strength from the neural index, and we have tools actually referred to as the Intelliscan here, which actually allows traders to identify fresh crossovers in the market. So when an opportunity is just starting, you can recognize, “Hey, there’s been a trend shift. Now I can look to go ahead and stake out my position and use these updated forecast to manage the position and make the most of it.” If the blue line is still above the black line, and I want to hold onto that trend, well, you understand where you should be looking to on a short term basis accept prices, but also that the overall trend is up, and you see that sometimes things are going to run sideways for quite a long period of time, but you want that tool that says, “Look, the overall trend is up. We may run sideways and get some weakness over the short-term periods here, but stick with that trade.”
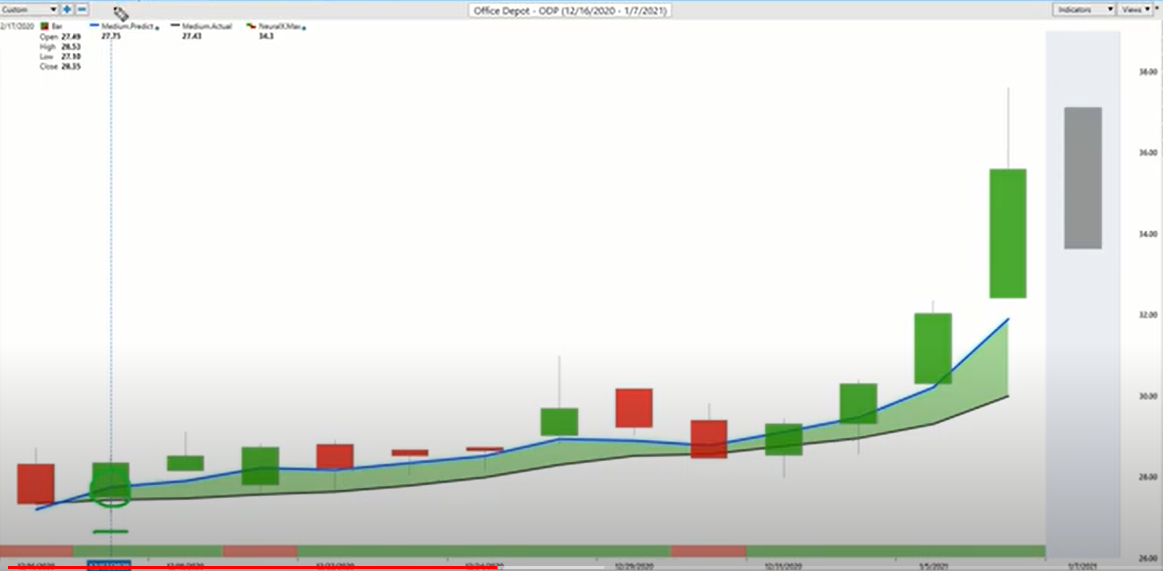
And you see here that over the course of all of these trading days, you pretty much have a neural index that holds bullish, a bullish trend, and those predicted highs and lows moving higher each and every trading day as that trend continues. And this is where it really comes down to when you may get into a market here, you have no idea what these updated forecasts are going to look like, but that’s what the software doing is it’s taking in all that data and understanding, “Look, look, don’t get too surprised if prices are trading down towards these predicted lows, even after several weeks after getting into that trend.”
Overall, we can take a look at this move so far, which is still in a very strong uptrend, but you’ve got about a 27% rally, much of that just coming through over the past few days as you see that predicted moving average and actual moving average start to separate, a lot of strength from the neural index. And that’s where you’re seeing strength in the marketplace.
ON Semiconductors(ON)
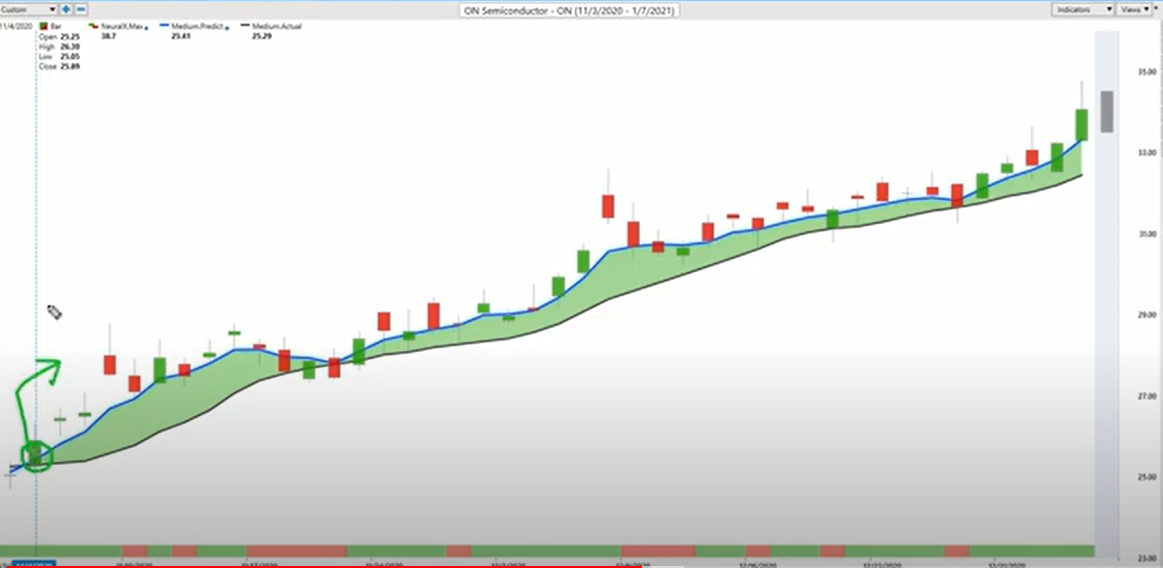
Moving on to On Semiconductors, here is a crossover to the upside. We talked a lot about the period in November. Many stocks turned up in November, this being one of them, also these, Cleveland Cliffs, Goldman Sachs, have turned up quite a while ago and that’s taken up a whole lot of stocks with it. And many of them have not pulled back. They’ve remained in an uptrend and you want to understand, “Okay, well, should I be holding on to that existing position?” Well, again, as long as that blue line remains above the black line, you’re in a uptrend, but you can of course look to add at the predicted lows, take profit as the market moves higher, here you got a 32% rally in the past 43 trading days, a pretty cheap stock, about 500 shares has you up over $4,000.
But more importantly, again is back to the trade management and using the adaptive approach of this technology to make the most of your type of trading. So if you’re a swing trader, you may want to know, “Well, where can I add into the position? What level should I be looking to build a position at?” If you’re a day trader, you want to get the best price possible on an intraday basis. Again, where should you be accepting price levels to enter the market? And you see, as this trend has continued now for what’s over a couple months as far as the calendar, you’ve got five, six, seven, eight, nine, 10, 11, 12, 13, 14, pretty excellent entries. And that’s 14 trading days, because we’re not open on the weekends. So pretty much every couple of days, you’re actually getting down to those levels. In most cases, actually getting very close to those predicted low levels. And as you’re in an uptrend, no surprise that you’re getting up towards these predicted highs. And you see even that’s where you see intraday weakness set in off of those short-term predicted high levels that are forecasted.
FedEx(FDX)
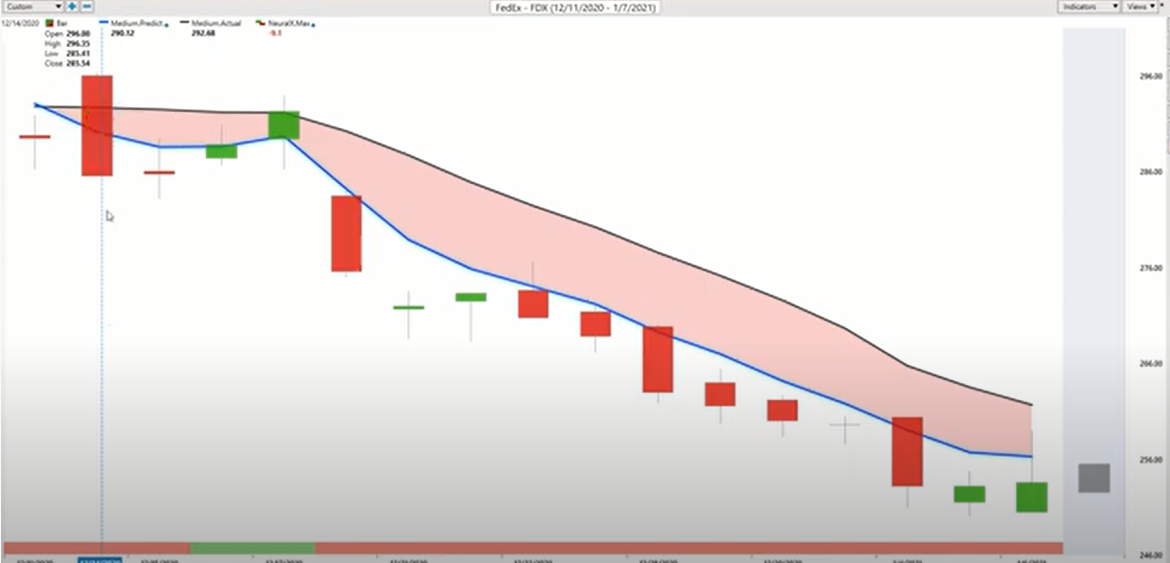
Moving forward here, we’ve got FedEx. Now I just wanted to bring this in to highlight that not all markets have moved higher, and specifically running the Intelliscan feature in Vantage Point, we saw a lot of markets around December 8th turn lower, and you want to understand where those markets are weak so can either avoid them or potentially hedge your portfolio and set up some short positions to compliment your long positions. But here we see FedEx very clearly not a market that is benefiting as the markets overall move higher as far as the S&P and the indexes. If we look at those predicted high and low forecasts, we can see that, well, clearly that blue line below the black line, you get a little strength again for the short-term strength coming in here over the next trading day. But clearly the trend is down and it’s telling you you’d only want to be short, take profits on shorts, and you see that even while the market has recovered and done well, this has remained a sore spot, and things keep moving lower here, despite the S&P hitting new highs and all of these sorts of things. Shares off about 12.6% just in the past 14 trading days. So just the past few weeks, again, seeing that pivot in many markets in that mid point in December, just like the rally that started at the beginning of November, carrying up a wide swath of markets.
Cleveland Cliffs (CLF)
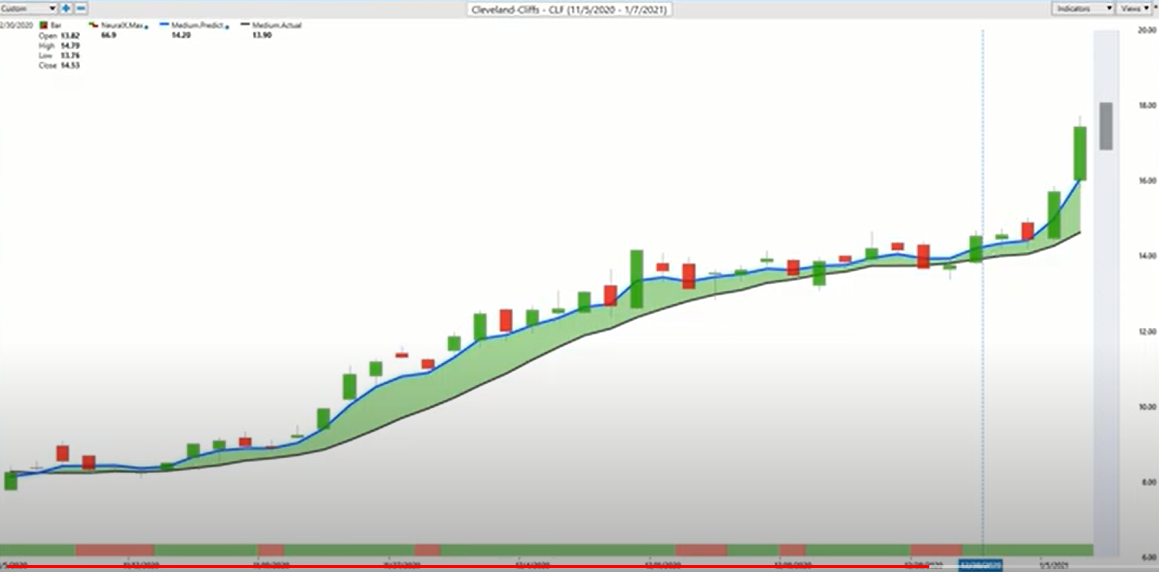
Now here’s Cleveland Cliffs. We actually looked at this last week. And again, I just want to really sic on the adaptive properties of the technology, that you may get involved with the market but look at this just over the past week. If you have the Vantage Point forecast, well, what has it been showing> Well, you’re in an uptrend, the neural index is quite bullish, and if you want to come in and accept prices, well, where do you want to go ahead and do that? You see Friday and Monday getting those predicted lows, pretty much hitting them perfectly, and this market makes another advance of 22% just over the past 22 trading days. But this is a market that should very clearly be on your radar. Overall now has moved up 111.61% in 39 trading days. So even a position of 500 shares there has you up about $4,600 on the bullish side of things.
Goldman Sachs (GS)
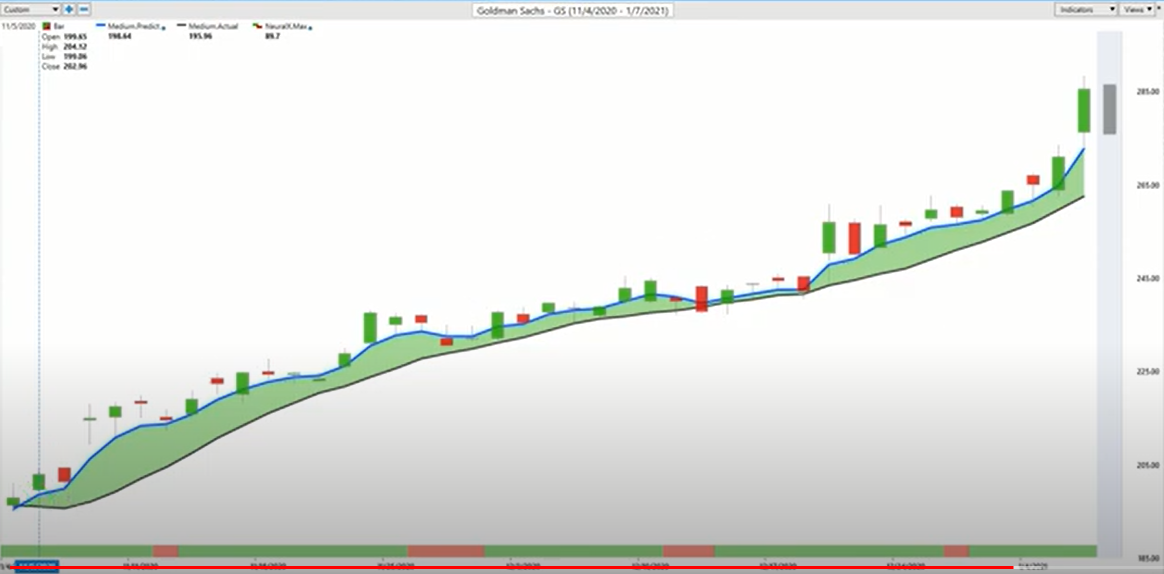
Lastly, here, another market that we’ve been covering weekly here going all the way back to December, this blue line crossing above the black line. Again, that November period where you see even stocks that would seem to not be related, you got Cleveland Cliffs, Goldman Sachs, these things turning higher all at the same time. But again, you’ve got that overall trend to the upside, very little weakness from the neural index, but you do see that you do get some short-term sideways action once that neural index gets bearish. But overall, the strength in this trend extremely bullish from all parts of the forecast, whether that be the predicted moving average, the neural index and of course, these predicted highs and lows updating again each and every day to let you know, okay, well, a new trading day has happened. Those inner markets have shifted around, may have some short-term effects on a price here as far as Goldman Sachs, but if you’re coming in and a buyer at all of these levels you again see at least a dozen entries at the lower part of the range before the overall trend continues.
And obviously more recently, just like Cleveland Cliffs, you see that correlation really taking hold. Both start moving higher in November, both start really accelerating over the past couple of days, and here Goldman Sachs over 42% in just the past 42 trading days. 500 shares has you up about $42,000, obviously a bit more expensive of a share price there. But just again, wanted to highlight these several opportunities that we just keep bringing back in because Vantage Point still keeps forecasting that they’re still in uptrends, and you’d still want to be a buyer in these markets. And we see things perpetually just advancing higher. And that’s really the thing is you want to make sure that you hold on your winners, potentially add to your winners and make the most of each and every trading opportunity that you get yourself involved in.
So once again, this has been our Hot Stocks Outlook for January 8th, 2021. Thank you all for watching. Best of luck out there. Thanks again, and bye for now.


