


The Hot Stocks Outlook uses VantagePoint’s market forecasts that are up to 87.4% accurate, demonstrating how traders can improve their timing and direction. In this week’s video, VantagePoint Software reviews forecasts for AMC ($AMC), Apple ($APPL), Paypal ($PYPL), Tyson Foods ($TSN), Baker Hughes ($BKR), Dril-Quip ($DRQ), Eastman Chemical ($EMN), Carnival Corporation ($CCL), Mednax ($MD) and United Natural Foods ($UNFI)
Register for a Free Live Training
Hello again, traders, and welcome back to the Hot Stocks Outlook for July 16th, 2021. Hope y’all are having a great week out there in the financial markets. And as always, plenty to cover in today’s outlook. So, we’ll do things a little bit differently, and doing them differently, really to build off of the past couple of months of content leading into where we currently are.
But what I want to do is highlight… We’ve got a lot of individual stocks, but these fall into really major categories. And so, we’re going to break those up into AMC, that’ll be our meme stock. We use that as a good example of how to use the software, really regardless of your trading. But what we have here is really S&P 500 stocks, energy stocks, Russell 2000 smaller stocks, and then food stocks. And the reason that I’m breaking these things up, is these are all things that we’ve talked about over the past couple of months. And VantagePoint does a really good job of highlighting, where is the strength generally, where’s the weakness. Which sectors are lining up so that you can be paying attention and really benefit from those markets when volatility really picks up here?
So AMC here, is a really good example of just how all of these indicators work, again, regardless of the market that you’re trading. So what you have here, is daily price action. And this is going all the way back, you can see to, really the mid point in May. We talked about, that’s where a lot of strength came into the market. And so what you have there, is daily price action. So each one of those candles represents a full and complete trading day.
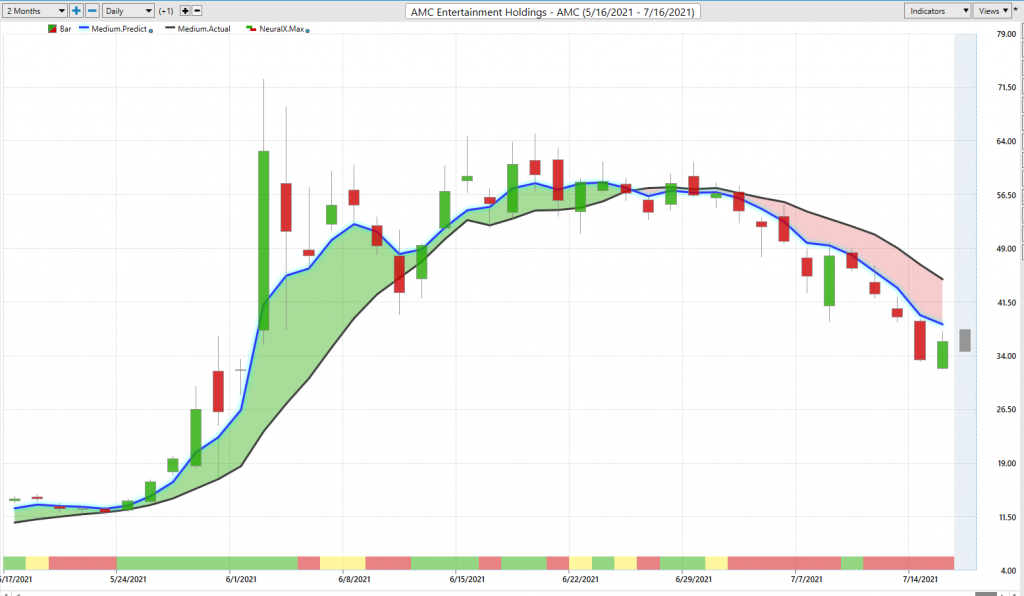
And right up against those daily bars, you see that there is a black line there and also a blue line. Now that black line that you’re seeing there, that is a simple moving average. It’s very common technical indicator, very, very simple. And all that it does, is look back over the previous close prices. It’s going to add those all together, divide, by in the case of a 10 day, simple moving average, or something like that. And what it’s going to do, is smooth out the price data. But there’s a problem with utilizing tools like this to make predictive decisions on where market prices are going.
And the problem is that, all the data that constructs that indicator, comes from the past. There’s really no predictive ability there. It’s just being manipulated by the most recent close price and dragging an indicator like that around. So what we’re able to do though, is compare that black, what we’ll call, a lagging moving average, or a simple moving average, and it’s acting as a good measure of where market prices have already been.
But what we want to compare that to is this blue line, and that is VantagePoint’s predicted moving average. And so for this value to get calculated each and every trading day, VantagePoint is utilizing its technology of artificial neural networks to perform what’s called, intermarket analysis. So, let’s be very clear about this, using artificial intelligence to do intermarket analysis.
So what that means is that, this technology is being trained on, specifically, AMC Entertainment Holdings here, and understanding which markets are known to drive and influence future price. Now, this is extremely important for any market you’re trading out there because there’s going to be very important market correlations like, what is the dollar index doing? What does the S&P 500 doing? What are major ETF and commodities and futures markets doing? But there’s also subtle relationships, relationships between individual stocks leading, lagging relationships.
And so, that’s what VantagePoint is able to understand, interpret that information, actually utilize it to generate a forecast, so a true prediction of where prices are headed in the future. And it’s utilizing that predictive data, so that true prediction of what’s going to happen in the future, to generate these indicators, rather than a backward looking, lagging moving average, like the black line you see on the chart there.
So this is very important, because whenever that blue line crosses above the black line, it’s suggesting average price are going to start moving higher, so bring in your strategy that would take advantage of that. Now, in addition to that predicted moving average, right up against the chart, you see have an up crossover there. We have a downward crossover there. But you also have this indicator at the very bottom of the chart, and this is updated each and every trading day. So after each new candle gets created, that’s going to be green or red. And this is another predictive indicator that is utilizing that same approach of inner market analysis and utilizing that artificial intelligence.
But it’s only tuned to look ahead 48 hours, so 48 hour strength or weakness. This is very important because you have to train an artificial intelligence. What is it trying to do? And that’s what’s happening here, is you have a neural network trained to identify average prices with this predicted moving average. We have a neural network to find short term strength or weakness in the market. And we also have separate neural networks trained on the next day, so intraday predicted high and predicted low levels. So you actually have a level before the trading day occurs of, where you want to put limit orders, where potential profit targets need to go.
And so, you see how this all works together, is when that blue line crosses above the black line, you essentially know you’re in buy mode. You want to go long, take profits on longs. And there will be these areas where the neural index goes bearish, and you can expect some short term strength or weakness in those windows, certainly some volatility. But that’s short term, that’s just over a 48 hour window. So again, that’s more of a buy on the dip situation, in most cases.
But you can see here that you have this guide that’s going to have you buying down at the lower part of these range. And especially when volatility picks up, the software doing a very good job of letting you know, “Hey, what should you be doing in this market?” And so, you’re buying back here at 13. We see we’re up at 53 and the forecast is shifting, and it’s letting you know that, “Look, this is now in a downtrend. You no longer want to be buying at predicted lows and targeting predicted highs. Now is time to go ahead and short the market.” And you see a very similar chart on the other meme stocks, whether that be GameStop and these other things.
But very clear that now is the time where this is over, take your profits, get out of the way. And if anything, take some of those profits and potentially short up at these predicted highs, and we’ve seen the market sell off. Now, this is very important, and this is a good example of what’s going on, where we had all this strength come in mid May. And a lot of stocks, especially the S&P 500, marched higher, march higher, great. Everything’s doing well there.
But you’re going to notice that the Russell isn’t doing that. There’s a lot of weakness, actually spread throughout the market. And it’s a really good time to be very cautious on those longs and even hedge your portfolio, not be completely long here. Because it’s looking like a lot of those stocks that had gone higher in mid May and the S&P are really getting to the end of a potentially this couple of months that we’ve had.
Now, if we look at shares of Apple here, and again, I’m pointing these stocks out to really just highlight that the S&P 500 stocks it turns out higher and May, First Solar, those sorts of stocks, that’s where all your attention is, if you want to get long equity prices, or get that bullish exposure. And you see, the past couple of months have gone by and shares of Apple, what does that forecast done for you? What has you buying at predicted lows, targeting predicted highs? And you’ve been doing that for pretty much, two months straight, so we’re coming way outside of the range here. But you see, we get a gap down here and then immediately, these predicted highs and lows back on track, overall trend continuing there.
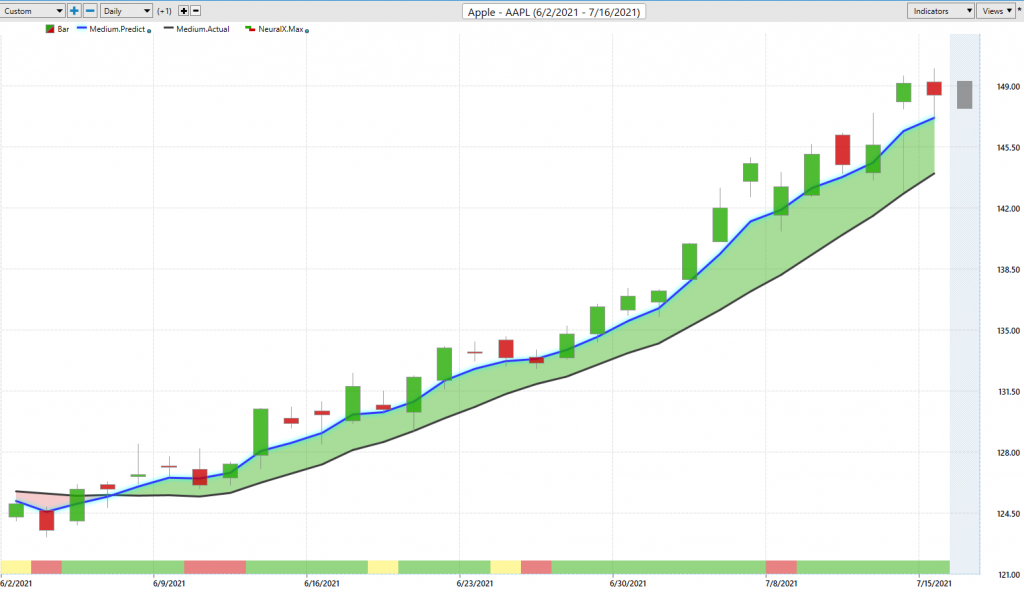
So really nice move out of Apple, but this shouldn’t be unexpected because, again, we’re seeing a lot more strength out of the bigger S&P stocks, the tech stocks, and not so much oil Russell stocks. And so, it’s very clear of where your attention needs to be. If you’re constructing a portfolio, what should that portfolio look like?
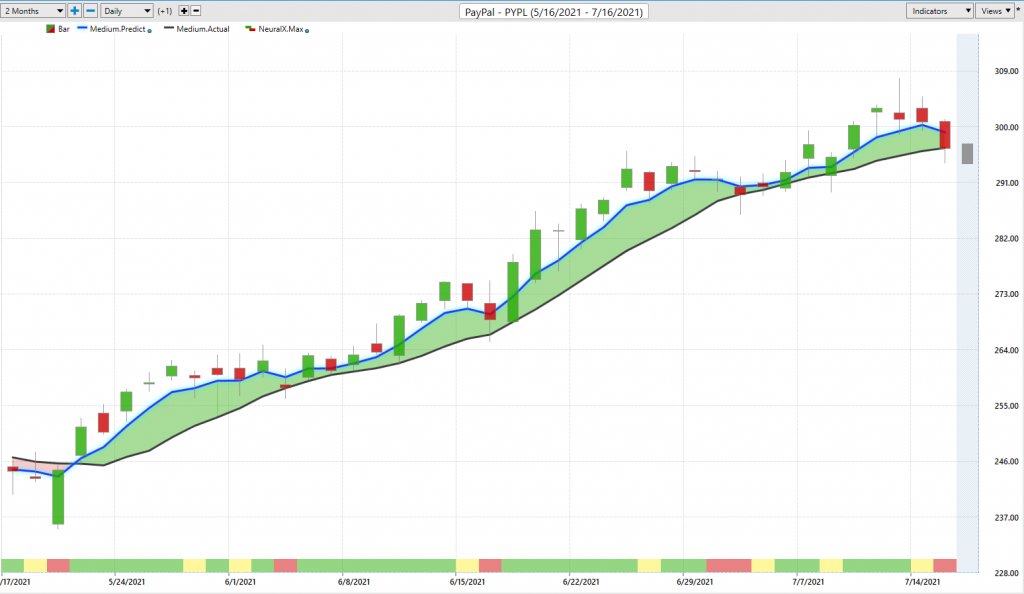
Here’s PayPal. Again, all these stocks coming out of that sell off in mid May. Strength, just straight up strength in these areas. It’s very clear, again, big stocks S&P stocks, tech stocks, fine, get long. That’s no problem. Use your VantagePoint tools to do that.
But we talked last week about energies and oil. And you’ve seen, if you’re a futures and commodities trader, you got your chain of oil contracts. This past couple of weeks has not been a great time to be getting long or getting aggressive with, or anything like that. Right? You’ve had some nasty pullbacks. We’ll see what ends up coming from this, but this is also not a surprise, because we’ve recognized that something’s wrong in these energy stocks, Eastman Chemical also correlated to all of this.
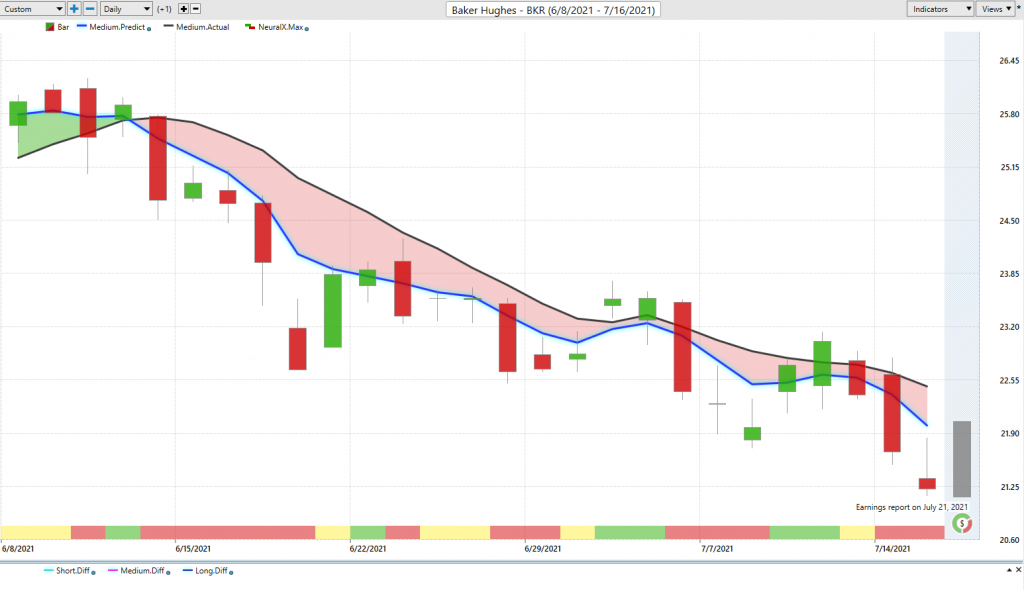
But here’s Baker Hughes, and I just want to continue on. We already looked at this chart last week, so we don’t really need to do it again. But this past week, we already have just like Tyson Foods, a few… almost a month ago, just like these May stocks, that started moving higher, we already have an area where we understand, energies, weakness. We know we aren’t getting long here. And you see that the forecast is then going to help you and say, “Okay. Well, neural index gets bullish here. You may get some strength.” And those forecasts are going to help you, but very clearly, you’ve got an area already that you know you only want a short take profits on shorts. And then you can let this roadmap guide you of actually expressing that trade. Right? And that can take a lot of different forms, depending on which markets you’re trading.
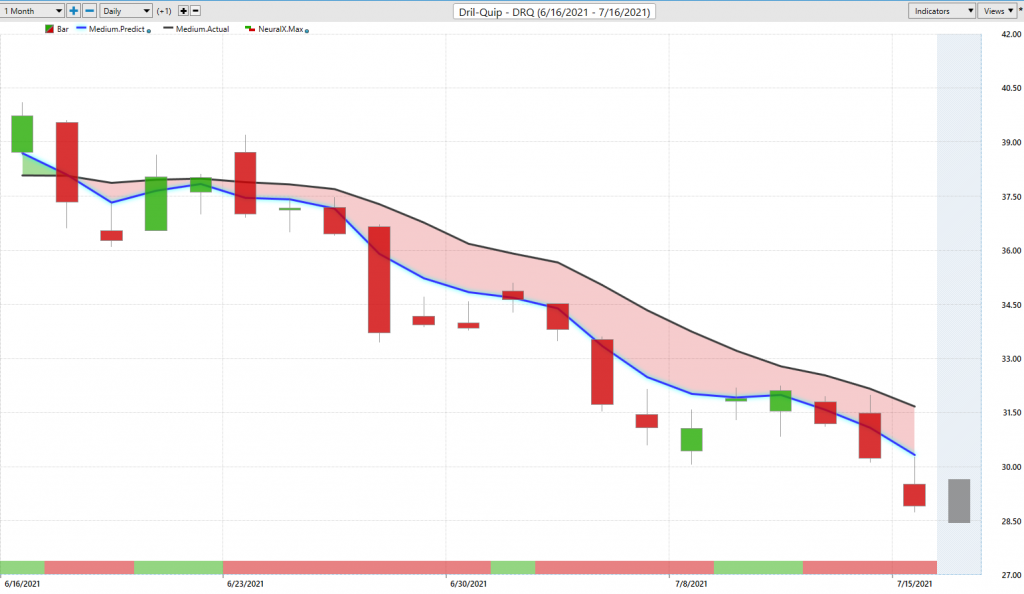
But very clearly here, here’s Baker Hughes. We also looked at Dril-Quip, and you see how similar of a move. Right? We had a little bit of strength early in the week, and the bigger trend is playing out, not even close, as far as blue line crossing the line. You’ve seen, crude oil, the commodity, run a little bit more sideways, but clearly not a place to be getting long in the market. And we’ve understood that because, we’re not going to be buying crude oil contracts when energy stocks really look quite weak. And of course, we start even seeing those crossovers to the downside on things like the futures contracts,
Eastman Chemical, another driven by energies here, these chemical companies highly correlated.
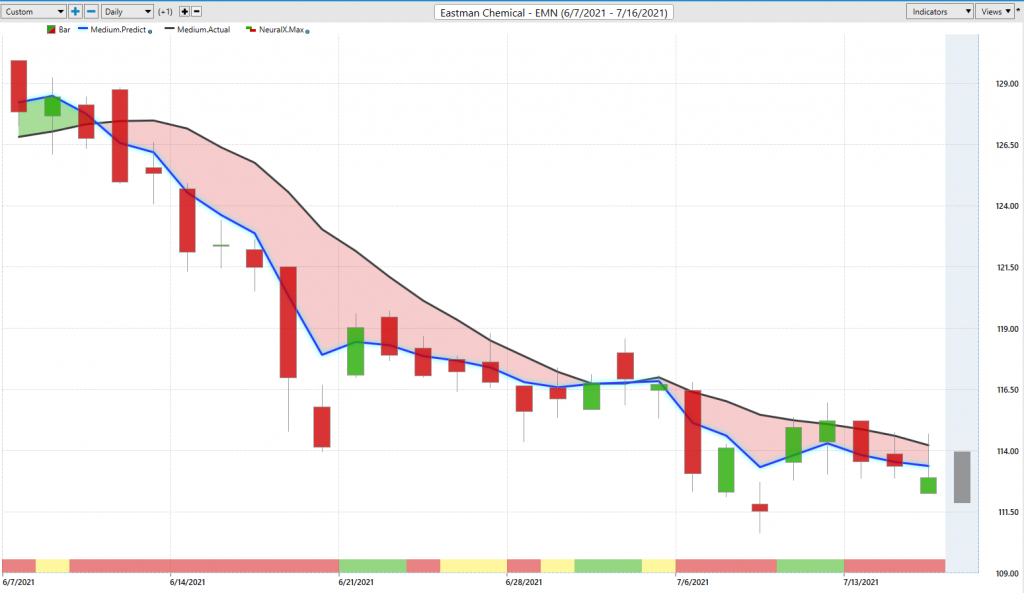
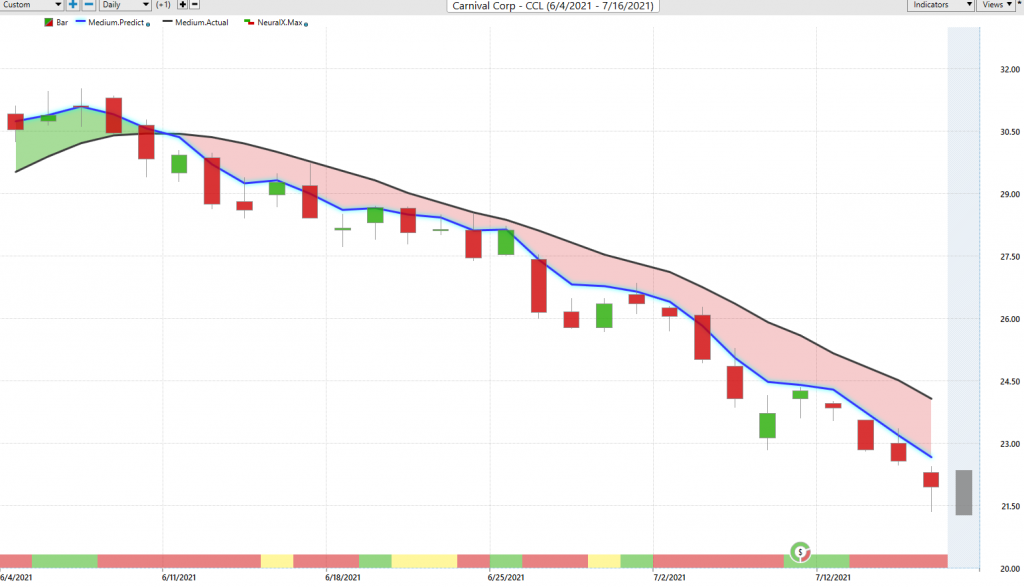
But again, a lot of weakness here telling you, “Look, this is still weak. There’s no reason to get long in any of these areas.” And let’s just move on to the other big correlations, is Russell. So these stocks that pivoted in May look great. S&P 500 moving higher, a completely different story on the mid cap, smaller stocks. And so, we talked about the dollar surged food companies doing poorly, well, that can still be on the radar because we know, “Hey, there’s some weakness.” But more so here, you see the cruise lines companies,
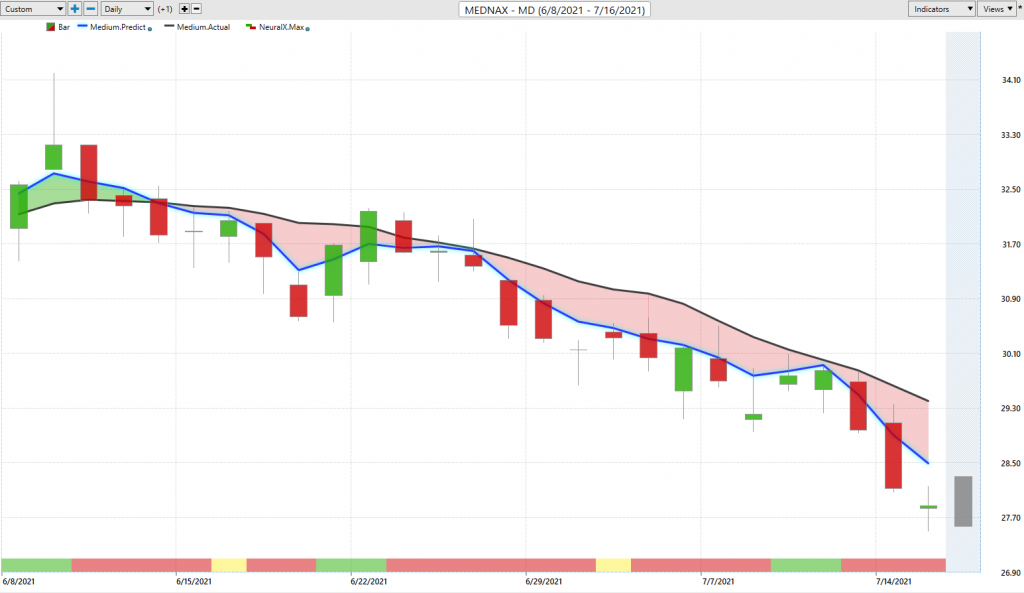
MEDNX medical company here, but very clearly is, where are the areas where we don’t want to be getting long? And there’s a very clear case to build here that, all you would be doing here, is shorting the market, taking profits on shorts.
And I just mentioned that it kind of goes both ways here where, there’s the potential to just be long and benefiting from the Microsofts and PayPals and all these things, going straight up as the S&P goes higher. But certainly that opportunity for that hedge portfolio as well, especially, more recently, we’ve started to see these particular stocks turn lower. We may see one of these big moves lower in the S&P. It’s getting to that point where, the Russell’s already weak, they have been weak, and now you’ve had two months of strength in the broader market. And you’re just seeing some signs that, just may want to pull back.
But again, you have those areas where, you know you’re getting long, where you’re getting short. And your portfolio, regardless of where volatility takes the broader markets, going to be doing quite well here.
So you’ve got a 25% decline there, insurers at Carnival, very similar situation here in MEDNAX. A lot of weakness. We can, of course, just look at our predicted highs and lows again, to guide you. It says, “Short… Take profits on shorts.” And even this week, you’re seeing a lot of weakness, again, in these places that have already been weak, but then speaking to that broader market weakness.
And I’m just telling you, it’s hard to explain a lot of these things where you’re not using VantagePoint every night, and seeing a lot of these relationships play out and these things shift and change.
But Tyson Food companies, these have been on the radar of, if you’re going to short something, you can go ahead and short those. We know the socks are doing well from May. That’s fine. But here, Tyson Foods, you again, see going into this week. Right? This is not something… This is like months ago, we’re bringing this through, and this is benefiting on the dollar surge.
There was a fed announcement, dollar surges. It starts to crush Tyson Foods. That’s what we mean by these intermarket relationships, right? So dollar is going to have different effects on Tyson Foods than it may have on Apple shares or PayPal, and some of these other stocks. And we see this has just continued to be driven down, as dollars stayed fairly resilient. And again, you see just this past week of, what are you doing, if anything, in this market, where you’re shorting up at these predicted highs. And this is a perfect day of how effective the software is.
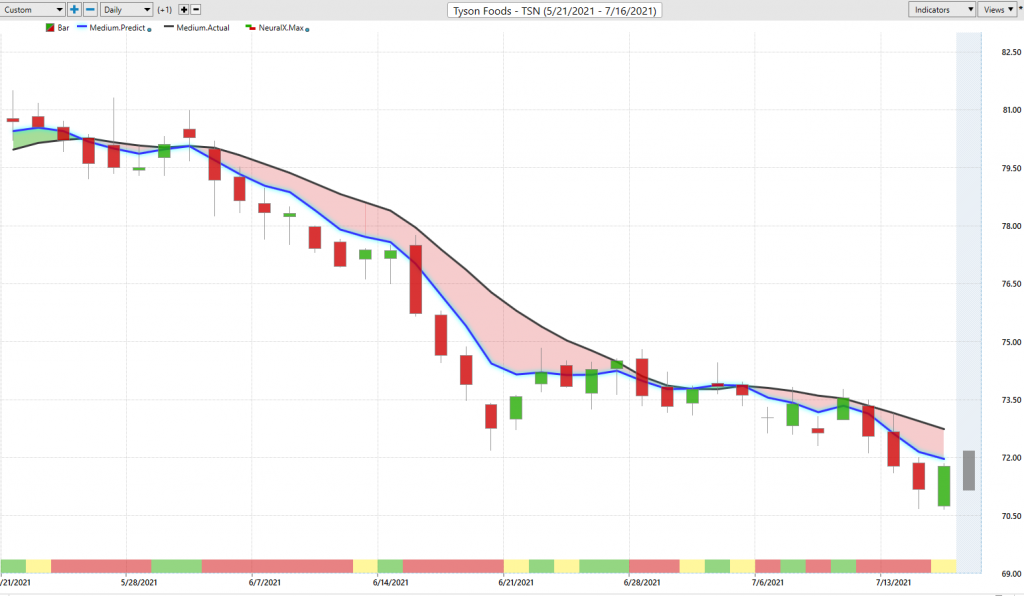
And you can’t come in and be a day trader and assume that you can short up at the highs and you’re going to get that move lower. Sometimes you have to short the market, hold overnight, and that’s where the move comes in. And this is where the software is very, very good at letting you know, “Look, you need to be shorting up here for the bigger move.” Not assuming that, okay, you can short up there and this thing’s immediately going to move for you, just not how it works. But overall, you know, the forecast saying, “Look, the overall trend is down, very much down.” And then you can use those continued forecast to help you manage things.
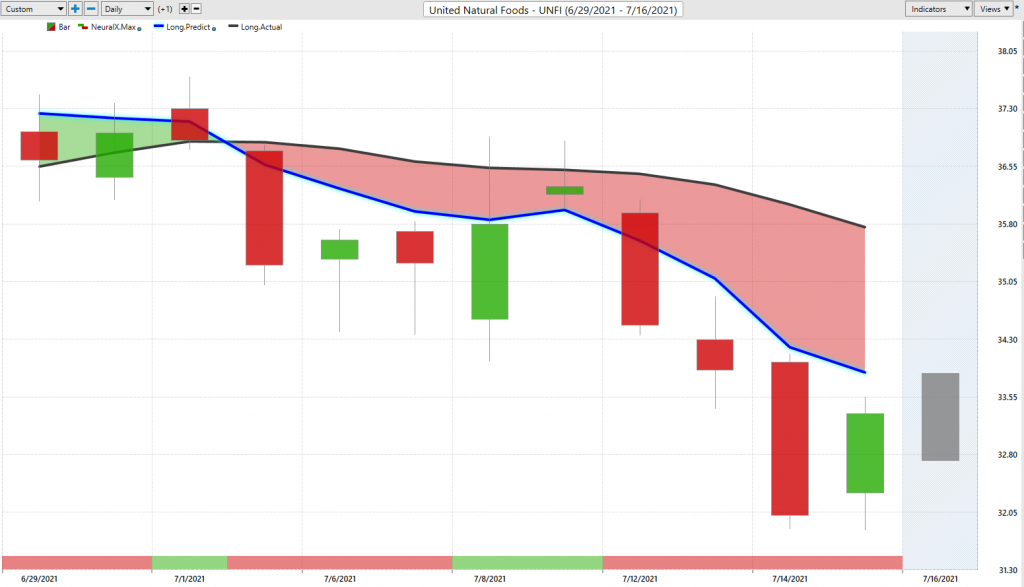
So here’s United Foods, more recently, very strong crossover to the downside. And what’s happening? These food stocks still doing poorly here. And then another short-term trade that highlights, where do you want to be shorting? Well, up here, you have a couple of days of strength, but that’s the strength where you want to come in and say, “Use that short term strength from the neural index, predicted highs to get short and make money.” As you see a 10% decline, just in the past about five trading days there, from that rally higher, and now continuing the downtrend.
So again, a little different. I wanted to hop around into these markets that we’ve looked at over the past couple of months. And more so, just to highlight that, you really start to see the relationships play out in different areas of the market. And that’s what’s going to make it easier to construct a portfolio and know, “Hey, it makes sense to be long over here, short over here.” Overall, I’ve got a very insulated portfolio that’s likely to skew in the appropriate directions. And of course, can be managed with the help of your predicted highs and lows. You can take profit along the way, but when these things really start to accelerate and break out and dollar is driving things one direction or the other, well, you want something that’s really going to benefit from a lot of that.
So once again, this has been our Hot Stocks Outlook for July 16th, 2021. Thank you all for watching. Best of luck out there and bye, for now.


