




Register for a Free Live Training
The Hot Stocks Outlook uses VantagePoint’s market forecasts that are up to 87.4% accurate, demonstrating how traders can improve their timing and direction. In this week’s video, VantagePoint Software reviews forecasts for Jack Henry and Associates ($JKHY), Regeneron Pharmaceuticals ($REGN), Astera Labs ($ALAB), Oracle ($ORCL), American Express ($AXP), Thomson Reuters ($TRI)
VantagePoint AI Hot Stocks Outlook for July 17, 2026
Hello again traders and welcome back to the hot stocks outlook for July 17th, 2026. I hope you all have had a excellent week out there in the financial markets and as always we are here to take a look at the most recent Vantage Point AI predictive forecast.
So, if you haven’t already, be sure to go ahead and click the link down in the description below and get yourself signed up for a live demonstration and you can learn all the specifics about how these predictive indicators and artificial intelligence technologies are helping traders make much better trading decisions out in the marketplace. Uh, and so, a very interesting past few weeks we’ve seen in the broader market.
Uh, and we’re actually going to review many of the opportunities that we’ve taken a look at in previous hot stocks outlooks. This is very important because of how the software adapts and helps traders navigate the financial markets with their trading.
Thomson Reuters ($TRI)
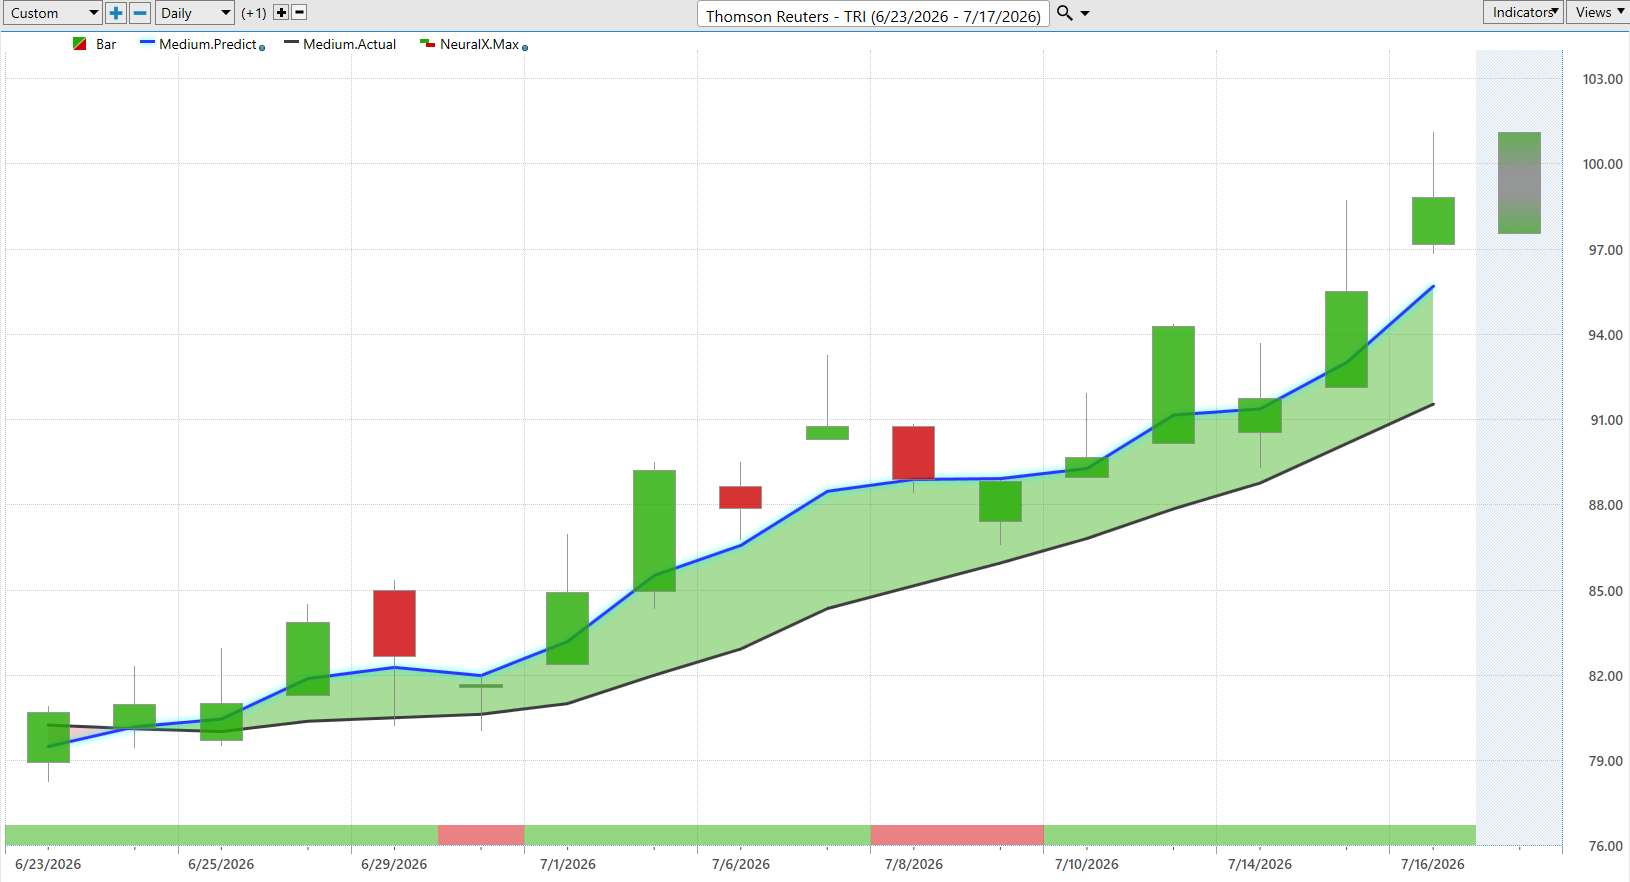
And so, uh, we can start here with shares of Thompson Reuters. And what we’re seeing, of course, is daily price action. So, that means each one of these candles on the screen would represent a full and complete trading day. And so, the first indicator we need to understand is right up against all that price data.
You see that black line and also that blue line value. Uh and now what the black line is is a simple moving average or what we refer to as the actual uh simple moving average. And this is very simple in that it’s just looking at the previous 10 closed prices adding them all together and then dividing by that number.
Uh so this is really how traditional technical analysis works and that all the data to generate those values comes from the past and has no predictive capability but acts as a baseline for vantage point traders really letting us know where have market prices been. Now vantage point traders are provided this predicted moving average and so for this value essentially this price for it to get plotted and and calculated and placed on the chart every single evening. Well, this is where that technology of artificial neural networks come into play. And they’re performing what we would call intermarket analysis.
And so what that means is that rather than just looking back at past prices and reconfiguring that price data that has already occurred, vantage points, artificial neural networks are pulling data from dozens of other markets that are known to drive and influence future prices. Now, where that data comes from is really a takes a global approach.
just looking at a very wide number of markets that are going to include things like individual stocks, uh, ETF groups, which obviously, uh, wrap up entire sectors and large groupings of stocks within the stock market. But it even can look at things like the bond market and global interest rates. Uh, potentially global currencies like the dollar index or the currency you might be trading in, uh, as well as things like global commodities were applicable.
Right? So, if it’s a gold mining stock or oil or energy company, it’s going to take a look at those relevant commodity markets as well. And it uses all of this data from these markets to generate price predictions uh and extremely accurate indicators. And so, whenever we see this blue line cross above the black line, well, it’s suggesting that these average prices will start moving higher and traders can utilize that information to take a long position, whether that be a short-term day trade or a swing or position trade.
Uh and we see since that forecast came through 16 days ago, since that blue line crossed above the black line, Thompson Reuters here is up 22.2%.
Uh now we last looked at this market somewhere around here. And so this is where I want to go ahead and update things with the help of these shorter term predictive indicators from Vantage Point. So if we look at the very bottom of the chart here, you see this bar that goes from green to red, back to green.
Well, this is getting updated every single trading day for the trader and it’s predicting short-term strength or weakness over the next 48 hours or what you can think of as really a couple candles uh from that point that you’re uh identifying uh this the configuration of the indicator. Uh and so that acts as a very short-term tool with an extremely high level of accuracy upwards of 86 87% uh accurate and this is through Fed announcements, earnings reports, international geopolitical volatility.
Uh and so this is what helps traders navigate the short term, really be prepared for uh dips in the marketplace. And then of course we also have the vantage point predicted high and low.
And so this is what we look at each week, seeing the uh uh how accurate all of those predictions have been in the past. So what’s going to occur here on this Friday uh is we’re going to have the actual market fill in these levels, this high and low will stay static uh based on where they are currently. And we can see how accurate all of these predictions have been.
And so when we look back at Thompson Reuters, we see even after this rally, well, the software does a great job of forecasting where prices are likely to trade here. And so traders can easily navigate and adjust the position uh to account for, you know, some of this volatility here.
Now, I do talk about this a lot where you get days where all the volatility is bullish or all the the momentum in the market is bullish and sometimes you start filling in that previous area. So you have these levels again before any of these trading days occur uh and the trader can be aware that let’s go ahead and take a position really understand where this market is likely to trade.
Uh but just over the past couple of weeks here where we’ve seen a whole lot of volatility around a lot of the AI hardware manufacturers well we’ve actually seen a rally of about 10 12% here. uh and even a lot of the software stocks have performed actually quite well while the broader market Q’s goes lower and a lot of these uh uh very popular stocks like Micron and SanDisk and in Nvidia uh here’s Regeneron.
Regeneron ($REGN)
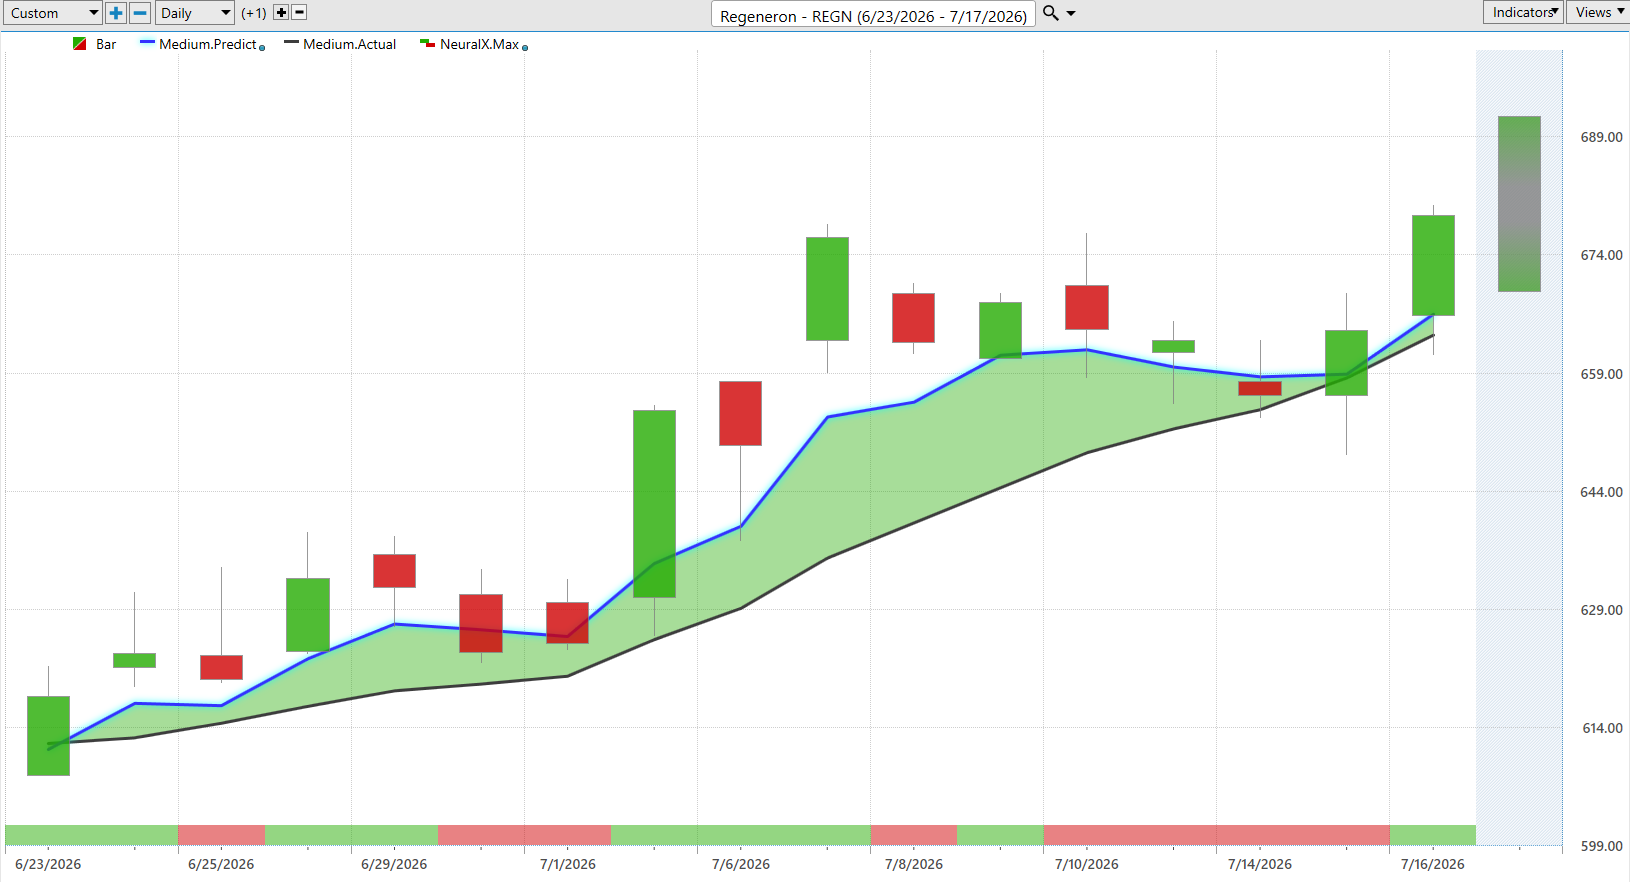
So this is more in the pharmaceutical space uh uh Regeneron here you see this blue line crossing above the black line. Now you will get these periods where the neural index goes bearish and you see again you get this sideways price action over a couple days gets bearish here again sideways price action bearish here you get this longer term dip in the market but notice that the overall trend that blue line is still above the black line.
So what you have to understand about the neural index is it’s always only looking ahead 48 hours at a time, right? So it’s a very short-term prediction. Uh and that prediction has that very high level of accuracy uh associated with it.
So here we see the market climbing a bit higher here about 9.5%. Again we looked at this a couple of weeks ago. Uh but of course you also have those predicted highs and lows and this is a actually expensively priced stock. So it sometimes gets a little bit illquid.
You get gaps on the chart. you see here going into the morning uh trading. But even with that, you see how these levels are very good at really pinpointing where this market is likely to trade uh and then skewing to in this case the bullish side uh as we see the overall trend continuing to go higher and of course we see that predicted range uh still slanted higher here for the next trading day.
Jack Henry and Associates ($JKHY)
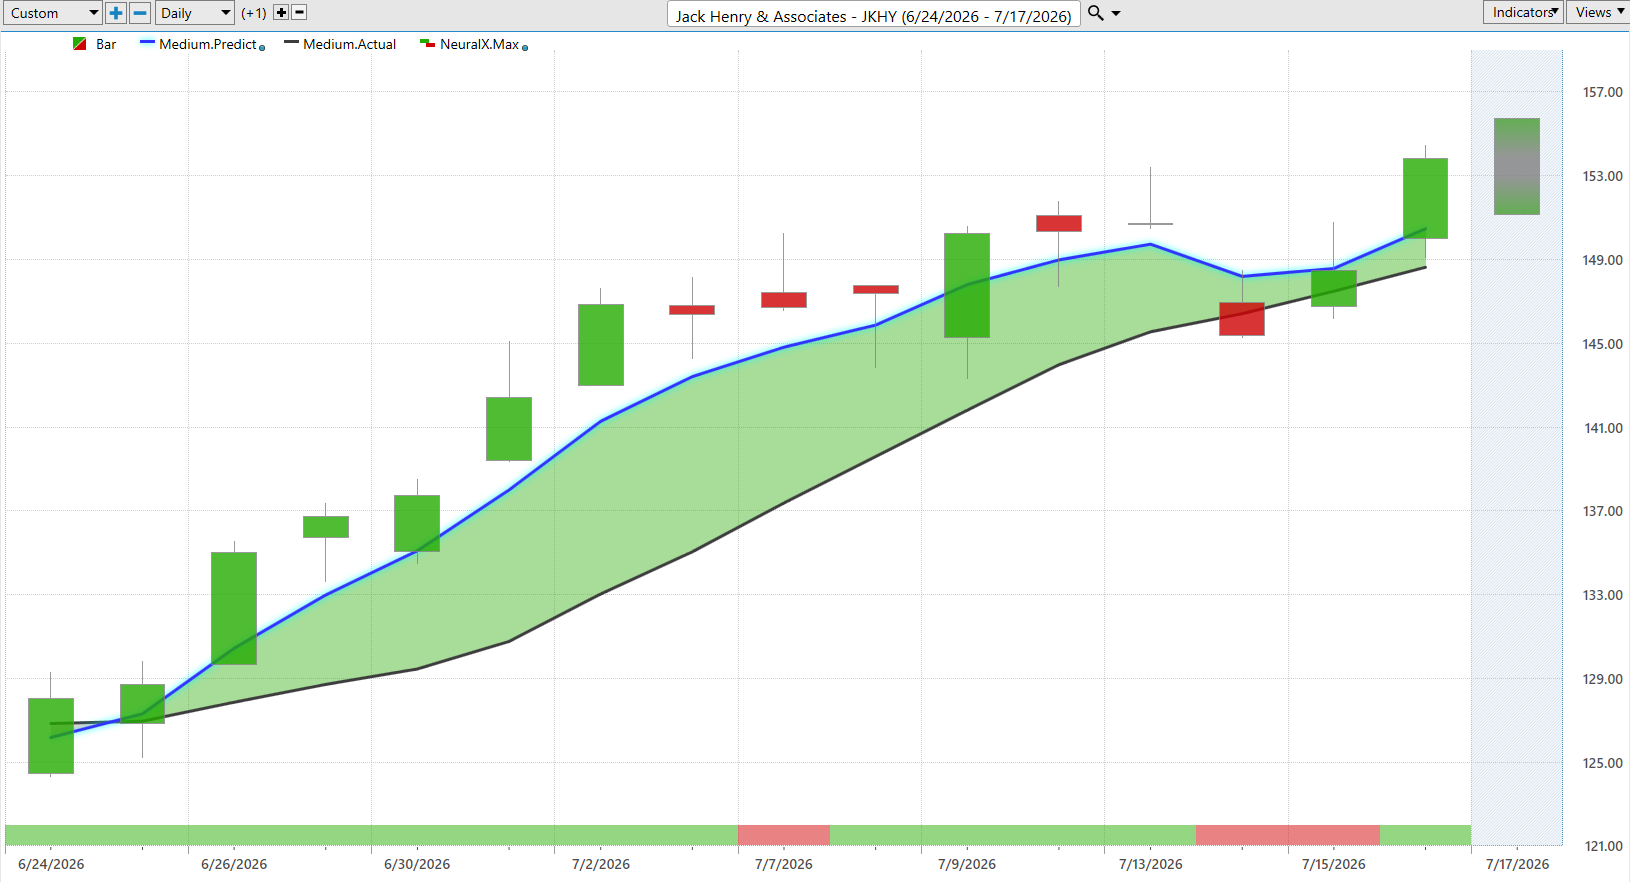
Uh now here in the software space here’s Jack Henry and Associates and we’ve seen a lot of strength out of software companies as well as the financial areas. This sort of covers both of these areas. Uh here you see again the blue line crossing above the black line. Look at all this strength as all this momentum comes into the market at the start of the rally.
Uh you get the neural index going bearish here. And what do you get again? These wicks moving lower right over those next 48 hours. You want to expect that short-term weakness in price.
Uh again you see uh we’re getting a gap down here. Neural index goes bearish but clearly the trend is still bullish here. Uh and so we’ll see how this continues.
Uh but of course the benefits of Vantage Point is that ability to adapt. So if things start to go lower, if the broader market sell off and it drags some of these stocks that have been performing well over the past few weeks, we are going to get those clues and those signals uh that the market’s moving into a downtrend. But here we see a 19th really 20% move in just 15 trading days.
So very aggressive rally there. Uh and again, I think we’ve looked at all three of these within the past few weeks. So, if you want to take a look at those previous hot stocks outlooks videos, you’ll see these uh uh earlier on and see how these things have progressed.
Astera Labs ($ALAB)
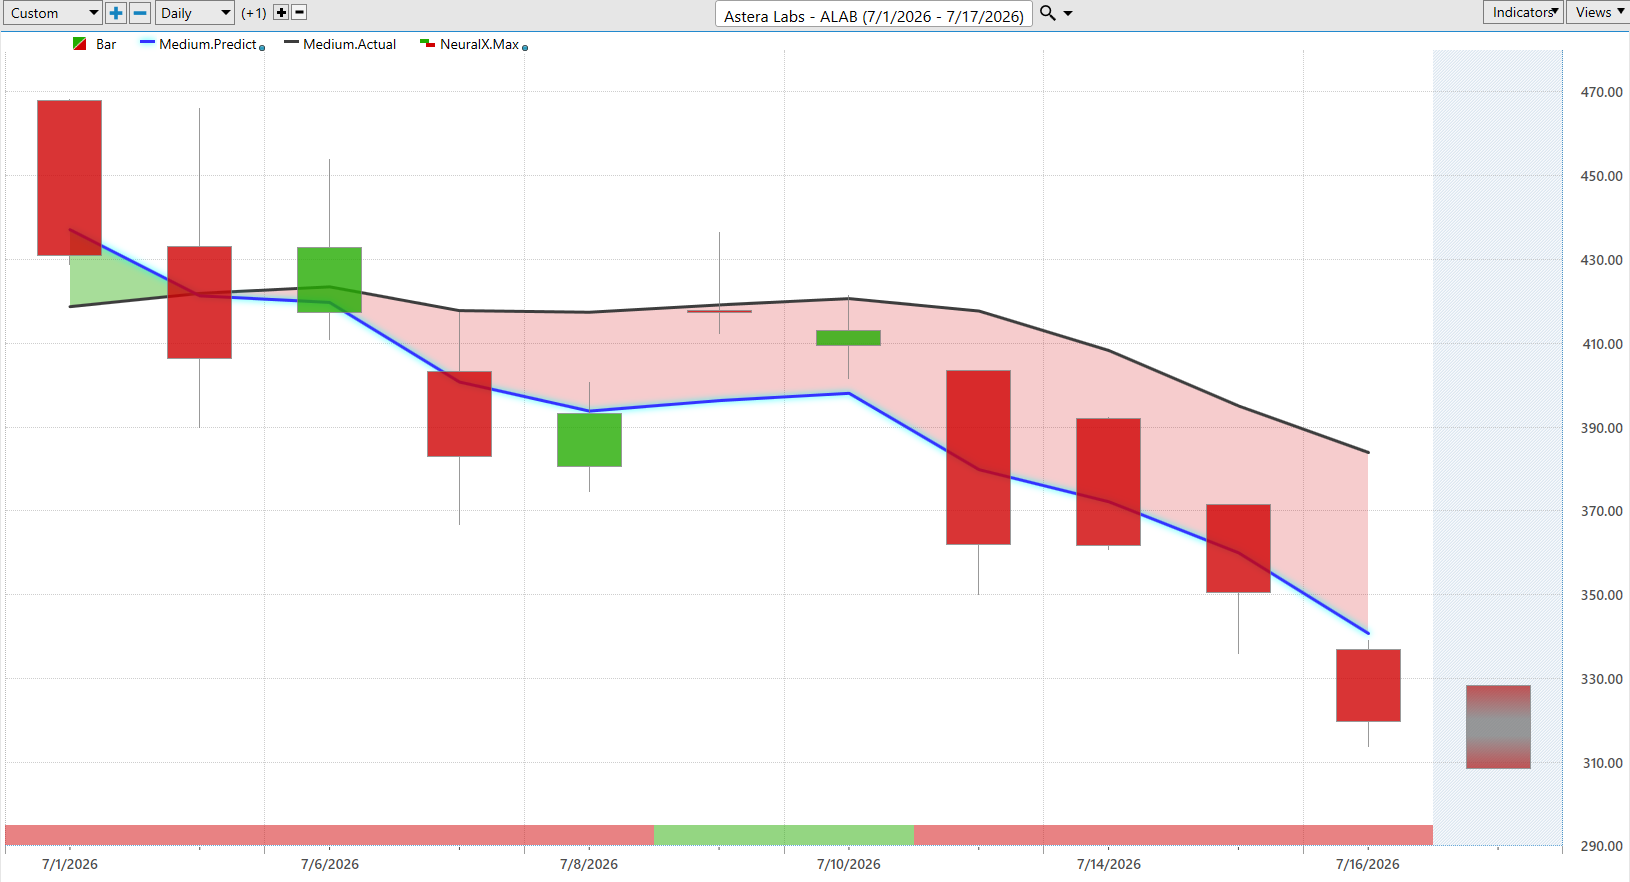
Uh now, here’s where again things get interesting. Now, here’s Asterolabs and this was one of the strongest markets uh starting in April, right? This stock went from about 100 up to uh you know $450, $500 per share.
Uh but very clearly here, we’ve seen a shift across the hardware space and we really saw this at the beginning of July. Here you see that blue line crossing below the black line. A lot of separation here between that predicted moving average and the actual.
Now the neural index goes bullish here. You get a little bit of an upday. Uh market just trading sideways. But the bigger trend here very clearly to the bearish side.
You’d only want to short take profits on short positions. Uh and again we can look at those predicted highs and lows here. And you see how these levels work.
You get a big gap up this day, but very clearly that if you get a short position on that day, we are not spending much time at those higher prices. You see again a gap up with some illquidity in the morning, but the overall trend here is bearish.
You’d only want to short take profits on short positions. Uh and again, we see that this market is pretty aggressively moving lower here. So, this is where you want to be very careful on a lot of those names that performed extremely well at the start of April.
had a one of the best 3 months rally, you know, ever in the stock market. Uh well, now we’re seeing some weakness here. Shares off about 25% in just the past nine trading days. So very very short period of time and a very aggressive uh uh movement lower in price.
Oracle ($ORCL)
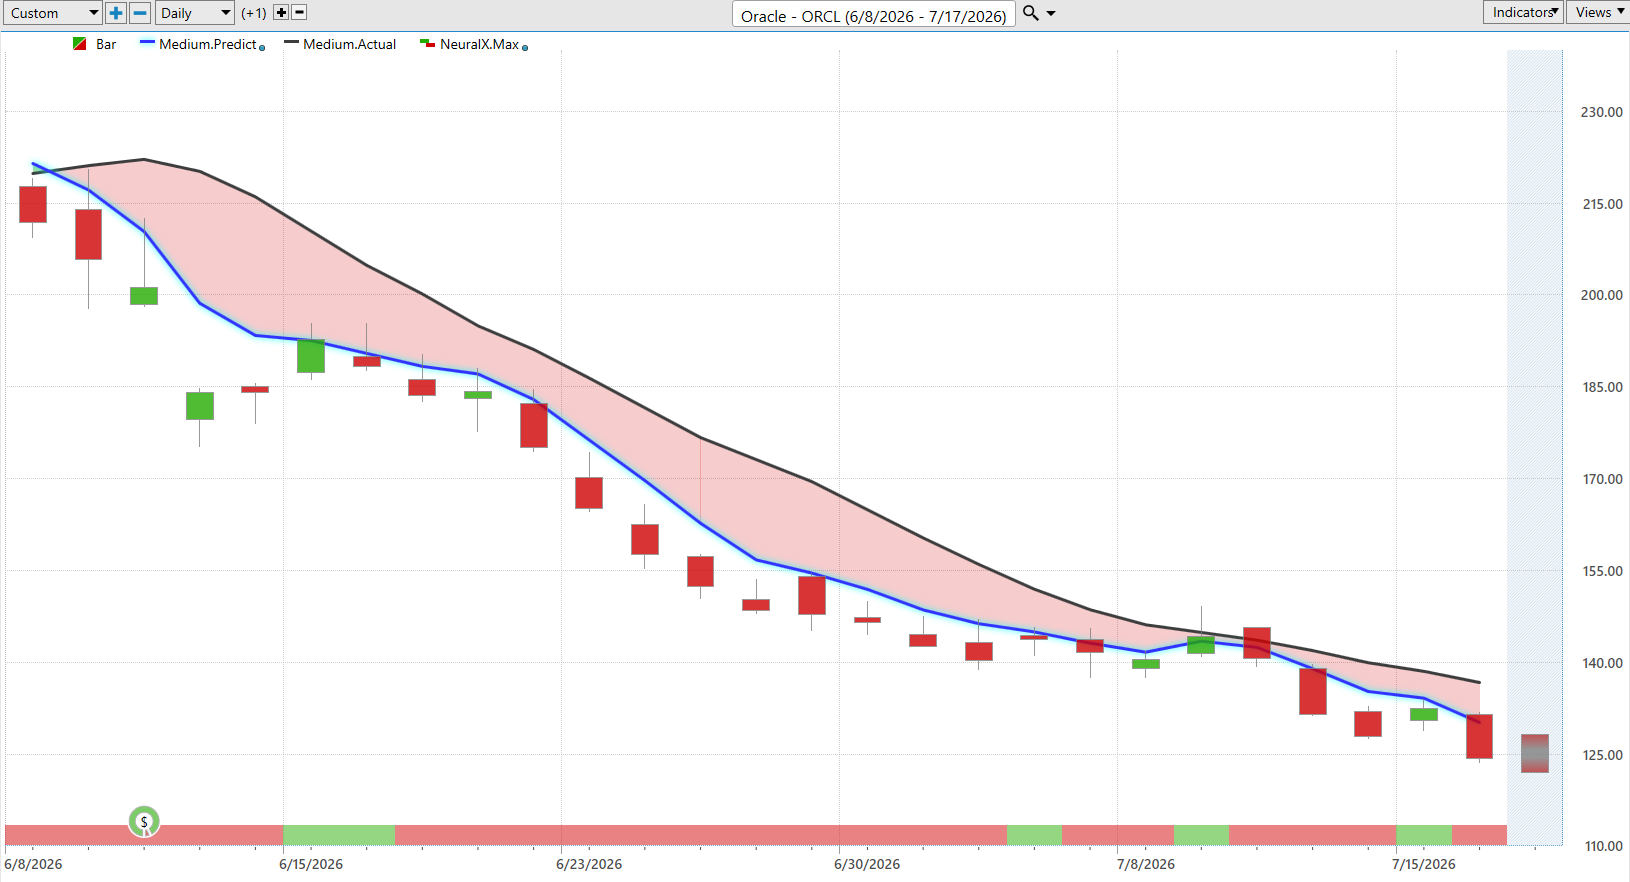
Uh here’s Oracle. So this has been a a longer term story here, but again speaking to some of the weakness uh and some of those popular AI names. Here’s Oracle blue line below the black line.
And this is actually interesting because this is in the software space, but uh more geared towards a lot of that AI investment. And we’ve just seen again that that excessive weakness over the past few months here.
Uh but you see that neural index bullish run sideways again. The market sort of starts running sideways a bit here. But very clearly the market is in a aggressive downtrend.
And so as we look at really since these forecasts have come through, it’s been very clear you do not want to be on the bullish side of Oracle. shares are down 42% in just 26 trading days.
Uh and of course we also have those predicted highs and lows which really just act as this road map. So the trader has all of this information to say hey look where do I want to be shorting the market if I want to be taking positions.
Uh and you see in many of these cases like here if you’re you know ready to short you would get just get filled at the open and the market immediately starts trading lower here. Uh and so numerous opportunities here as the market continues to decline over 40% just over the past couple of months here.
American Express ($AXP)
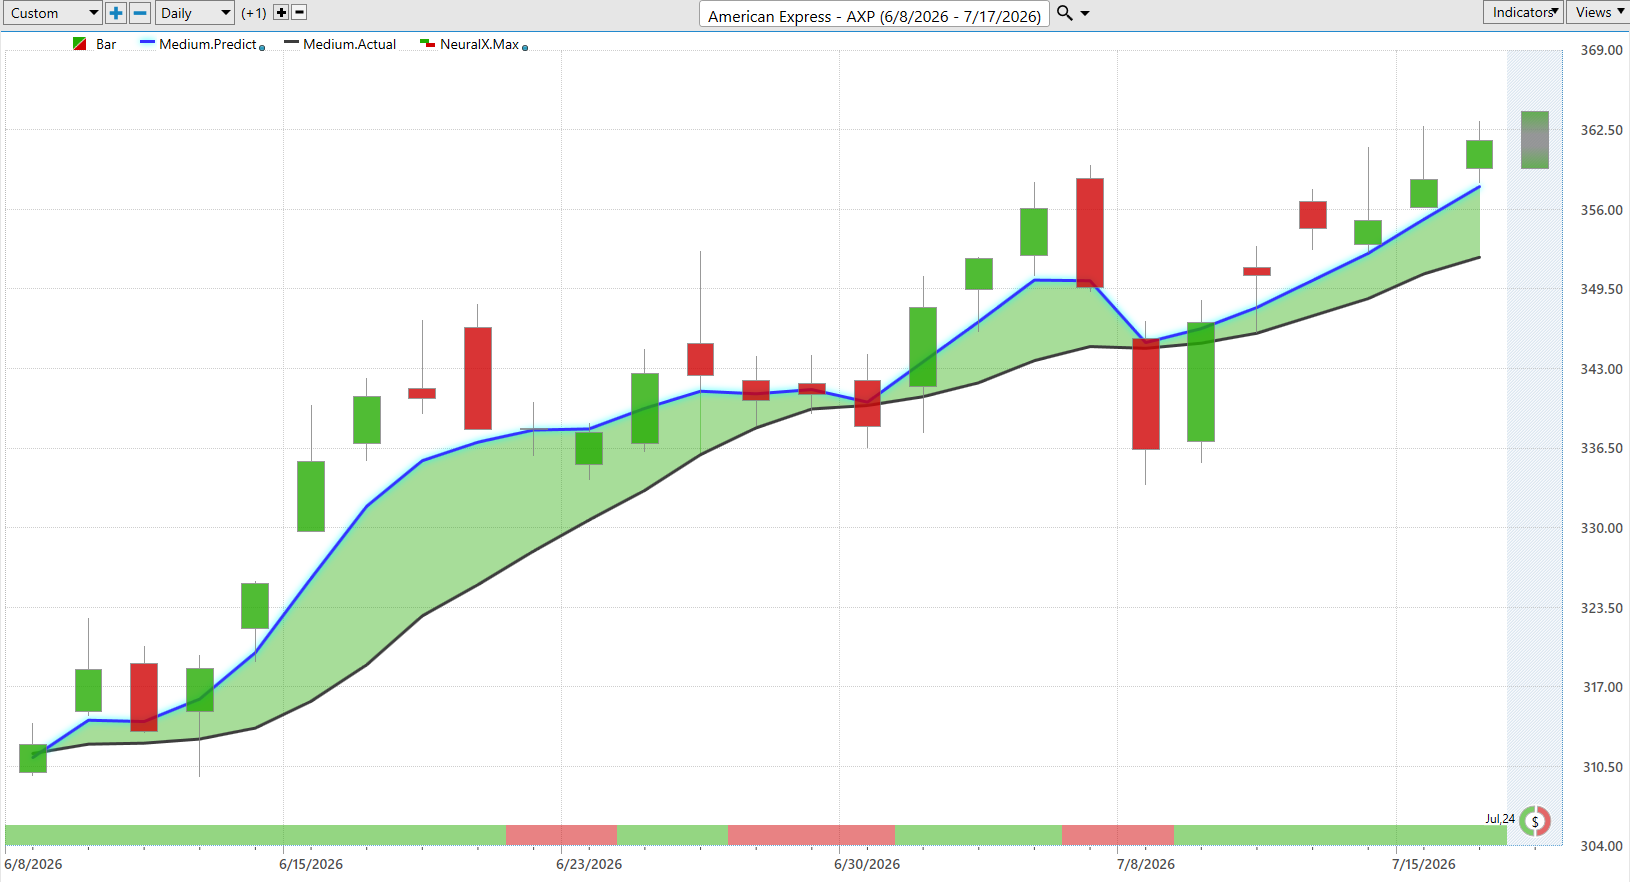
Uh and lastly here, American Express. So uh some of the financial stocks have actually done quite well. Some of the banking stocks, uh American Express we looked at a few weeks ago.
Uh and again you see this blue line above the black line. Uh neural index goes bearish here. We run a little sideways bearish here. We get a big dip, but that blue line remains above the black line.
Right? So once that neural index gets bullish, we see the momentum kick right back into the market and of course now we have earnings coming up. So that can lead to some um intraday volatility there.
So uh you know when you have a very nice cushion, you see about 15% uh move over the past 25 trade days, you may be able to take on some of that earnings risk uh as a trader here. So very interesting opportunity uh in some of the credit card companies here.
So uh just thought it’d be good to again do a review of many of these opportunities. It’s a very interesting market because if you look at the broader indices, things look quite weak, but there are some bright spots where you can get those edges in the market, take a position, and really lock in stops and and ride some of these trends uh as uh we just see a lot of rotation, you know, throughout the stock market.
So, uh once again, this has been the Hot Stocks Outlook for July 17th, 2026. Thank you all for watching. Best of luck out there and bye for now.