




Register for a Free Live Training
The Hot Stocks Outlook uses VantagePoint’s market forecasts that are up to 87.4% accurate, demonstrating how traders can improve their timing and direction. In this week’s video, VantagePoint Software reviews forecasts for Acadia Healthcare ($ACHC), Archer Daniels Midland ($ADM), Dorian LPG ($LPG), Brinker International ($EAT), Innodata ($$INOD)
.
Hello again, traders, and welcome back to the Hot Stocks Outlook for July 24, 2026. I hope you’ve all had a great week in the financial markets. As always, we’re here to cover the most recent VantagePoint AI predictive forecast. If you haven’t already, be sure to click the link in the description below to sign up for a live demonstration and learn how these predictive indicators and artificial intelligence technologies are helping traders make better decisions in today’s markets.
It has been a very active week, with plenty to cover. We have excellent examples across a wide variety of markets, including Acadia Healthcare, Archer Daniels Midland, Dorian LPG, restaurant stocks, and technology. These broad themes are easy to identify using the VantagePoint predictive tools.
Before diving into the individual opportunities, remember that these are daily bars and candles, meaning each candle represents one complete trading day. The first thing you’ll notice on every chart is the black line and the blue line. The black line is a traditional 10-period simple moving average, calculated entirely from historical prices. Like all traditional technical analysis, it summarizes what has already happened but has no predictive capability.
The blue line is where VantagePoint’s artificial neural networks come into play. Every evening, the software calculates a predictive moving average based on intermarket relationships. Instead of looking only at the stock itself, it analyzes dozens of related markets, including sector ETFs, individual stocks, currencies, interest rates, and commodities when applicable. For example, in Dorian LPG, the forecast incorporates relationships with energy markets such as crude oil and natural gas. This intermarket analysis allows the software to forecast future price direction rather than simply describing the past.
Whenever the blue predictive moving average crosses above or below the black moving average, it signals a potential change in trend. At the bottom of the chart is the VantagePoint Predictive Neural Index, which forecasts expected market strength or weakness over approximately the next 48 hours. Together, these indicators provide traders with both the larger trend and the short-term outlook.
Acadia Healthcare ($ACHC)
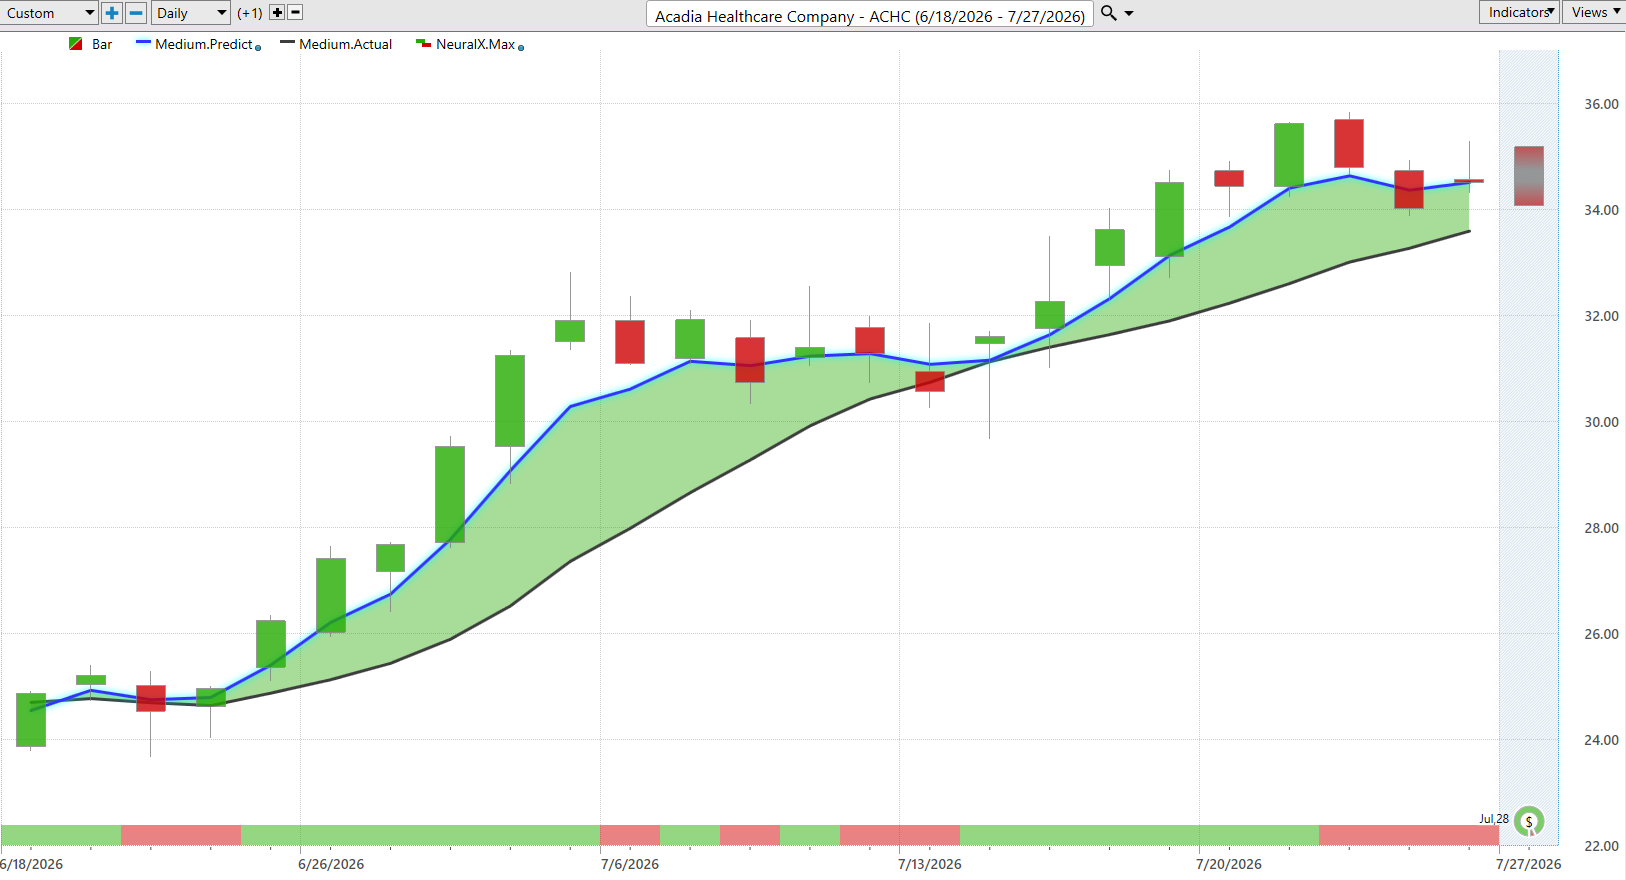
Acadia Healthcare provides an excellent example of these predictive tools working together. Once the predictive blue line crossed above the black moving average, the overall trend turned bullish. Although the Neural Index periodically shifted from bullish to bearish, those bearish readings simply produced brief periods of consolidation while the primary uptrend remained intact.
Since that bullish forecast, the stock has advanced roughly 38% over the past 22 trading days. Each time the Neural Index temporarily turned bearish, price paused before bullish momentum resumed. Throughout the move, the predicted daily highs and lows gave traders a practical roadmap for managing positions and identifying favorable entry opportunities.
Archer Daniels Midland ($ADM)
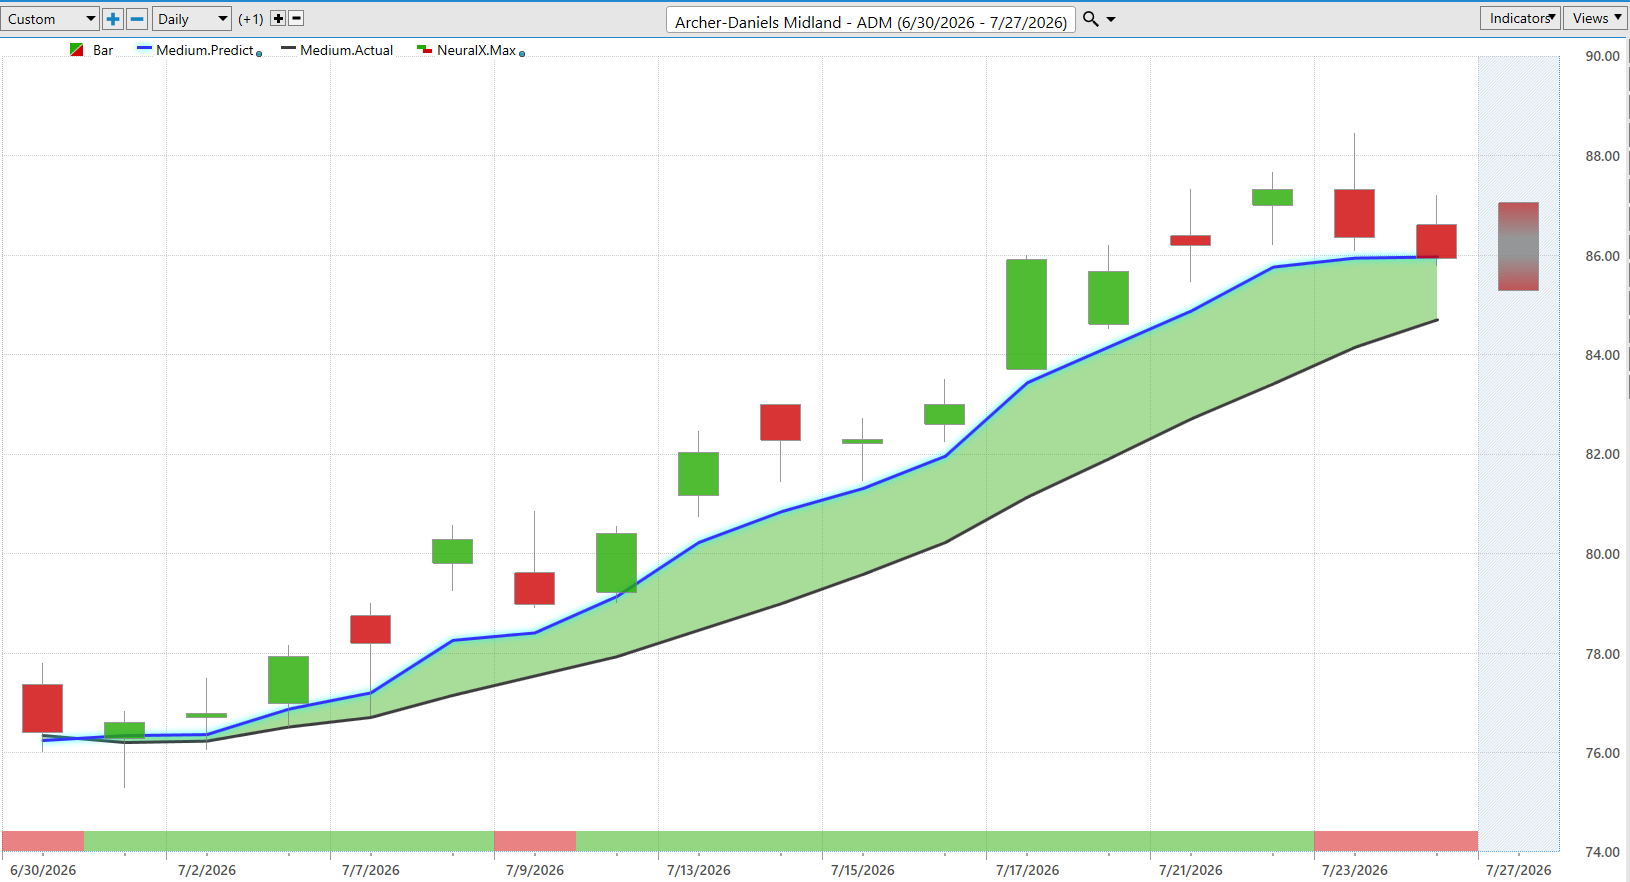
In Archer Daniels Midland, strength in the agriculture, fertilizer, and energy sectors has been reflected in the predictive forecast. The blue line crossed above the black moving average, while the Neural Index remained bullish throughout most of the advance. Since the beginning of July, the stock has gained nearly 13% in just 16 trading days.
The predicted daily highs and lows also highlighted attractive accumulation opportunities. Following a strong rally into the end of the prior week, the stock pulled back almost precisely to its predicted low before quickly reversing higher. Even during the following week, traders benefited from an additional rally of roughly 4%.
Dorian LPG ($LPG)
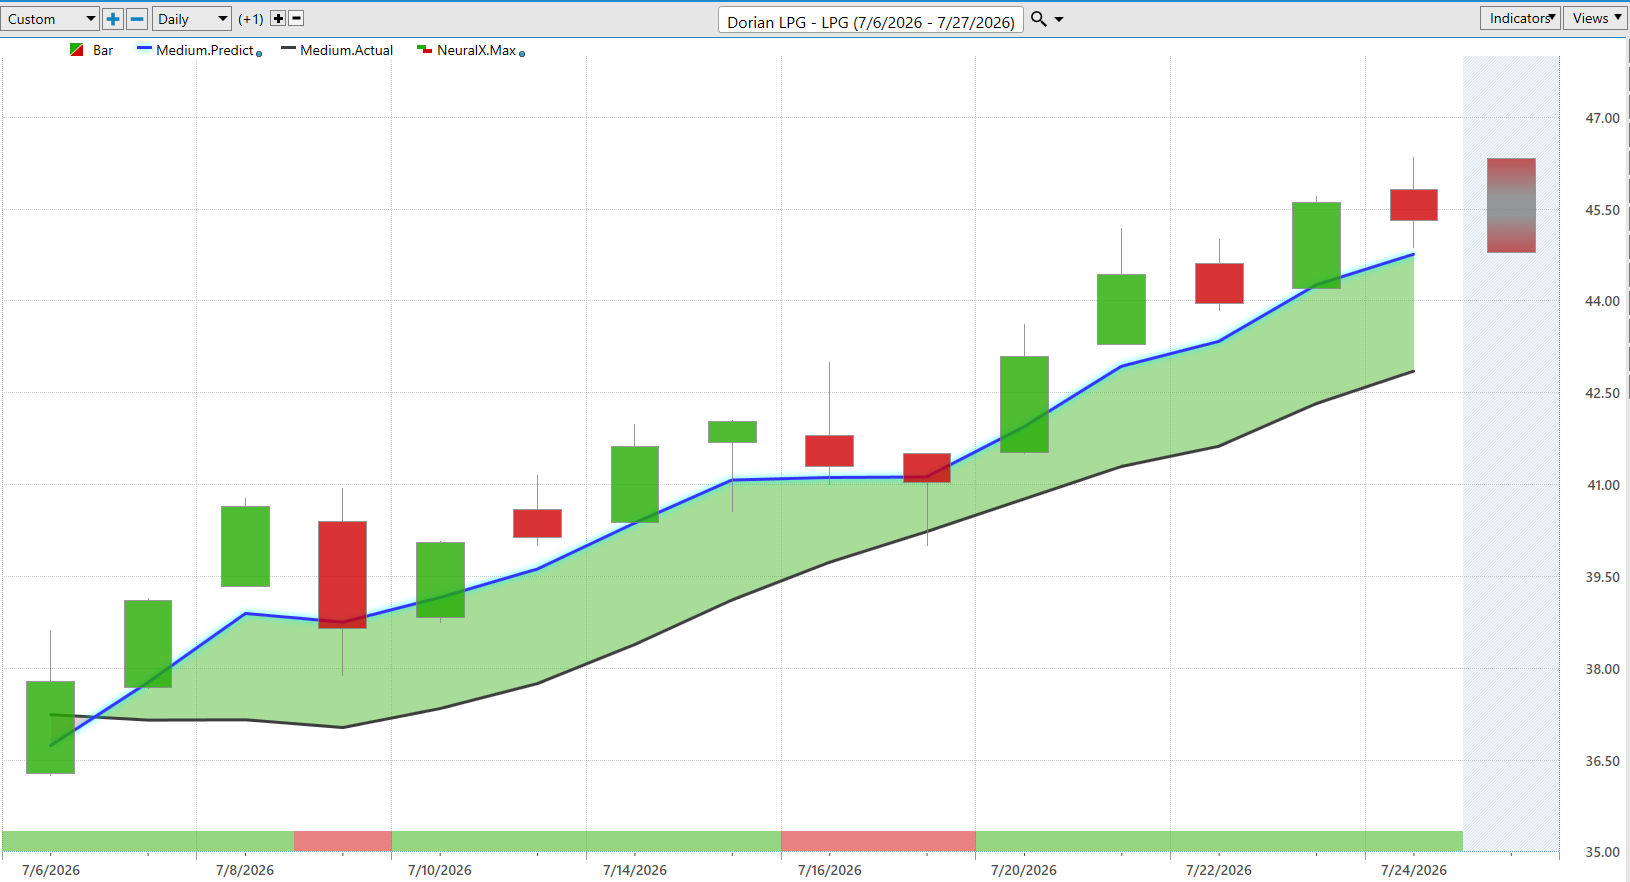
Dorian LPG continues to demonstrate exceptional strength within the energy transportation sector. Although the Neural Index periodically shifted bearish, the predictive blue line remained well above the black moving average, confirming that the broader uptrend remained intact.
The predicted trading ranges consistently highlighted attractive buying opportunities. On several occasions, price declined toward the predicted low before immediately resuming its advance. Over just the past several weeks, the stock has appreciated nearly 20%, illustrating how the predictive indicators help traders identify both trend direction and favorable entry points.
Brinker International ($EAT)
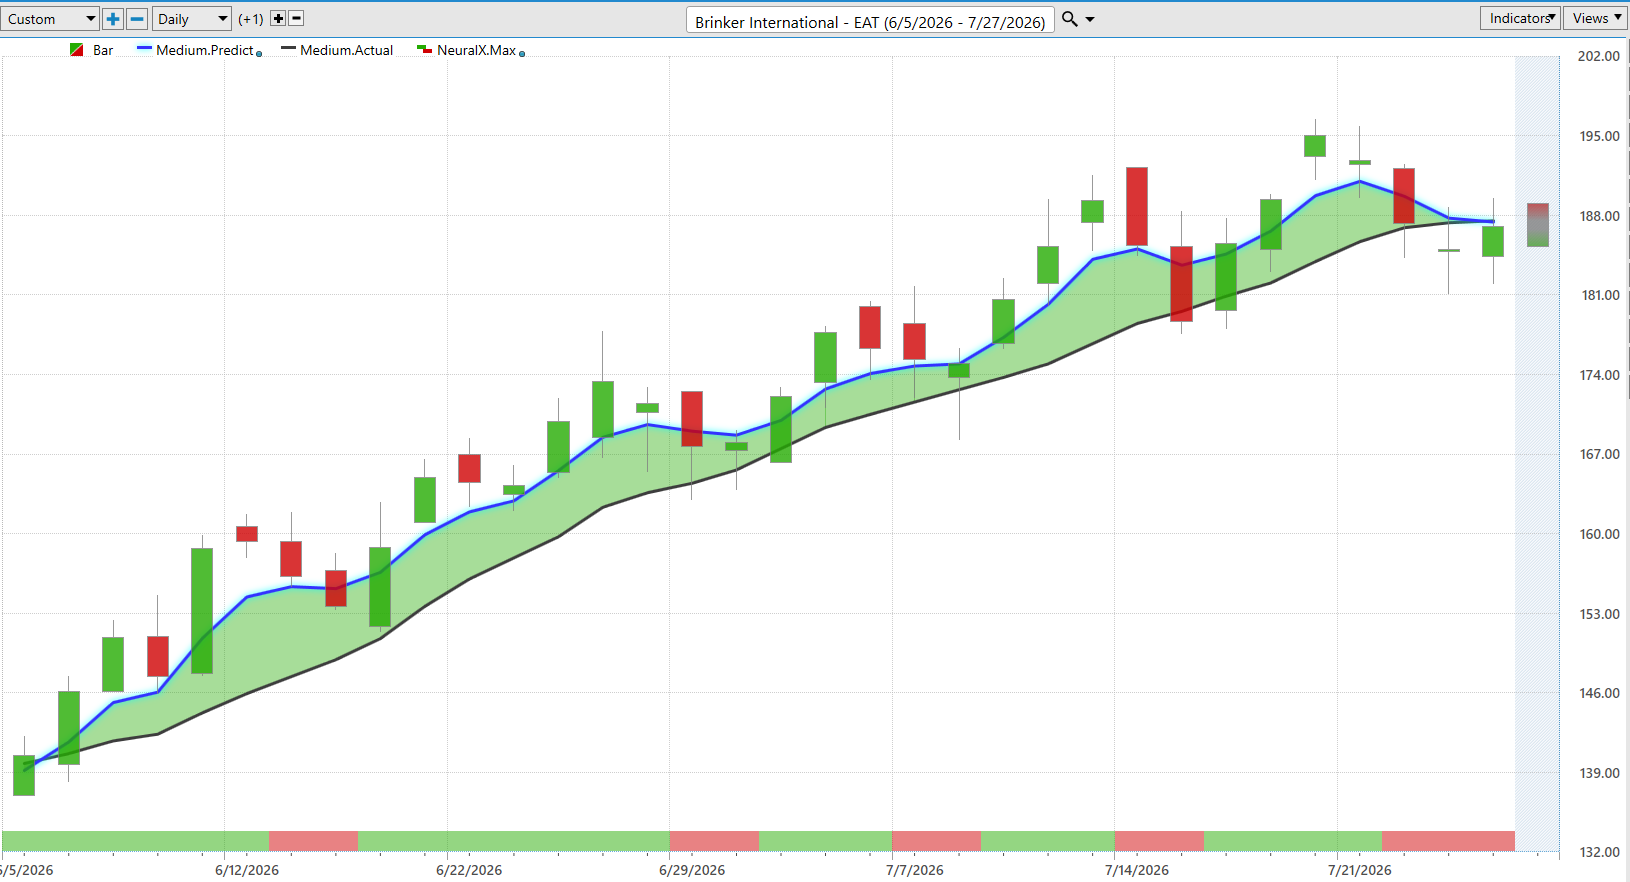
Brinker International, the parent company of Chili’s, continues to outperform many other restaurant stocks. While other companies in the group have struggled, Brinker has maintained a strong bullish forecast, with the predictive blue line remaining above the black moving average and the Neural Index spending most of its time in bullish territory.
Even when the Neural Index temporarily turned bearish, those pullbacks created buying opportunities as price moved toward the predicted daily lows before recovering. Over approximately the past 32 trading days, the stock has advanced nearly 32%, providing traders with another excellent example of a sustained bullish trend supported by VantagePoint’s predictive indicators.
Innodata ($INOD)
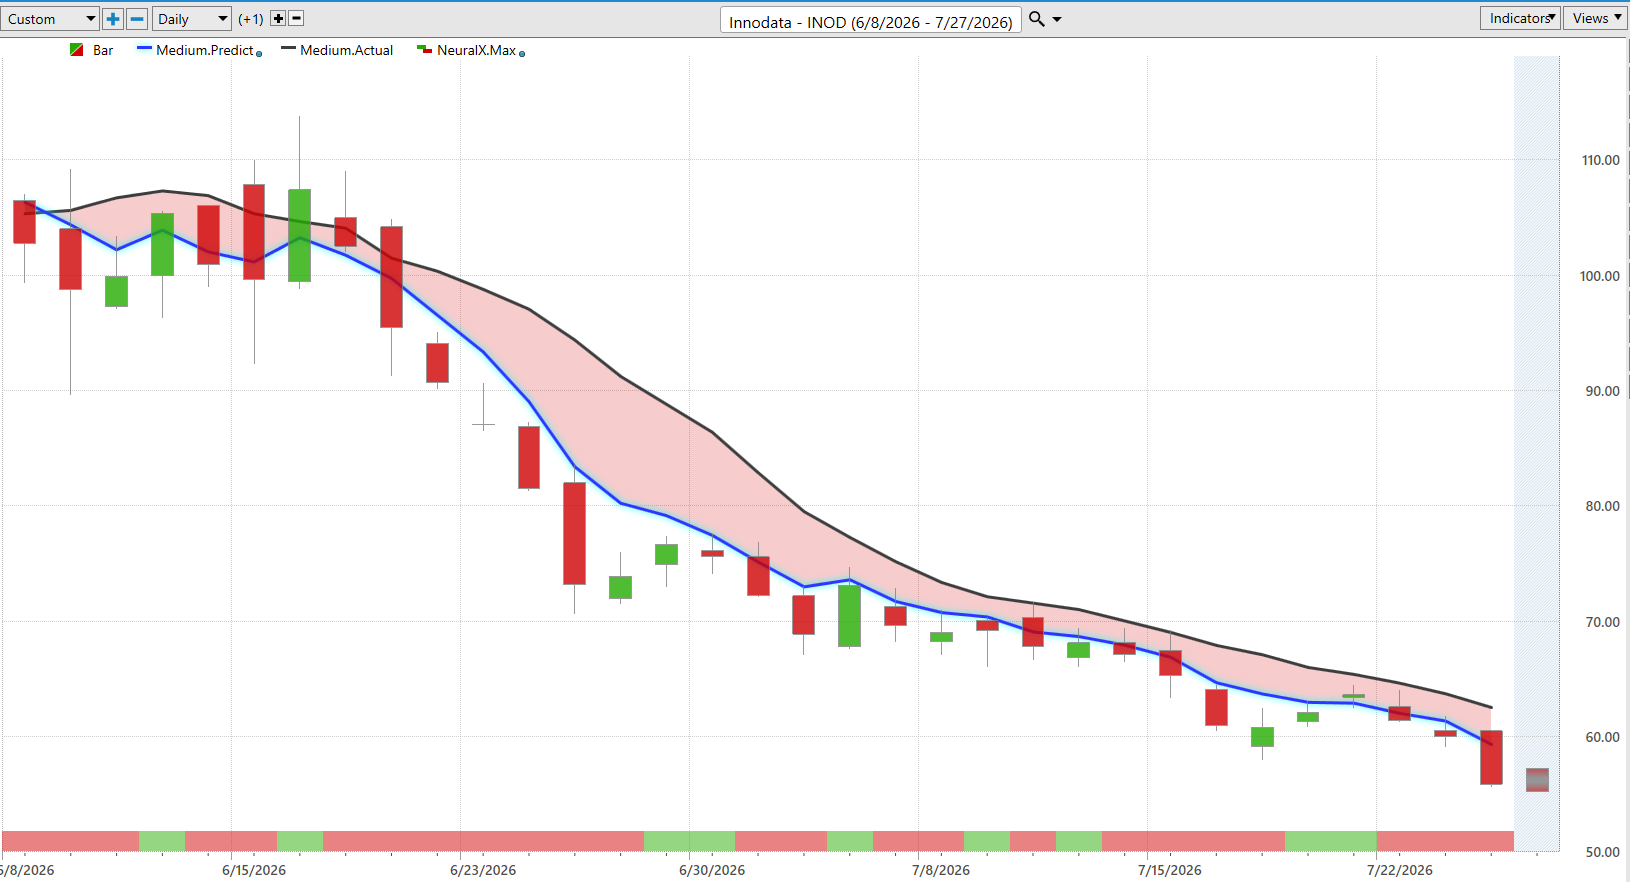
Finally, Innodata presents a very different picture. While many technology stocks experienced explosive rallies earlier this year, Innodata has now transitioned into a clear downtrend. Since early June, the predictive blue line has remained below the black moving average, confirming persistent weakness.
Although the Neural Index occasionally turned bullish and produced brief periods of sideways trading, the broader trend remained negative. The stock has declined approximately 42% over the past 31 trading days, emphasizing the importance of protecting profits and avoiding prolonged exposure as trends reverse. The predicted daily highs and lows continued to provide valuable guidance by identifying likely resistance levels and helping traders manage short positions or avoid unfavorable long entries.
That concludes this week’s Hot Stocks Outlook for July 24, 2026. Thank you for watching, best of luck in your trading, and we’ll see you again next week.