


Register for a Free Live Training
The Hot Stocks Outlook uses VantagePoint’s market forecasts that are up to 87.4% accurate, demonstrating how traders can improve their timing and direction. In this week’s video, VantagePoint Software reviews forecasts for SPDR SPY($SPY), Cummins ($CMI), Kroger ($KR), Sociedad Quimica Y Minera de Chile (SQM), Eastman Chemical ($EMN), Albemarle ($ALB), 3M ($MMM), Intrepid Potash ($IPI), SPDR Gold Shares ($GLD),
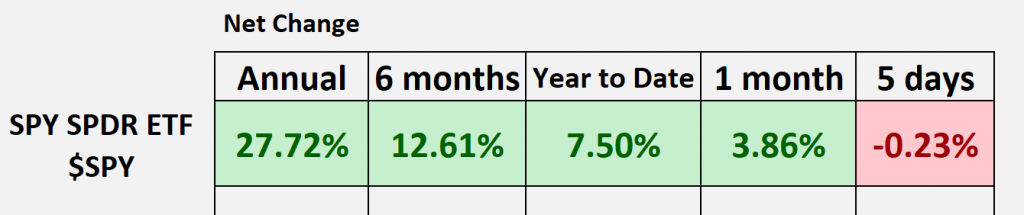
SPDR SPY ETF ($SPY)
Hello again, traders, and welcome back to the Hot Stocks Outlook for March 1st, 2024.
Hope you all are having a nice week out there in the financial markets. As always, we have a lot to cover, a lot of really important shifts potentially opening up here, which I want to go ahead and highlight. And really explain how Vantage Point scanning and features can really help you identify these important shifts in the marketplace. So, as we typically do, we can start out by taking a look at the broader equity indices, and so, via the SPY ETF, well, we can see that we’re about 7.5% year-to-date, so not a bad move to start the first couple of months of the year. But I think we need to be real cautious here, and I want to highlight some of these things that may be shifting around. So, since we had those Nvidia earnings, markets have really run sideways. You know, it certainly hasn’t been like it was before, where we had really everything marching higher day after day. And so, we want to be very selective at where are we identifying new opportunities and what might we be putting into the portfolio. So, we’ll start out here with actually reviewing a couple of opportunities from last week, but then we’ll get into a lot of these new important shifts. But this is really good to highlight how all of these predictive indicators work on an individual basis. And so, also, if you haven’t already, make sure you go ahead and you can click on the link in the description below, and get a live demonstration. You know, learn how all of these predictive indicators work together.
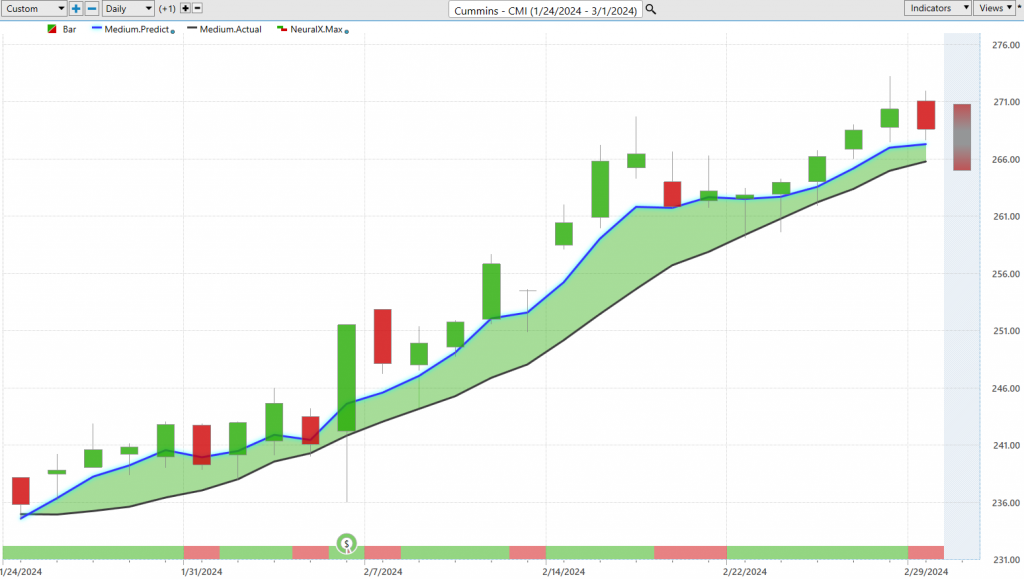
But specifically here with Cummins, this is a good example of what we have here is daily price action. So, all of these forecasts work exactly the same, and it’s each one of these candles is going to represent a full and complete trading day. And so, right up against all that price data, what you’re going to notice is that there is a black line and a blue line value. Now, the black line value that you’re seeing there is actually a simple moving average, and we keep this consistent here, where this is always a 10-period simple moving average. So, it’s just going to take the last 10 period closes, add them all together, divide by 10, and then what that does is it smooths out the existing price action, which is great to let us know where price has already been, but it’s rearward looking. That’s really the problem with most technical indicators is that they’re really just created by data that’s already occurred, and they also only look at the data from one market. And the reality is every single stock, or futures market, or commodity, or currency is affected by other global markets, whether it’s, you know, the S&P or gold or oil prices. And so, here in Cummins, what we want to do is compare that black line value to this blue line value. And so, for this, essentially, price prediction to get plotted against the chart every evening, well, this is where that technology of artificial neural networks come into play. And what they’re doing is what we would call intermarket analysis on Cummins. And so, what we’re able to really identify, and what the technology is really able to identify, is important market relationships that affect the future stock price of this specific stock. Now, we have to think very deeply about this. Some of these relationships could be leading, some lagging relationships, some positive or inverse correlations, but there’s also those big heavyweightings that you want to incorporate into any of your stock trading, things like, you know, the S&P 500, the value of the dollar index, and global interest rates, and then those ETF groups, which are wrapping up a whole lot of buying and selling in the marketplace, as well as again, individual stocks, which can share some subtle market relationships. And so, all of that taken into account to generate a highly accurate predictive forecast. And so, all of these indicators are tested for their accuracy. But what we want to do is produce, in this case, a prediction of average prices moving forward. So, whenever we see that blue line cross above the black line, well, it’s suggesting that the market prices are going to start moving higher and start moving towards that moving average, right? They should trade around that predicted moving average. So, here we have about a 13% rally now. But what I want to draw your attention to is where we sort of left off from last week, taking a look at Cummins here, and saying, okay, well, we’re also provided, at the very bottom of the chart, you see this bar that goes from green to red, and we’re even provided a predicted high and predicted low range, which you see, we have this what we’ll call this shadow candle here. And so, short-term traders can utilize this neural index at the bottom because what it’s doing is also utilizing that intermarket data. It’s looking at those intermarket relationships, but it’s tuned to solve a different problem. And this problem is short-term momentum over the next two trading days. So, you can really think of this as, you know, a couple of trading days moving forward over and over at a time, but it’s again just looking ahead two trading days at a time for short-term strength or weakness in the market. And then, to keep things very simple, this predicted high and low range, well, that’s looking intraday, essentially, for the next trading bar, and letting you know what the daily range is expected to be. So, when we look back at all of those predictions, specifically here in Cummins, well, we can see, just going back to last week, well, this being Monday, you cease to start the week, you have that neural index bullish going into the week, a prediction for where the predicted low is likely to be, some predictions for also where the high is likely to be on these trading days as well, but you see, already getting a nice rally as this trend, expected to continue, at least determined by all these predictive indicators, suggest the market would continue to go higher. We got a 3.7 point, you know, a little under 4% rally in the past four trading days. So, not a bad move here in an area where, you know, there’s some market strength.
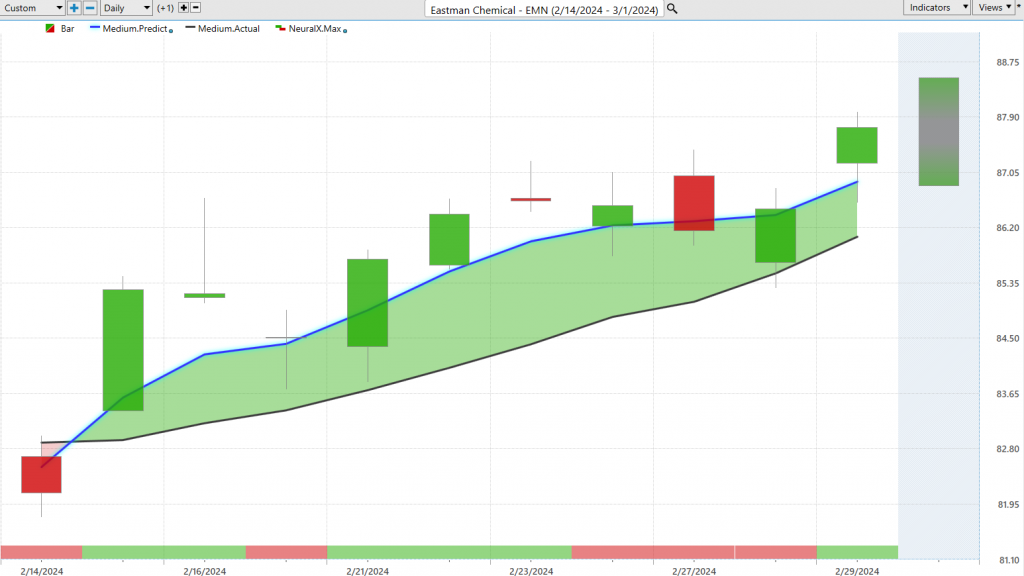
Eastman Chemical, now this was another market which we took a look at the longer chart of all these shifts we’ve had over the past, but more recently, there’s been a shift to the upside. And the theme I want to highlight here is, there’s something going on in a lot of these basic material stocks, which is, you’re able to see a lot of this from the help of the IntelliScan. So, what we’re able to identify is actually seeing where are all these fresh crossovers occurring. Eastman Chemical being one of these names, but even just this week, saying, okay, well, we already know this is another one of these bullish markets. Let’s go in with our Vantage Point predictive indicators. And what’s interesting about this is, you see, going into the week, the neural index is bullish, it gets bearish, and it’s letting you know, okay, over the subsequent 48 hours, expect price weakness, but the overall trend is still very bullish. So, we have that again, sort of another layer here of predicted highs and lows to help us out, and say, okay, well, if we want to be buying, what price levels do we want to be accepting? And you see, even here, just from the past couple of trading days, we’re getting this nice advance. Oil prices are doing pretty good here, and it’s very likely that this gaps up again and starts to move. But, just in the past couple days, a 2.8% rally, just from Wednesday’s predicted low there, in the middle of the week.
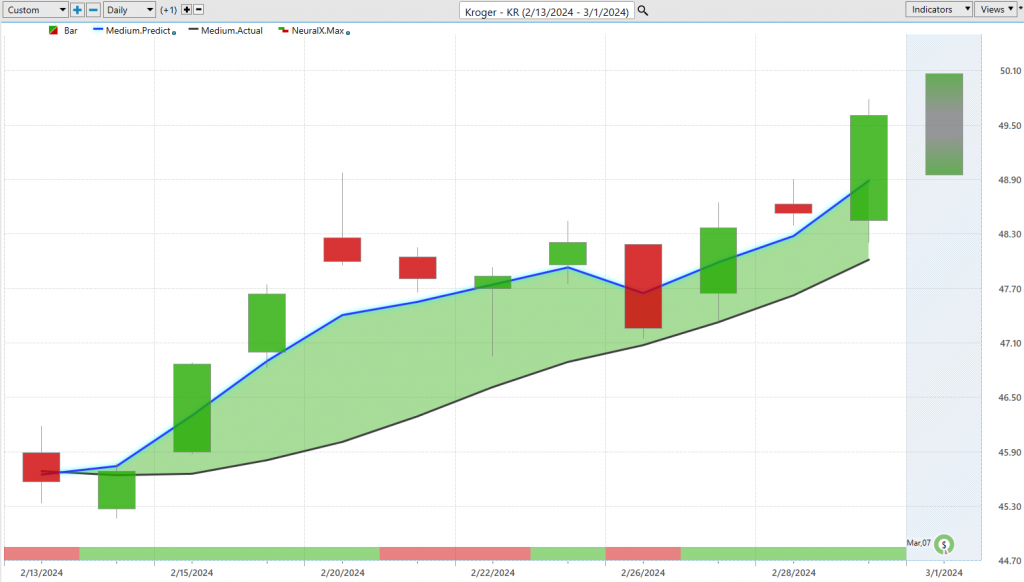
Now, here’s Kroger, and I wanted to bring this through because we do have a lot of earnings and a lot of just volatility to the market. We have a lot of other stocks that are really at the higher end, like the SPY and Q’s are very extended, and you see a lot of those higher weighted stocks, starting to sort of, you know, top out, not really making their advances anymore. But here’s Kroger, a really good example again of these different things happening throughout the market, but where you want to be paying attention to that short-term price predictions from things like the Vantage Point predicted highs and lows, which we just looked at. So, here, you see Kroger get this crossover to the upside, a lot of strength. But let’s take a look at these shorter-term indicators. And this is what’s so interesting is, you see how the market really accelerates to the upside, and these predicted highs and lows do a really good job of adapting to these situations. So, even when you have earnings and a lot of noise, but what I want to bring your attention to is actually days like this, you see this all the time where it’s like, okay, you’re coming way out of the range there, but in reality, what’s happening is you’re just moving to this previous predicted low. And when you get accustomed to this, you recognize this all the time, of all the price action was bullish this day, you didn’t feel any of the lower part of this range, and so that still needed to be filled. So, it took another trading day, but sure enough, you come right down to that predicted low, then the next trading day, as the trend continues, where you’re moving? Well, to this predicted high, right? And that, uh, momentum kicks back into the market, neural index gets bullish, uh, and you see this nice advance in the share price. So, here in Kroger, again, a nice move here, um, you know, just pretty recently here, but you’re seeing about a, you know, 7% rally, just over the past 10 trading days, and some good short-term guidance from these predictive indicators.
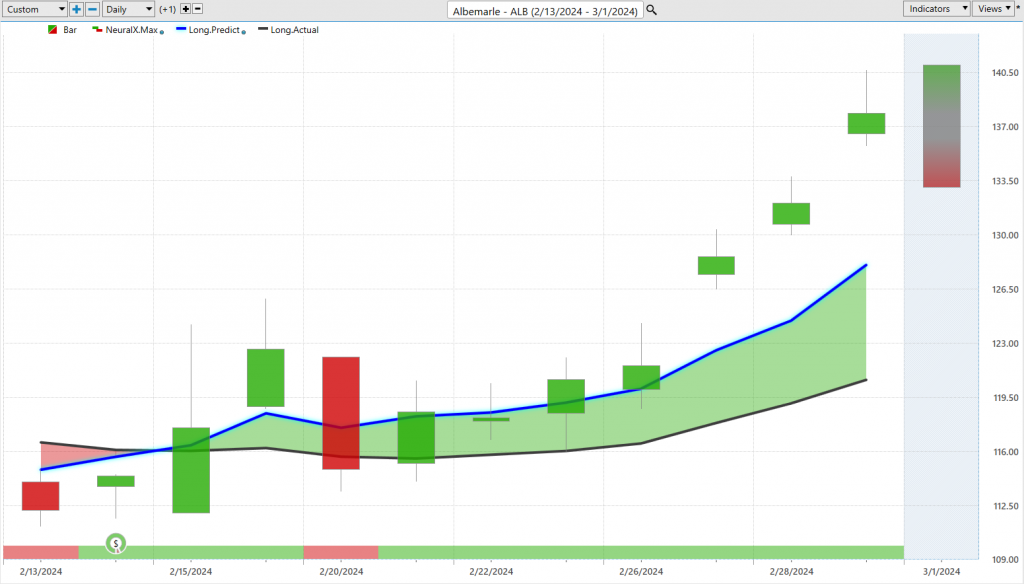
Now, another interesting thing that has been occurring is something going on in some of the lithium stocks. So, here I have SQM, here’s Albemarle, and we started to see these crossovers to the bullish side. And this is where it just looks like there’s better opportunities opening up outside of, you know, the normal sort of SPY, Microsoft, Nvidia, all those highflying stocks, where you can still be long, and of course, trailing stops. But as far as new opportunities, you want to identify, well, where are these fresh shifts happening? And the IntelliScan is extremely helpful for this. So, what we can do is actually see where all of these fresh crossovers occur. And you can see here in SQM, we have that crossover occurring. We can bring up our predicted highs and lows, you see this really nice candle, where we moved down to that predicted low, we actually just had earnings. What’s really great about this is, when you get a really nice entry, well, you get a nice cushion, so that you can take on the volatility of that earnings, then really benefit as the market accelerates higher. And so, here, you see about an 18% rally in just the past eight trading days. But why these sort of situations stand out to you is, well, we can look at what else is coming through at the same time. Well, here’s ALB, and again, you see this big crossover to the upside, a lot of distance between that blue and the black line, and it signals that something is going on in that lithium space, uh, and there’s been at least some short-term opportunity. And now, things, you know, really accelerating here in shares of ALB, about a 20% rally.
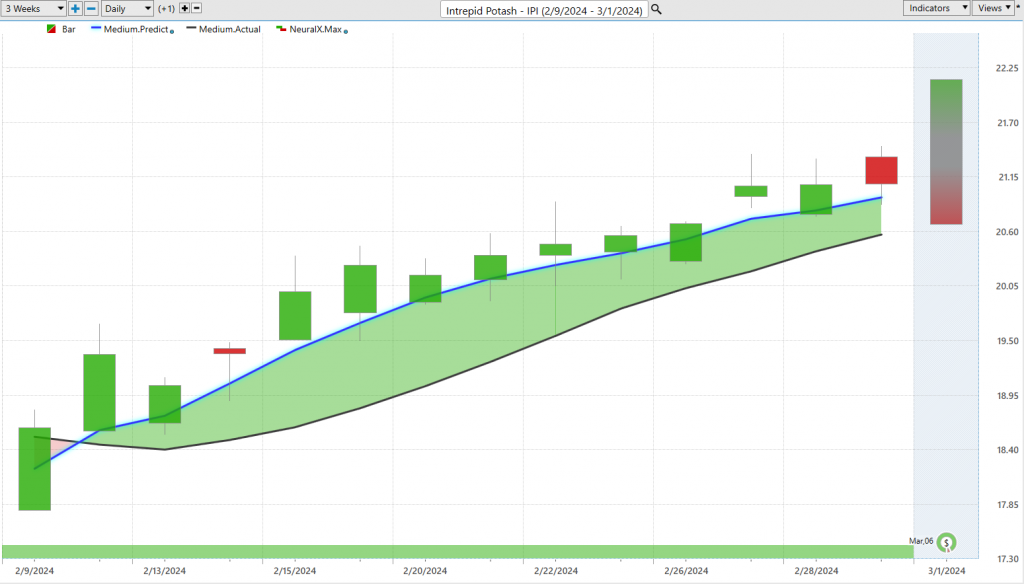
Uh, here’s Intrepid Potash, again, sticking with this basic material space, and you’re just seeing again, a lot of these shifts to the upside, and a really great example of all three of these predictive indicators that we look at week to week, your crossover, blue line over black line, clearly the trend is up. And look at your neural index here, just every day saying, look, expect subsequent strength over that 48-hour period. And lastly here, of course, our predicted high and predicted low range to help day-to-day with that guidance moving forward. Uh, and so, the thing about this is, you know, every day, when we look at, you know, for today’s trading day, on Friday, we’re going to get a candle that’s going to fill this predicted range, but the prediction won’t change, right? So, we can see how accurate all of these predictions are, every single trading day. And you see, early on in the trend, well, you actually get a gap down. So, if you have any limit orders waiting, they get filled, excellent entry to start things out. You see how you often get some selling from these predicted highs, but with the trend up, neural index up, you’d want to expect that continuation of trend. And so, what’s great about this is, you can take a position, you know, take some profits, and then use those profits to finance sticking with the trade. And that can allow you to stick with those winners longer, and be involved in some of these things, uh, that really start to break out and move in an exciting way. Uh, so here, we have a 13.7% rally in just the past 13 trading days. Uh, so a lot of these things aren’t a lot of people’s radar, but when they start to move, they can really accelerate. Uh, and you want to be really nimble with that short-term pricing to get a nice position, especially if, you know, you got earnings and a lot of these things coming in around the calendar.
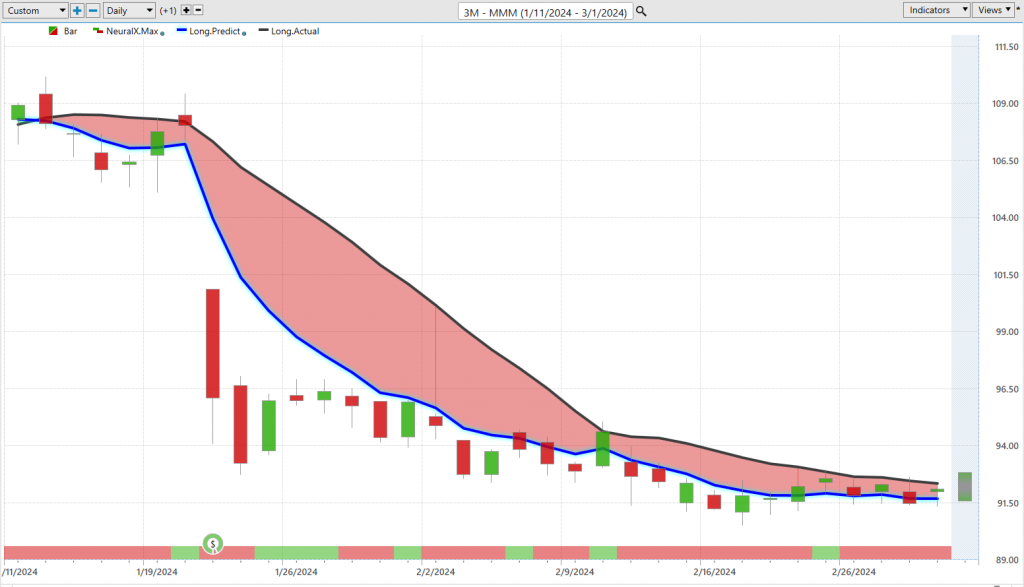
Here’s 3M, just wanted to rehash, uh, not a good place to be. We looked at this last week, uh, you know, we may get a shift here, and there may be some opportunity, but right now, and this week, it has not been a place that you want your attention going to.
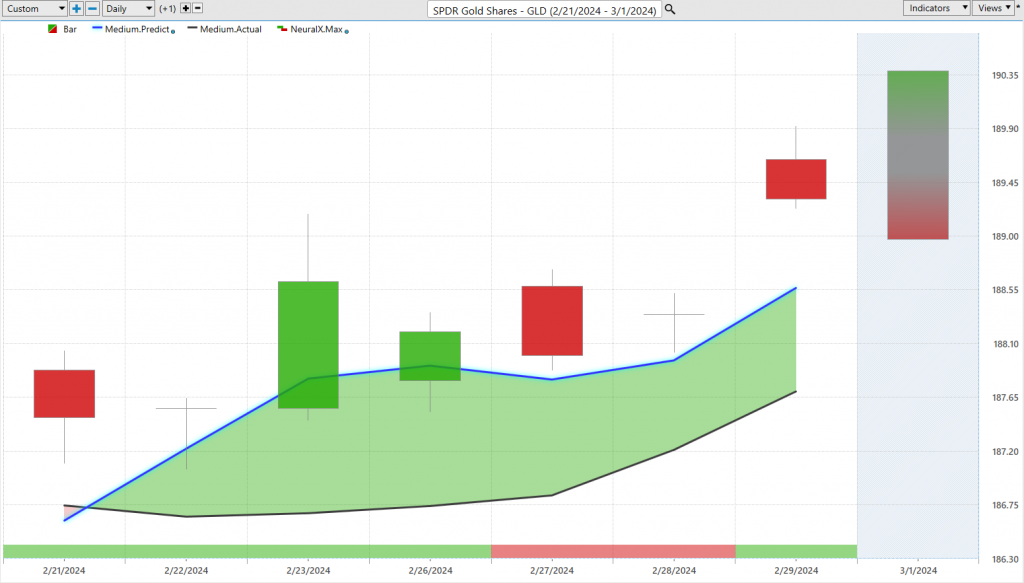
Uh, and lastly here, I’ll just go ahead and end this on GLD, the SPDR Gold Trust, here just some interesting shifts going on in a lot of these important markets out there on the macro side. And so, if you are a gold trader, we got this strong crossover here on GLD back on 2/22. And the most recent forecasts here have been pretty brilliant, where we move down towards this predicted low, you get a lot of gappiness because of that overnight futures trading, but sure enough, we’re starting to move higher here. But again, we can just look at how much distance you have between this prediction of prices and that lagging moving average, and that really lets you know that something’s going on here, a trend picking up. And of course, you want to get those really nice entries because then you can lock in a stop at break-even, trail your stops, and you know, potentially make a lot of money as these important shifts start to come into the marketplace.
So, we’ll go ahead and leave it there, but once again, this has been our Hot Stocks Outlook for March 1st, 2024. Thank you all for watching, best of luck, and bye for now.


