


Register for a Free Live Training
The Hot Stocks Outlook uses VantagePoint’s market forecasts that are up to 87.4% accurate, demonstrating how traders can improve their timing and direction. In this week’s video, VantagePoint Software reviews forecasts for Cheesecake Factory ($CAKE), Amdocs ($DOX), GE Aerospace ($GE), Netflix ($NFLX), Marvell ($MRVL)
VantagePoint AI Hot Stocks Outlook June 19, 2026
Hello again, traders, and welcome back to the Hot Stocks Outlook for June 19th, 2026.
I hope you all have had an excellent week out there in the financial markets, a little bit of a short week with no trading here on Friday, but a great opportunity once again to take a look at the most recent VantagePoint AI Predictive Forecast.
So if you haven’t already, be sure to go ahead and click the link down in the description below and get signed up for a live demonstration, and you can learn all the specifics about these predictive indicators and artificial intelligence technologies that are helping traders make much better trading decisions out in the marketplace.
Cheesecake Factory ($CAKE)
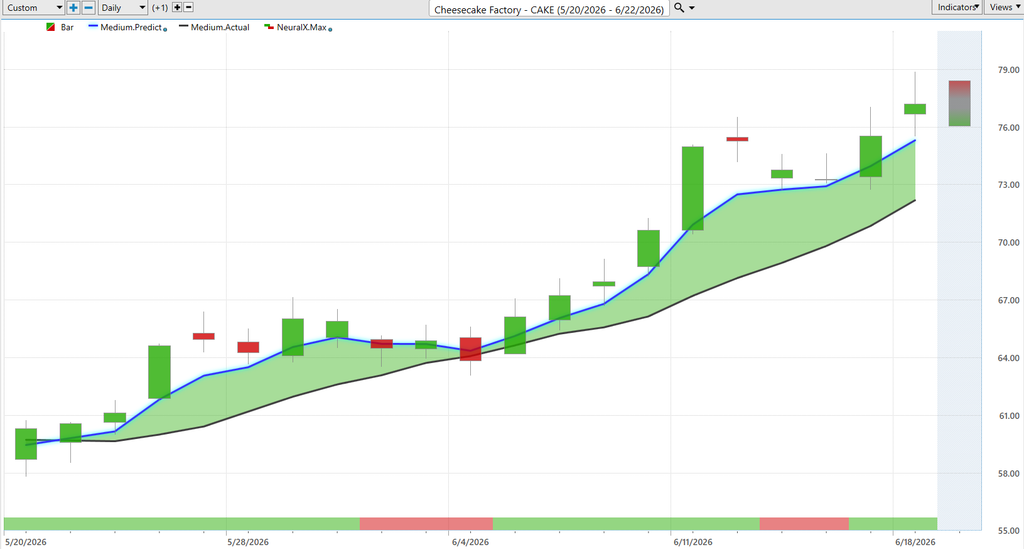
And so a really nice example of how all of these predictive tools within VantagePoint work together here in shares of Cheesecake Factory.
And so what we’re looking at is daily price action, where all of these individual candles will represent a full and complete trading day, and it’s right up against all that price data that we’re first going to notice that there is a black line and also a blue line value.
And so what that black line value is, is actually a simple moving average, or what we refer to as the actual simple moving average. In this case, it would be a 10-period. So it simply looks at the previous 10 closed prices, adds all of those together, and then divides by that number.
Traditional technical analysis like this is really lacking in that it only looks at past price data and has no forward-looking predictive capability. So it works as a good summary or baseline for VantagePoint traders to know where market prices have been, but obviously traders want to be ahead of that next move and understand where prices are likely to head next.
And so VantagePoint traders are able to compare that value to this blue line value. For this number to get plotted and calculated on the chart and placed every evening, this is where the technology of artificial neural networks comes into play.
And what they’re doing is what we would call intermarket analysis. What that means is that rather than just looking at past prices from a single market like traditional technical analysis does, VantagePoint’s tools are looking at dozens of other markets that are known to drive and influence future prices.
This can be things like other individual stocks. This can be ETFs that wrap up sectors and groups of stocks in the marketplace. But it really takes this global, in that it’s going to analyze things like global currencies, global interest rates, and even potentially global commodities where applicable.
So it’s taking these dozens of other markets, understanding how those are affecting specifically the target market that you’re trading. This is really the great thing about artificial intelligence. It can take in huge amounts of data and then generate highly accurate predictions.
Whenever we see this blue line cross above the black line, it is suggesting that these average prices are going to start moving higher and traders can look to take a long position.
Now we see since that blue line, or that predicted moving average, moved above the actual moving average, the market has moved up about 28% in 20 trading days.
But that’s not the entirety of the predictive forecast. We actually have these other tools within VantagePoint that can help traders solve different problems in accordance with their trading strategy and approach.
If we look at the very bottom of the chart, you’ll notice that there’s this bar that will go from green to red, back to green, and this gets updated every single evening for the trader, much like its other predictive indicators, at 6 p.m. the night before the next trading day.
What the VantagePoint Predictive Neural Index does is anticipate short-term strength or weakness just over the next 48 hours. So it’s always trying to anticipate 48 hours ahead. Are we likely to see short-term strength or weakness within the market?
Of course, we can factor that into the overall trend direction as highlighted from the VantagePoint Predictive Moving Average.
You’ll notice that as the Neural Index goes bearish, the market sort of simmers down for a couple of trading days. Again here, actually just really running sideways, but that blue line, that Predictive Moving Average, is still above the black line, signaling the overall trend is up.
Notice how the Neural Index goes bullish once again and we start to see that momentum enter into the marketplace. Again, you see the Neural Index goes bearish here. You get a couple days of sideways price action, nothing much going on over that 48-hour period, but very clearly this Predictive Moving Average is well above the actual moving average and a very strong uptrend is in place.
That information is obviously very useful for traders. We see how it’s very effective here to really anticipate some of that short-term weakness but stay involved in the uptrend.
What really kicks this up a notch is you’re actually provided a predicted high and low. So you’re really given a roadmap down to intraday price levels that can help traders establish a position, build on that position, or potentially even take profits as the trend continues.
We can actually look back, as we do each week here, and say how accurate have these predicted high and low daily forecasts been against the actual market data.
This will end up being Monday. We’ll get the price action filling into this candle. We’ll see how accurate the predicted high and lows are.
Notice how as this trend gets started, we can anticipate that the trend is up. We can take a long position and then manage that position with the help of these predicted highs and lows.
I tend to point out here that I see this quite a bit where whenever you have a Thursday where the market trades higher and you really don’t fill into any of this lower part of the predictive range, you often see those levels getting hit.
You see how this works out where you move right down to that predicted level, but the uptrend is very much still in play here. So many opportunities to add to this position and obviously take profit as the market moves higher and hits into these upside profit targets that you might have here.
So really nice opportunity here and also an example of how all of these predictive tools work together and traders can really modify this in accordance with their trading strategy, whether that be day trading, shorter term, position trading, or swing trading.
Amdocs ($DOX)
Now we do have a very mixed market. The broader indices are moving higher. A lot of those big tech stocks are having a good past couple of weeks here, really moving through a lot of volatility in the marketplace, but some markets are not performing well.
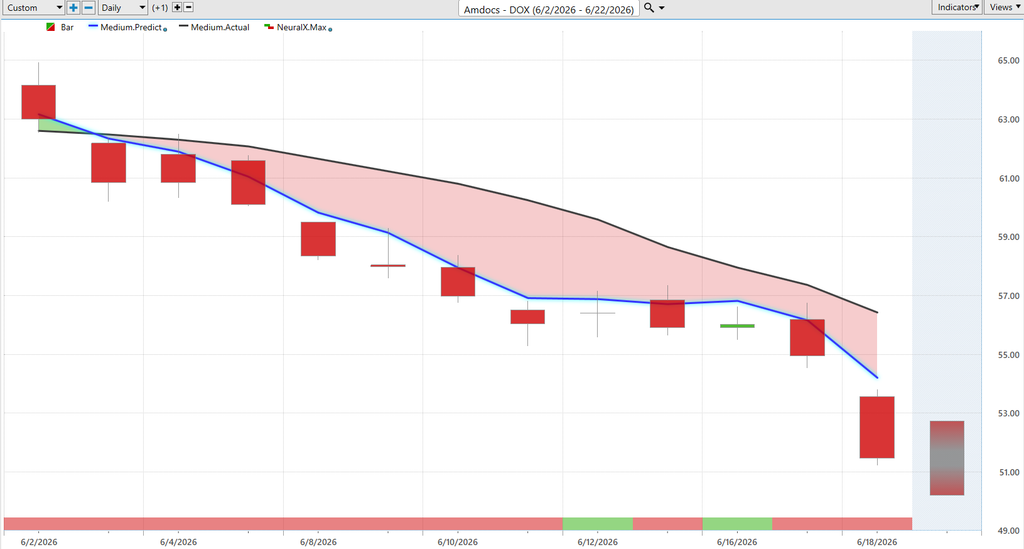
So here’s shares of Amdocs. A really nice example here of how this blue line is moving below the black line, signaling that the market is in a downtrend.
Additionally, you see as that Neural Index goes bullish, this is the only period where this market sort of simmers down a little bit and runs sideways for a few days, but very clearly the overall trend is bearish.
What VantagePoint traders can do here is really utilize this information, and it provides an adaptive roadmap. That’s really one of the benefits of this technology. It is adapting to these shifting market dynamics.
Every evening it is taking in the most recent price data, looking at those intermarket relationships, and then producing a highly accurate forecast of where things are likely to head next.
Of course, again, you get these upcoming predictions of the daily high and low, but numerous opportunities here to potentially short and take profits on shorts.
This is where traders can utilize some of these tools to balance out their portfolio. So where you may be having some bullish positions in the market, it may make sense to hedge some of that with areas of the market where there is actually likely to be weakness.
You see the market down about 17.5% in just 11 trading days.
Whether you utilize this to get on the short side or simply highlight markets to avoid and focus on those areas where we see those predicted moving averages very bullish.
GE Aerospace ($GE)
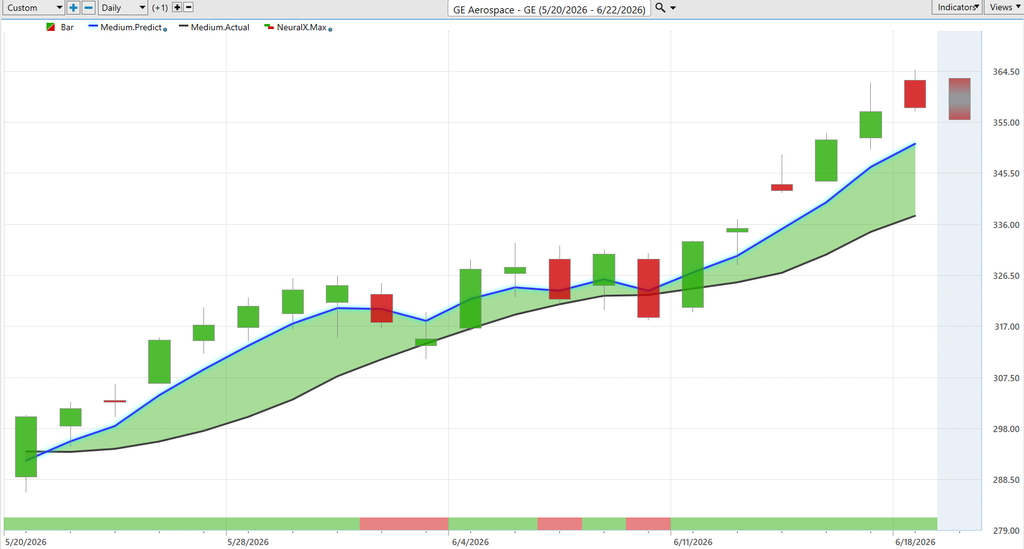
Like we do here in GE Aerospace. Again, another example of the blue line moving above the black line.
You’ll notice the Neural Index goes bearish and we get this sideways price action. We come through this period and you’re getting that conflict of bearishness, bullishness, bearishness, but the overall trend is very much to the bullish side.
You see how these predicted moving averages stay skewed to the bullish side and don’t cross to the bearish side of things.
Again, we get a really nice rally over the course of the last month here. You see about a 21% move over 20 trading days. That’s about a month on the calendar.
Of course, again, we can take a look at how accurate all of those VantagePoint predicted highs and lows have been.
If you’re really anticipating that you want to be a buyer in this market, let me look to accumulate a position down at these predicted lows.
You see really within about 48 hours you’re going to see that market start to trend higher and that uptrend really take hold.
So again, a really nice opportunity in GE Aerospace.
Netflix ($NFLX)
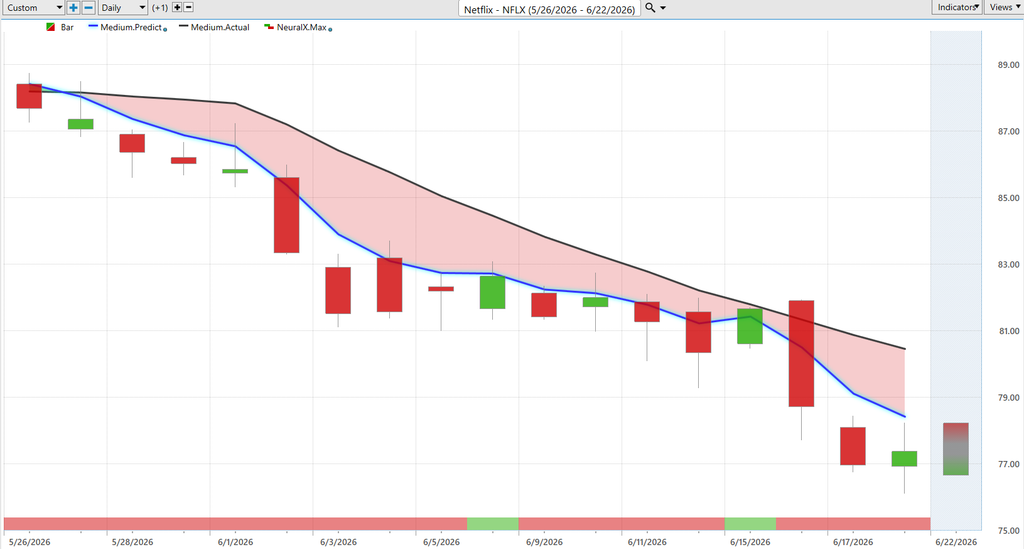
But here in Netflix, we’ve seen some weakness.
This was actually a few months ago a good opportunity to get on the bullish side. We rushed up towards about 1,100 or so, but we’re starting to see more of this weakness.
It says, look, let’s go ahead and get out of the way here and expect the market to continue into this downtrend.
Again, you get these periods where that Neural Index sort of blips up to that bullish configuration, but very clearly the market is bearish.
At a certain point we’ll see these predicted moving averages cross to the bullish side and maybe see a reversal, but very clearly the market is in a downtrend and offering up some very nice intraday predictive levels to short, take profits on shorts, and really exploit this downtrend.
Early on from this predicted low we can see where the market is currently, off about 10% to almost 11% in just the past 14 trading days.
Within those 14 trading days you have these really short-term periods where you move up to the predicted high, quickly move down to the predicted low, and now a 2.5% decline just from those levels of predicted high down to subsequent predicted low.
Again, it happens here. Predicted high, predicted low. Predicted high, predicted low. Predicted high, really moving past that predicted low and continuing on with the downtrend.
Marvell ($MRVL)
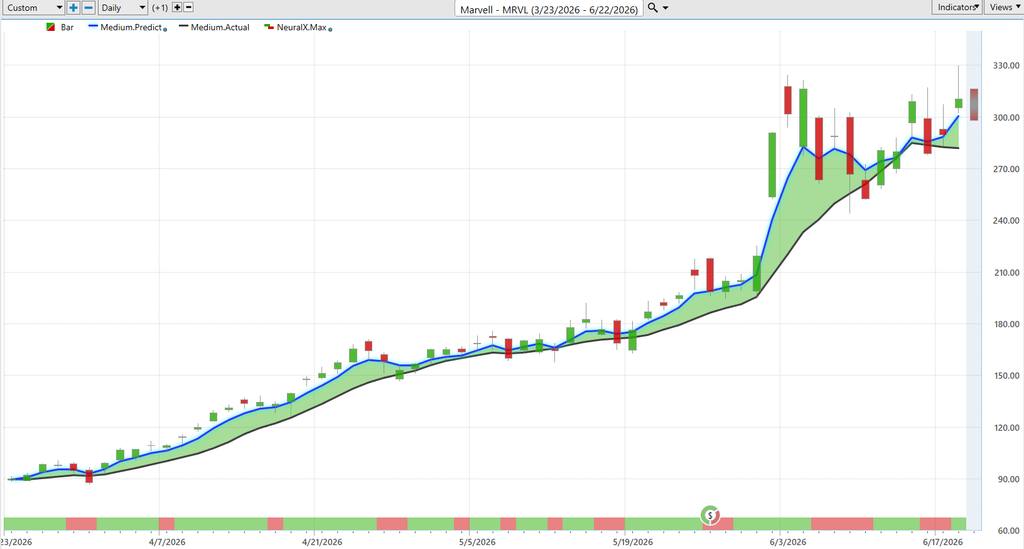
Lastly here, we can end on Marvell.
This is a great situation where we’ve seen a lot of these tech stocks perform extremely well, but this really happened at the beginning of April.
As we move back to the beginning of April, we’ve had an excellent run, really almost getting to the three-month mark here. You see the market just touching up to new highs, barely breaking that previous range.
This is where we tend to see a lot of volatility. But of course, this is really a situation in the tech space that we identified all the way back in April with the QQQs and SPY and the broader market starting to turn higher.
That gives you the clue that says, hey, look towards some of those tech stocks you may want to be a buyer in.
We can look at those predicted highs and lows and really see how this works. Early on in this trend, volatility is somewhat subdued and you see how narrow some of these predicted ranges are to help traders with those daily predicted highs and lows.
As volatility increases, you see how that range expands. So the software does a good job of adapting to those shifting market conditions.
Very clearly here, still in an uptrend.
It’s been about three months as this market has continued to trend higher, about a 233% rally in the past 61 trading days.
So very nice opportunities, not just in Marvell, but numerous opportunities throughout the technology sector are seeing these 100%+ returns, especially around the semiconductor and AI build-out narrative.
So really nice opportunities, but we’ll go ahead and leave it there for today.
Once again, we have no trading here on Friday, so we’ll see how things shape up going into next week on Monday.
But once again, this has been the Hot Stocks Outlook for June 19, 2026.
Thank you all for watching. Best of luck out there, and bye for now.


