


Register for a Free Live Training
The Hot Stocks Outlook uses VantagePoint’s market forecasts that are up to 87.4% accurate, demonstrating how traders can improve their timing and direction. In this week’s video, VantagePoint Software reviews forecasts for SPDR SPY($SPY), Bunge ($BG), CF Industries Holdings ($CF), AMD ($AMD), Eastman Chemical ($EMN), Lowe’s ($LOW), Freeport-McMoran ($FCX)
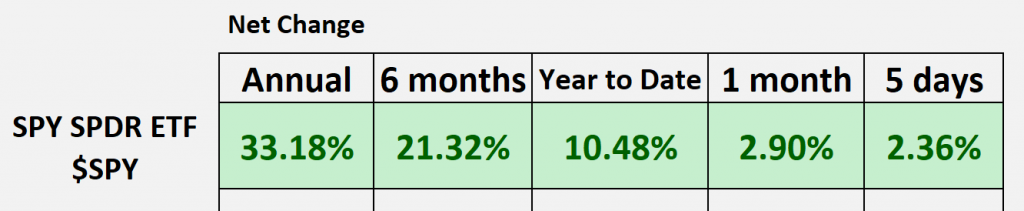
SPDR SPY ETF ($SPY)
Hello again, traders, and welcome back to the Hot Stocks Outlook for March 22nd, 2024. I hope you are having an excellent week out there in the financial markets. As always, we’re going to take a look at the most recent Vantage Point predictive forecast and update some of the ones that we’ve looked at in prior weeks. So, if you haven’t already, make sure you go ahead and click on that link in the description below, and you can sign up to get a live demonstration to learn all the specifics about how this predictive technology of artificial neural networks can help you make much better trading decisions in the marketplace.
Now, as we typically do, we can take a look at the SPDR S&P 500 ETF (SPY) for the S&P 500 and just to get this broad general view of where things are at over some of these given periods of time. And so, we can see that we’ve gotten through the FED announcement that has perked the S&P 500 up higher, and that’s brought us up to about 10 and a half percent year-to-date. So, a very nice move to start the beginning of the year. But let’s go ahead and take a look at some of these predictive forecasts from Vantage Point and highlight how traders can really get ahead of many of these moves.
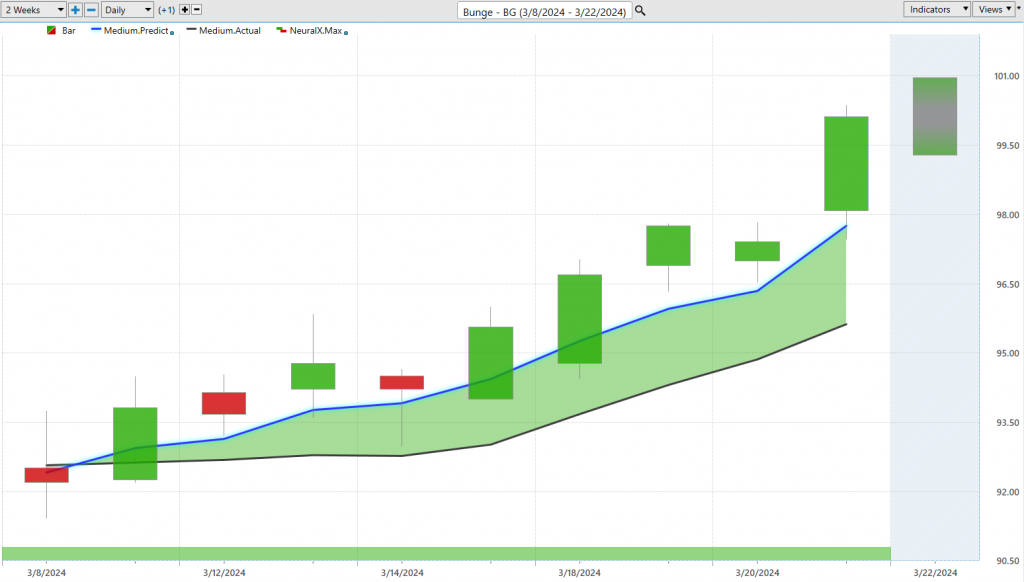
So, what we have here in Bunge (BG) is daily price action. Right, so each one of these candles that you see represents a full and complete trading day, and it’s right up against all that price data. What you’re going to notice is there’s a black line and a blue line value. So, the black line that you see there, that is a simple moving average. This is a very common technical indicator. In this case, it’s actually a 10-period simple moving average. So, it’ll just look back at the previous 10 closes, add those all together, and divide by 10. Really, the problem with indicators and tools like that is that they all really derive all of their information from the past, so they’re lagging and really only let you know where market prices have been. So, we want to use that as a baseline, but what we want to compare that to is this blue value generated by the technology here. And so, to generate this, essentially a prediction of price and plot that against the chart, well, this is where Vantage Point’s technology of artificial neural networks come into play. And they’re performing what we would call intermarket analysis. And what that means, specific to Bunge, there are dozens of markets that are known to drive and influence the future price action. Now, this can be things like individual stocks, this can be things like the SPY, big ETF groups that wrap up a whole grouping of individual stocks, but this goes all the way to the global markets—things like the value of the dollar index, global interest rates, as well as global commodities. So, we can think of, you know, some of grain markets like wheat, soybean, corn, may have some important relationships with shares of Bunge. And so, it’s taking that global approach and then using that information, essentially that being the dataset of all this intermarket data, to generate these highly accurate predictive forecasts. And it’s those predictions of price that are built into these indicators, making them much more robust and accurate. And so, whenever we see this blue line cross above the black line, what’s suggesting average prices are going to start moving higher. And if our trader is, you know, shorter-term, longer-term, well, they can use their tools to position on the bullish side of things. And so, we see here that since that crossover came through, about a 7.7% rally in just nine trading days. But that’s not the entirety of the forecast because shorter-term traders can benefit off of these short-term predictive indicators. So, if we look at the very bottom of the chart, you’ll see this bar that, in this case, it’s staying green, but in subsequent charts, you’ll see it goes from green to red and back to green. And what it’s doing is actually it’s a very accurate short-term forecast for 48 hours ahead. So, we’re using those artificial neural networks, but they’re tuned to solve a different problem here. And that being very short-term strength or weakness, just over the next 48 hours.
Now, lastly, and this is where we look very closely at a lot of these individual opportunities from week to week. Well, we have a predicted high and a predicted low range, and so you can see that we have a shadow candle here because this day hasn’t occurred. So, the market day will trade, and it’ll fill in the price data here. And what we do each week is look back at those predictions and see how accurate these levels are day-to-day. And so, when traders can identify well, there’s something going on in these agriculture stocks, we’ve sort of picked up on that over the past few weeks by identifying a lot of these markets turn to the bullish side via Vantage Points and intelliscan. Well, where might we want to hone in on this opportunity? And you see, as this crossover moves to the bullish side, that neural index stays bullish. You’re offered up these levels as essentially a prediction of the daily low. And so, if you can buy the market or, you know, accept an order near that price, well, that is usually going to be good at getting you a fair price here and getting you involved in the market. And so, we can see that from those levels, you know, we benefit off of this 7% rally. But this is very important, how traders can make these adjustments day-to-day. It’s really one of the great benefits of artificial neural networks is their ability to adapt. So, look at how that market traded the previous day, update those predictive forecasts, and get you back in line with what is most likely to occur here.
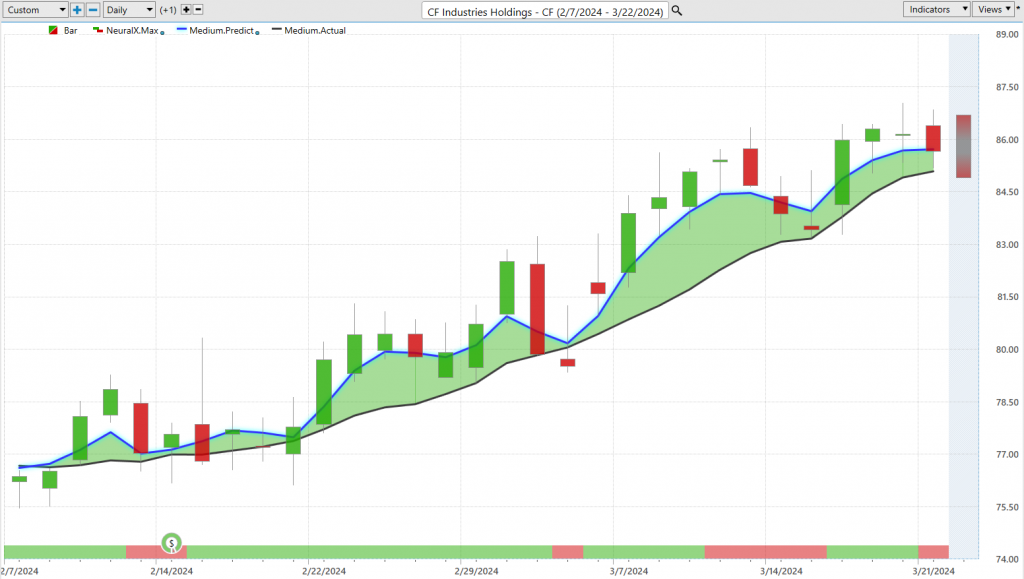
Now, here’s CF Industries Holdings ($CF), and I just wanted to bring this through because it’s similar to Bunge here, and we can see that something’s going on in this market. When we start to see Bunge turn higher, well, it’s about this point on the chart in CF Industries, but CF had a blue line cross above the black line, our predicted moving average, all the way back here at the beginning of February. And that has led to, again, a very strong rally here. And so, we’re seeing particular groupings of stocks do extremely well. You see about a 13% rally over the past 30 trading days. And again, we can look at those predictive highs and lows to accumulate a position. And you see, as this market moves up, we get a little bit of a gap here but does a very good job at guiding the trade forward. And every week, we often look at days like this where, when you get all that bullish price action the previous day, you may just want to watch out for the market moving towards those previous predicted lows before that advance continues here. So, even when you get that froth, software is doing an excellent job at identifying these levels for you. And you see, as we advance a little bit further towards the end of the week.
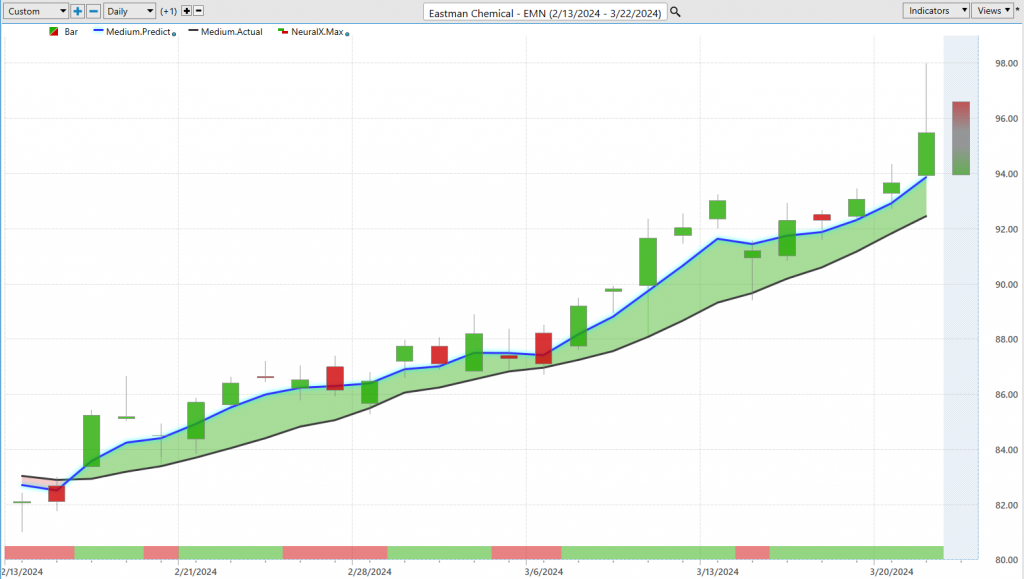
Now, let’s take a look at Eastman Chemical ($EMN) because this is a market that I keep bringing back in week to week, and I think it’s illustrative of how we can update these forecasts. And you know, if we need to stay in the market, great; if you need to adjust your position or add to it, well, this is where these tools are going to be helpful. And so, here we see Eastman Chemical with this blue line crossing above the black line, neural index bullish. And what you’ll notice is there will be these periods where the neural index will go bearish, but remember, it’s just a 48-hour indicator. So, if the overall trend is up, but there’s weakness over the next 48 hours, well, that may actually be a buy-on-the-dip scenario. So, if we look at these predicted highs and lows from Eastman Chemical, well, pretty much since the start of this move, which I think I’ve brought this through three times, you know, before this point here, well, this being the third, well, here you see an entry here, one, two, three, four, five entries into the market, and you see this week just really pinned to the bullish side of these forecasts and sliding up against those predicted highs, but the overall trend here, very much bullish, something that would be very advantageous to have in the portfolio. There’s many of these opportunities were, you know, just like GLD a few weeks ago, you get a nice entry, trail your stops, and just let it ride. You’ve got a really nice position in the portfolio to complement things like Eastman here, up about 14% just over the past 25 trading days.
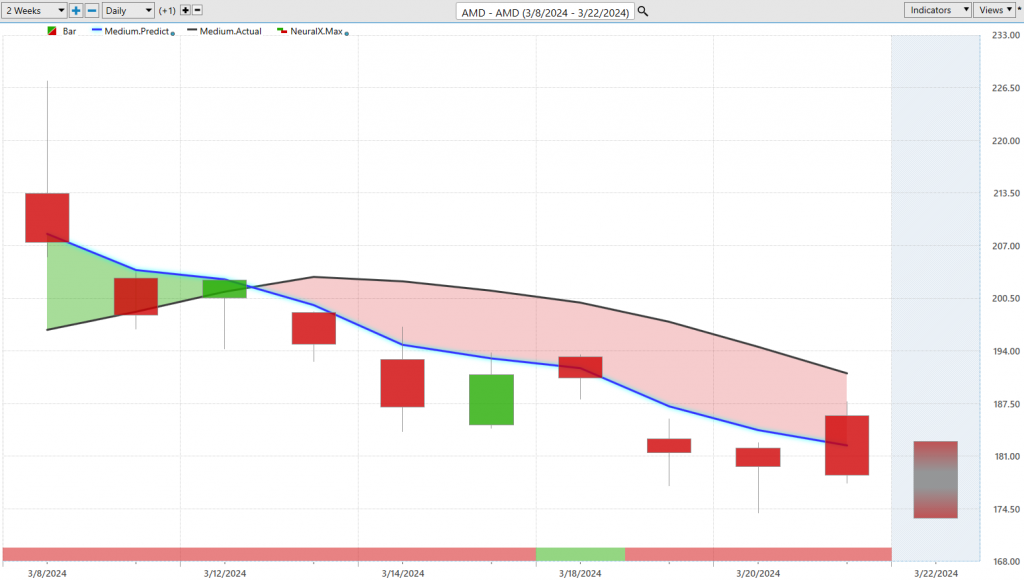
Now, not a whole lot of weakness in the market, but last week, brought through AMD ($AMD), and just again, in the short term, highlighting that look, is this really an area where you want to be trying to exploit the bullish side of the market? Well, no, right? The blue line below the black line. This is Friday of last week when we brought this through, and the last thing you want to be doing is thinking, ‘Hey, AMD is getting bullish here; it’s a bullish market, let’s go ahead and get involved.’ Well, the reality is, you actually want to be shorting from these predicted highs, and you see that the market does decline from there. So again, not a lot of weakness out here in the market, but definitely want to avoid these areas where the Vantage Point predictive forecasts are quite bearish. You know, we looked at 3M a few weeks ago, and you know, huge downtrend until it reversed; now, it’s been a fantastic opportunity to the bullish side. So again, down 10% here in just the past seven trading days, we’re going to have to see if we see some of these indicators reversed, but right now, very bearish.
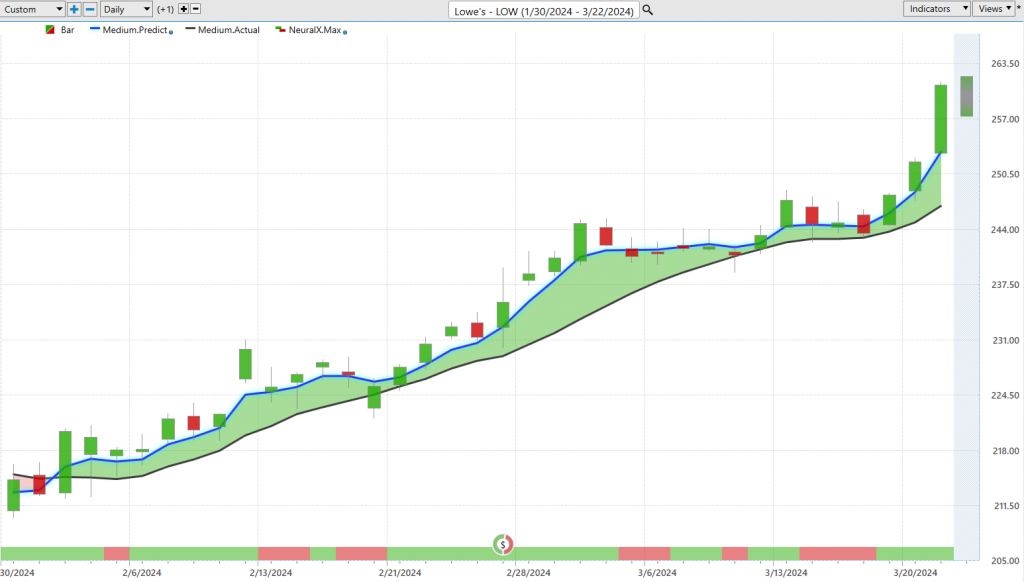
Here’s Lowe’s ($LOW), so part of the retail side doing very, very well. Blue line crossing above the black line again. These little blips where the neural index will run sideways, and you’ll get these consolidation phases in the market, but that blue line is going to skew and stay on the bullish side of things, allowing traders to understand, ‘Okay, maintain that long position or maybe your call options or whatever your style is,’ but and maybe add to it, right? So, we have these predicted levels here. Again, you see all this froth, and that’s where you can expect these sorts of days like this, but this is what I mean by this, you know, adaptive technology here is, even when we get a little bit of a wild couple of days here, right, maybe driven by some news or some sort of catalyst in the market, well, look how quickly the software goes, ‘Okay, let’s go ahead and get these predictive forecasts back on track. Look at those in market relationships, you know, not only what’s happening in Lowe’s but what’s happening in those, you know, up to 30 other markets that are known to drive and influence and understand where things are likely to trade next.’ And so, you see how quickly these, you know, predict high and low ranges get back on track, and we’re back to rolling, offering up some very advantageous levels to add to the position and exploit this opportunity to the bullish side here. So, just a really tremendous move here in shares of Lowe’s, but this has been obviously a market that’s been very bullish since February. So, if you want to do some trading, well, take a piece of this 21% move over the past 35 trading days.
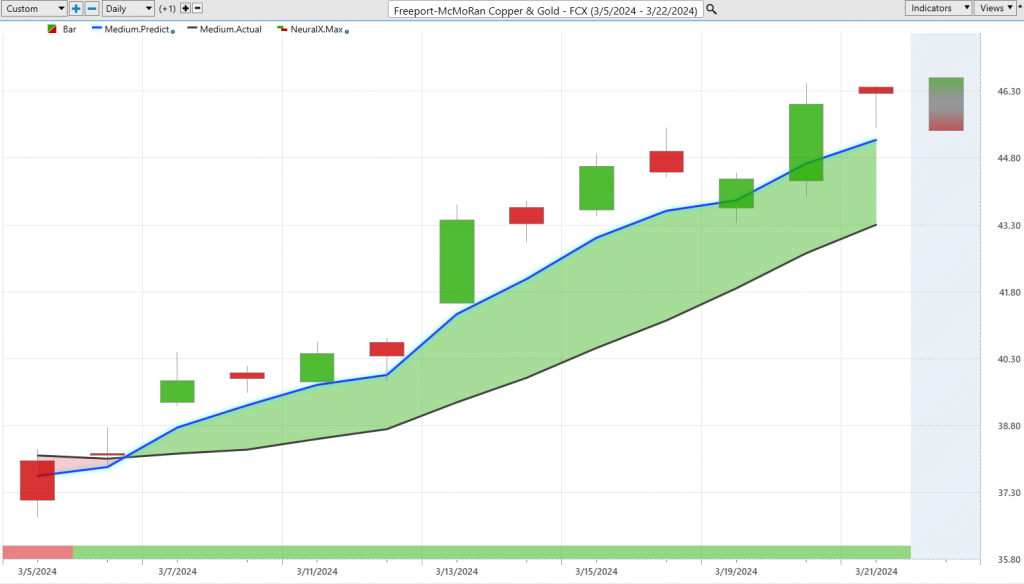
Lastly, here we’ll take a look at Freeport-McMoRan and Gold ($FCX). So, we talked about the gold market, copper, some of these markets are very interesting, and we’re seeing a lot of movement, especially in the basic material space. And so here, you see with Freeport, understanding that, ‘Hey, Gold’s ripping,’ here we got Freeport with a blue line crossing above the black line, and look at this neural index over the past, you know, 10 or 12 trading days here, not even a sign of any weakness, and the market has kept moving higher and higher. So again, we can say, ‘Okay, well, we’ve got those predicted highs and lows; where do we want to be scooping up shares?’ And you know, stuff like this here is pretty beautiful, where you gap down, you’re going to get filled at the open if you have a limit order there, and you’re pretty quickly off to the races there. So, really nice move here, and you know, when you look at the sector as a whole, right, you look at the basic material stocks, you look at, you know, a lot of these energy stocks, we looked at Exxon and some of these markets last week, something’s going on here, and really nice positions to have in the portfolio. So, you see here about a 17, was 18% move in the past 11 trading days. So, really nice opportunities opening up in many different areas throughout the markets, and a really great time to be involved in equities.
So, I’ll leave it there. Have a great rest of your trading week. Once again, this has been the Hot Stocks Outlook for March 22nd, 2024. Thanks again, and bye for now.


