


Register for a Free Live Training
The Hot Stocks Outlook uses VantagePoint’s market forecasts that are up to 87.4% accurate, demonstrating how traders can improve their timing and direction. In this week’s video, VantagePoint Software reviews forecasts for SPDR SPY($SPY), Duke Energy ($DUK), Alliant Energy ($LNT), Trip Advisor ($TRIP), Pacira Pharmaceuticals($PCRX), Global Foundries ($GFS)
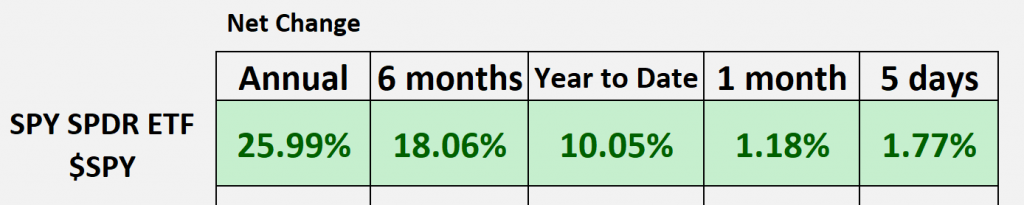
SPDR SPY ETF ($SPY)
Hello again, traders, and welcome back to the Hot Stocks Outlook for May 10th, 2024. I hope you all are having an excellent week out there in the financial markets. As always, we’ve got plenty to cover here in this week’s Hot Stocks Outlook. If you have not already, make sure you go ahead and click on that link in the description below. You can get yourself signed up for a live demonstration so you can learn all the specifics about how this technology can help you make much better trading decisions in the marketplace.
Now, as we typically do, we take a look at the broader indices via the SPY ETF, and so what we can see is we started to edge higher really since last week, and so that sent our year-to-date number up to about 10%. And we really want to be careful right because we’ve actually seen some stocks do well, some things do poorly. This is why it’s especially important to have the right tools to position yourself accordingly here.
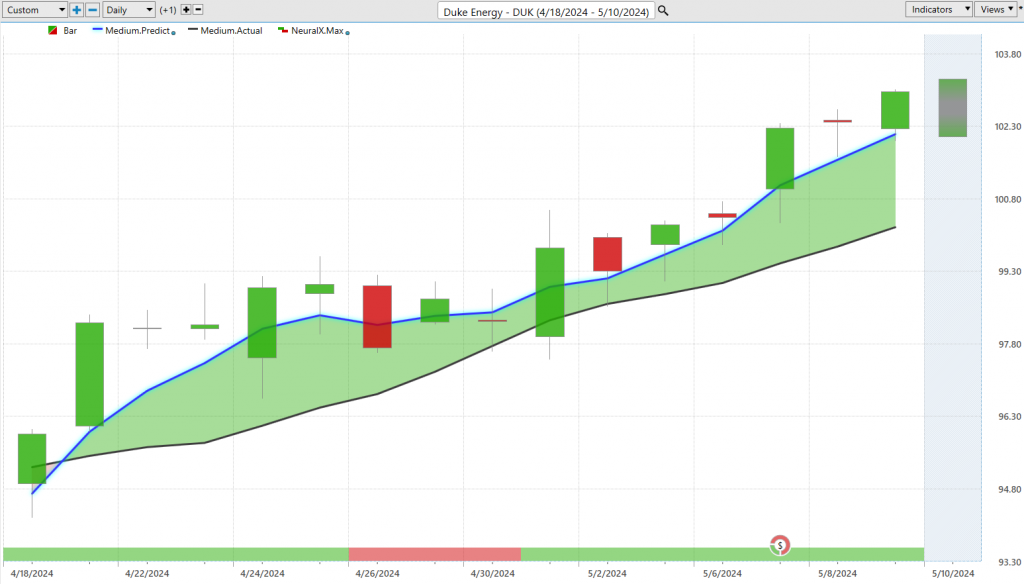
So, I wanted to actually start out with a couple of utility stocks because Duke Energy here is a good example of a stock we actually looked at two full weeks ago. So right when the market was really way back here as far as the price action, and that’s because we started to see strength come into utilities actually during a time where we didn’t see much strength in other areas of the markets. Last week, I talked about some of the biotech, some of the smaller cap stocks actually turning up and doing well, but before then, it was like, okay, well we got utilities, we’ll see what else starts to come through.
And so this is a really good example of how all these tools work together. And so here with Duke Energy, what we have is daily price action. So each one of these candles that you’re seeing is representing a full and complete trading day, and it’s right up against that price data. The first thing you’ll notice is a black line and a blue line value. The black line that you’re seeing there, that is a simple moving average; in this case, it’s a 10-period simple moving average. So, what it does is it just takes the last 10 closed prices, it’ll add those all together and divide by 10.
Really, the weakness with technical analysis tools like this is that, for one, all of the data to generate that simple moving average comes from the past; it’s already occurred. The other problem is it only looks at one market information, meaning it doesn’t really accommodate for how other markets are driving and influencing the future price of Duke; it’s really just summarizing what already occurred in Duke Energy.
And so, what we’re able to do is compare that black lagging moving average to this proprietary predicted moving average. And for this number to get calculated and plotted, essentially, it’s a price to get plotted every evening. Well, this is where that technology of artificial neural networks is coming into play. In this instance, what they’re going to do is, as those intermarket relationships, whether they individual stocks or ETF groups or things like the oil market or global interest rates, well as those markets push against essentially, you know, having a bullish or bearish effect on the future price of Duke, what’s going to summarize all of that and start to skew these indicators. So whenever we see that blue line, in this case, cross above the black line, well, it’s suggesting average prices are going to start moving to the bullish side. And this is what makes this very helpful when you’re trying to figure out, okay, well, where is their strength in the market? Well, we can use features like Vantage Points and telescan to identify a lot of these bullish crossovers as these predicted moving averages start to move above the actual moving averages across the utility space.
And so this is what gets that attention in the area. But of course, you know, you need to manage trades right. If something’s doing well, you want to add to that position; maybe you need to take some profits along the way. So, this is where other Vantage Point tools, you see this bar at the bottom of the chart that goes from green to red back to green. Well, this is Vantage Point’s neural index, and it’s designed to be a two-day outlook of strength or weakness in the market, and we’re also given the Vantage Point predicted high and low, which now we’re down to intraday essentially a predicted range of where the market’s likely to trade.
So Duke‘s a really great example of this, of where we see our predicted moving average cross above our neural index, we see in this case it gets bearish as we get really some sideways price action over the subsequent 48-hour periods. But as that neural index gets bullish, we get that momentum coming in, and
this has been again a really nice area in the market to take advantage of the bullish side, especially since it’s already been a few weeks here where we’ve seen again sort of a choppy market, and we’re seeing this area advance about 7% in the past 15 trading days.
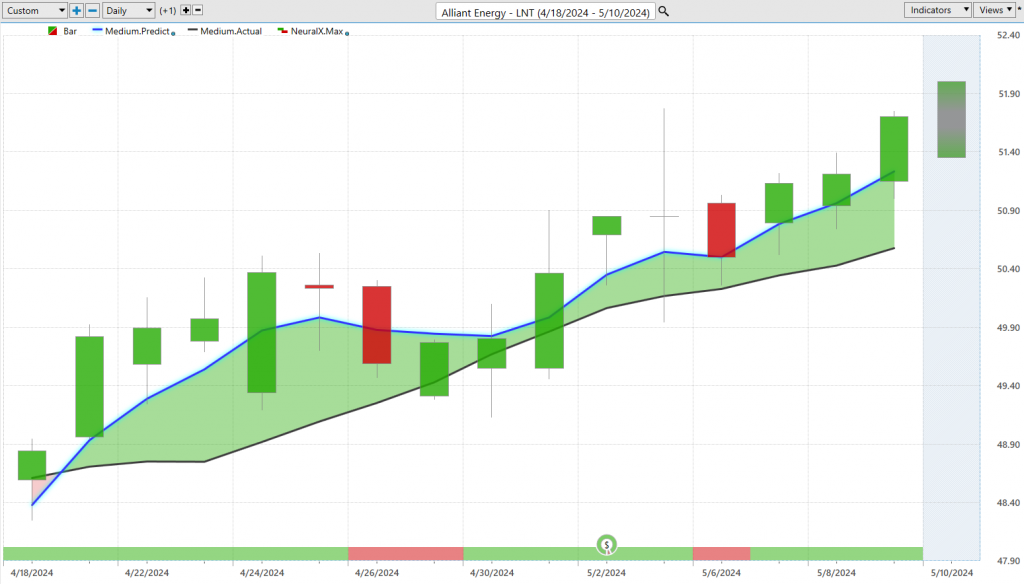
Another example here in Alliant Energy, so another energy stock, but rather, but seeing what’s going on broadly and then utilizing the short-term forecasting to take advantage of the opportunity. So here again, recognizing that hey, there’s strength in utilities, let’s go ahead and use Vantage Point’s predicted ranges like the predicted highs and lows to take advantage of this opportunity. So you see here, there’s about a one and a half percent move, another about a one and a half percent move. So you’re not going to get huge moves on these utility stocks on a daily basis, but this is sort of the point to highlight that look, regardless of how much volatility is in the market, you need to recognize a few things. One is what is the overall trend direction, where is there a sector where there’s that strength, what’s going on in the short term, is there that momentum, and where’s a good price level to get involved? And this is where these levels, every single day, are updating and adjusting for the trader, so that as this market starts to trend and move, well, you’ve got those updated and adjusting levels that you can accommodate with. So as the market, you know, earlier is trading down at 49.50, well, as we get into this week, you need to understand that these are actually better levels, you know, intra-week, in this case, to go ahead and get involved, and target those short-term price targets.
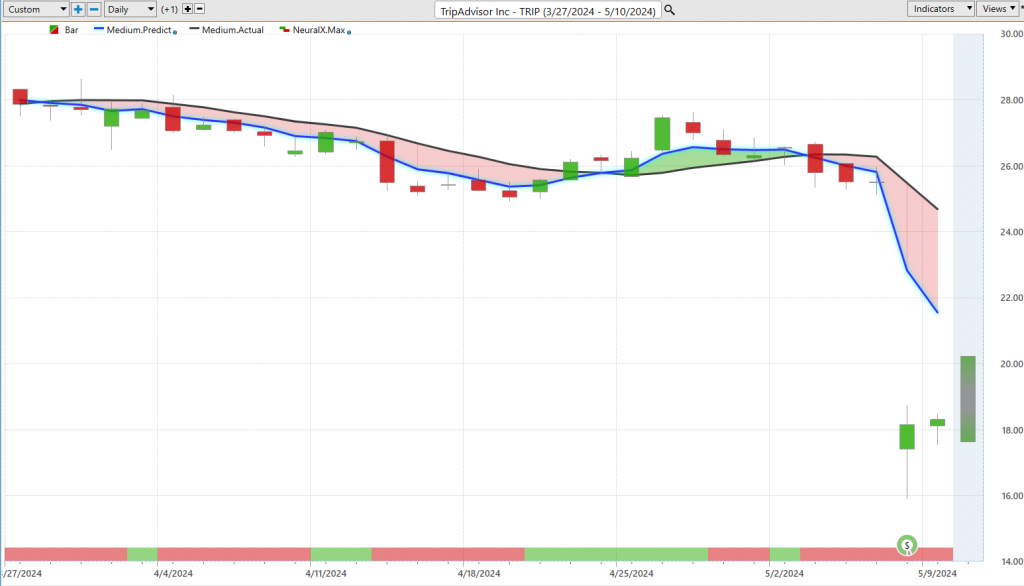
Let’s go ahead and look at Trip Advisor because this was another one of these opportunities where we had highlighted that there’s a lot of weakness in Trip Advisor. Right, this is not a stock that we’d want to participate on the bullish side, and so again another good example of how all of these predictive indicators work together. So here you see that we get this crossover to the downside early on, and this is where we originally highlighted this to get some really nice entries up here at $28 per share. Short take profits on shorts as we go through this really choppy period in the market.
And so you see here as prices really run sideways for about 3 weeks, you do get this situation where the blank crosses back above the black line. You see the neural index bullish here as you get these subsequent bullish price action over these 48-hour periods. But going into earnings, what do we see? Well, that blue line crossing back below the black line, neural index very bullish, and understanding that, look, we understand utilities are bullish, we understand biotech, and even some smaller cap stocks are quite bullish. But this is an area where we know there’s a lot of danger, and as things shift to the downside, well, you can take those profits from shorting earlier and say, okay, well, we can run a stop, see what we get here. And here we have the market doing very poorly, here about a 30% decline in the past four days through earnings there.
So again, what I encourage traders to do is go back and watch some of these previous hot stocks outlooks because we cover Duke Energy, we covered the utilities, we covered Trip Advisor, and last week we covered some of the biotech stocks.
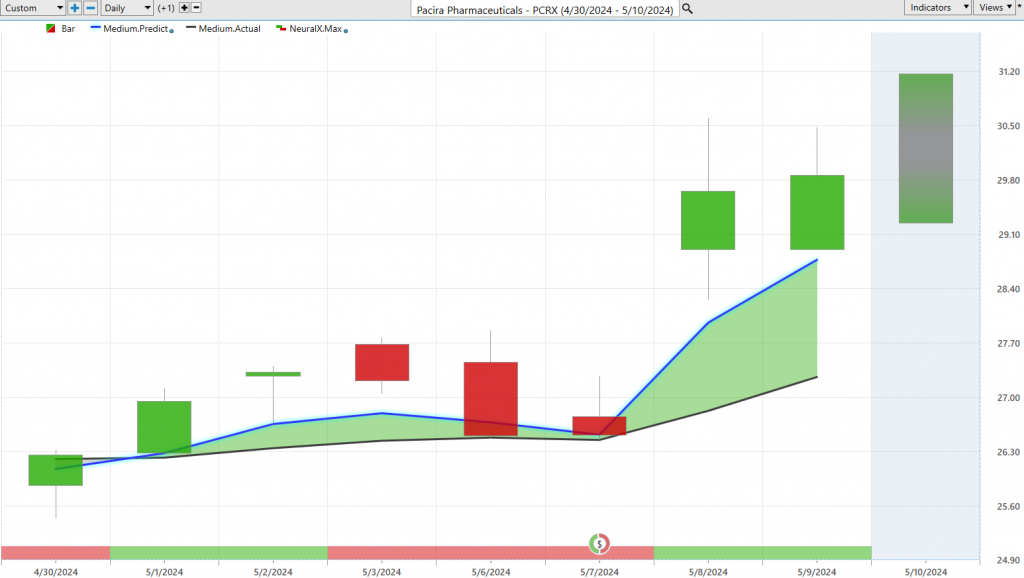
So here in PCRX, again another good example of identifying that well, last week we really saw a lot of this strength start to come into the area as a whole. And this is very peculiar because again, we had so much weakness. So to see some of the biotech and smaller cap stocks do well, I was like, okay, well sure, you know, if that’s leading the way here.
But here we see PCRX, we get that blue line crossing above the black line, and here you see those predicted highs and lows. So you see how well this works, and we see this quite a bit where you see how this previous predicted low, all the price action really not much happens, just sort of waddle around throughout the day, but it needs to move down towards those predicted lows, find that support, we move up against a predicted high, and then you know that move around earnings. And seeing that catalyst as the market continues higher here.
So again, we’ve seen a lot of earnings report, so you’re going to see this sort of, you know, gaps and moves on the chart. And that’s why things like utilities, where we’re kind of through some of that earnings, much more smooth price action where you do some short-term day trading. Here you see about a 133% rally just in the past seven trading days. Again, seeing a lot of that strength coming in throughout the biotech space.
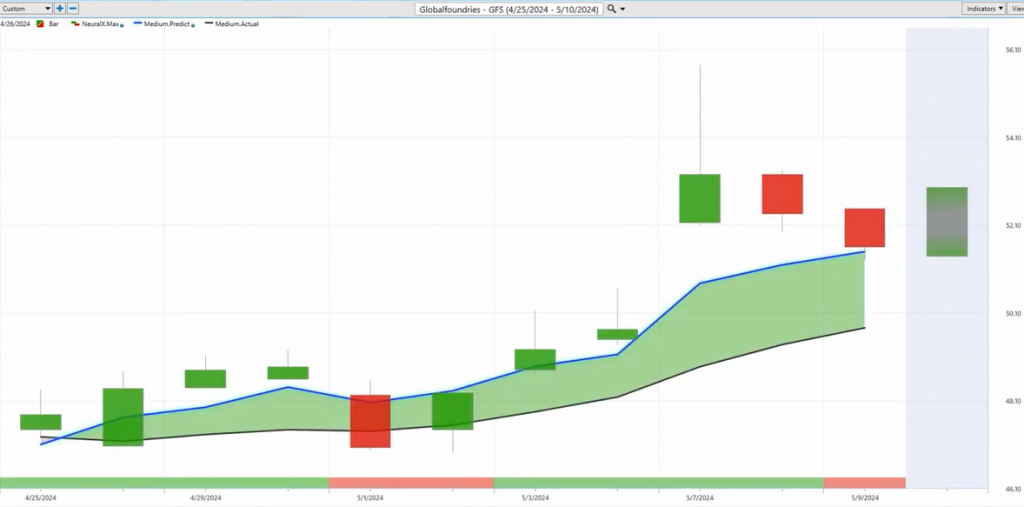
Lastly, here’s Global Foundries, and again, this is another one of these smaller stocks here. Most people don’t pay attention to most people are looking at Nvidia and some of these more exciting stocks, but there’s a really great example of how all these predictive indicators work together. So we get this blue line crossing above the black line, the overall trend is up, and this is what’s really exciting about this. You see how all the price action on these two trading days takes place on the bullish side. Right, there’s really no selling, the market just moves higher, trades bullishly for the day, and really maintains those price levels.
But look down at these predicted lows, so these are at about 47.20 or so, saying okay, well look for the market to come down into these levels would be a really, you know, much better place to go ahead and get involved. And sure enough, we move right down into that predicted low and immediately start to see the market advance even more. Recently, you see with all this volatility how well the market does is picking out some of those predicted high and predicted low values.
So again, really nice opportunity here, especially from these predicted lows that have come through. I mean, you’re looking at, you know, just in the past week here, an 18-15% rally through earnings there. So really ample opportunities to get on the right side of the market, whether it’s in utilities, here you know on the short side, there are some opportunities, we got biotech things moving higher through earnings. There’s ample opportunity, but of course, you want to fine-tune in the short term where you’re accepting prices, what areas of the market you’re
looking towards, and this is where all of these predictive tools are really fine-tuned to help traders solve some of these problems.
So if you’re looking for new opportunities on a sector basis trading, we can use these Vantage Point predictive indicators to really fine-tune and highlight the best places to execute those trading strategies.
So I’ll go ahead and leave it there for today. Once again, this has been our Hot Stocks Outlook for May 10th, 2024. Thank you all for watching, best of luck, and bye for now.


