Register for a Free Live Training
The Hot Stocks Outlook uses VantagePoint’s market forecasts that are up to 87.4% accurate, demonstrating how traders can improve their timing and direction. In this week’s video, VantagePoint Software reviews forecasts for AMC ($AMC), TakeTwo Interactive ($TTWO), SPLUNK ($SPLK), New York Times ($NYT), and Lululemon ($LULU).
Hello again, traders and welcome back to the Hot Stocks Outlook for May 13th, 2022. I hope y’all are having an excellent week out there in the financial markets and like always, plenty to cover here in today’s outlook. Now we’re going to start out with shares of AMC and actually going to give you a little peak under the hood of the VantagePoint software here with this stock. We’ll also look at Take-Two Interactive, Splunk, New York Times and lastly, Lululemon.
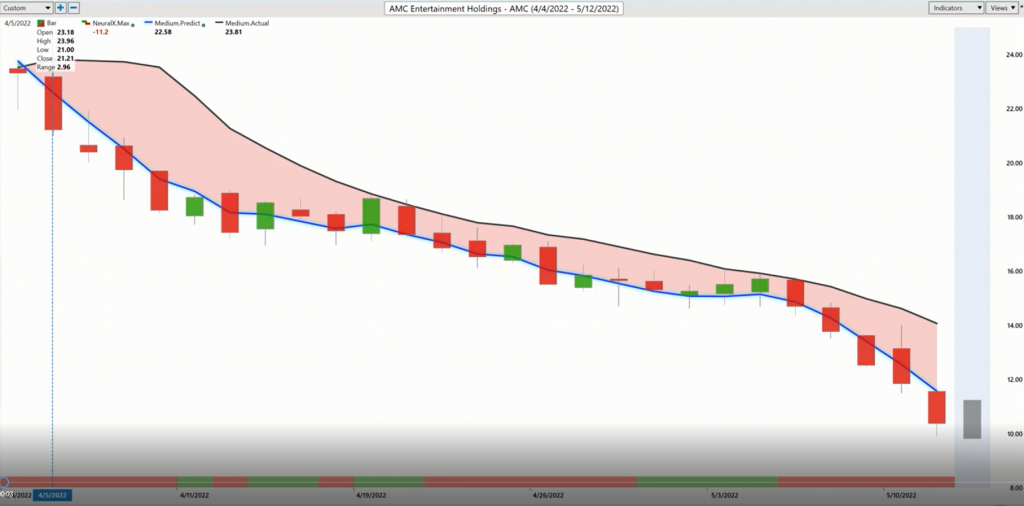
So let’s start out like we typically do, explain all the indicators here on the chart and how this all works. But what we have here with AMC Holdings is daily price action. So each one of those candles that you’re seeing right up against the chart represents a full and complete trading day. And right up against all that price data, you’ll notice that there is a black line and also a blue line right up against the chart.
Now the black line that you’re seeing there is a simple moving average. So it’s a very common technical indicator. And in this particular case, what it’s doing is looking back over the previous 10 closed prices, it adds those all together and divides by 10. And so that’s a good measure of where market prices have been over a given period of time. And it helps with smoothing out the existing price action, but traders certainly need to be ahead of the next move.
And so what we’re able to do is actually compare that simple moving average or that lagging indicator to this blue line. And for that, what we call the predicted moving average for that value to get calculated and generated and thus plotted against the chart every evening. This is where VantagePoint’s technology of artificial neural networks are performing what’s called intermarket analysis and understanding how other markets are driving and influencing the future price here of AMC.
Now here’s where things get interesting. So if I go over here and we can look at some of these markets and if I open up AMC, we can actually look at what are those intermarket relationships that the technology is picking up on? And what it’s able to do is understand whether it’s futures markets like the Dollar Index or crude oil prices. We’ve seen markets obviously ruled by crude oil over the past few months. The Dollar Index has really started moving higher and it’s pushed down shares.
Well, that has implications all over the market, but specifically to AMC it may have other nuances. So here you see shares of Bed Bath & Beyond, which we looked at last week, also shares of GameStop. These are sort of these meme stocks that have emerged over the past couple of years. And so it’s these types of relationships that can give clues to future price action. And so what’s happening here is a software is taking into account all of these intermarket relationships and how they affect the target market AMC and it’s utilizing that information to actually generate future price predictions.
So prices that have not yet occurred and it’s using those predictions and actually using the values and working them into these indicators. So rather than having lagging tools that are just going to react to what’s already occurred in the market, you have a forward-looking predictive tool that’s actually going to look forward and anticipate where prices are headed next with an extremely high level of accuracy. And that’s where the edge of artificial neural networks come in. They can take in huge amounts of data, make very accurate predictions, and they’re not going to make computational mistakes here.
So what we have here is whenever we have that blue line crossing below the black line, it suggests average prices are going to start moving, in this case, lower because it’s moving below the black line. And that would suggest average prices are going to start moving down. Now that is one part of this neural network calculation calculating those future average prices. We see here since that crossover move to the downside, you’ve got a 55% move lower. So this is very, very important to understand when these big important market shifts happen, but it’s not just here in AMC, it’s not just in GameStop stock. It’s not just in Bed Bath & Beyond. This is affecting everything. And especially affecting these markets where many of those factors really weighing things lower.
Now with that neural network calculation that’s forecasting those future prices, they can utilize this tool and actually build it into other indicators to solve other problems for the trader. So if you look at the very bottom of the chart, you’ll see this bar that goes from green to red and back to green, and this gets updated every single trading day. And it’s always looking ahead just 48 hours at a time. So it’s looking for short-term strength or weakness in the market. And it gets this right with an extremely high level of accuracy.
And so when you understand in the short-term whether there’s likely to be strength or weakness and you have the overall trend direction, well, we can start utilizing this information to help us. And you see that the overall trend is certainly down, the blue line well below that black line. But you’ll notice that when the neural index gets bullish and gets that green signal, you actually do get the market leveling out for a little bit. But the overall trend is still very much to the downside.
So you may see that strength of those subsequent 48-hour periods, but you want to maintain your overall position and understand that this is actually a good opportunity to look too short on rallies. And so to help you with maybe doing some of that sometimes is, well, we actually have a predicted high and a predicted low, so intraday price levels that are generated before each and every trading day. So you have the overall trend direction, short-term strength or weakness in the market, predicted high, predicted low. You’ve really got all your analysis taken care of and this can really help you understand, “Okay, well, if I’m trying to short off of some of these short-term rallies, where might I want to look for those price levels to actually get that position on?” And you just see how effective this has been.
We do this every single week, just highlighting the overall trends, the predicted highs and lows updating those forecasts. New York Times we looked at last week and we just keep rolling this forward to help traders understand that there’s tools out there that can really help you understand the bigger shifts in the market. And certainly in a period like this, not be very surprised to see what’s going on in the global marketplace. And we have shares down again, 55% here in AMC, not very dissimilar to GameStop and Bed Bath & Beyond.
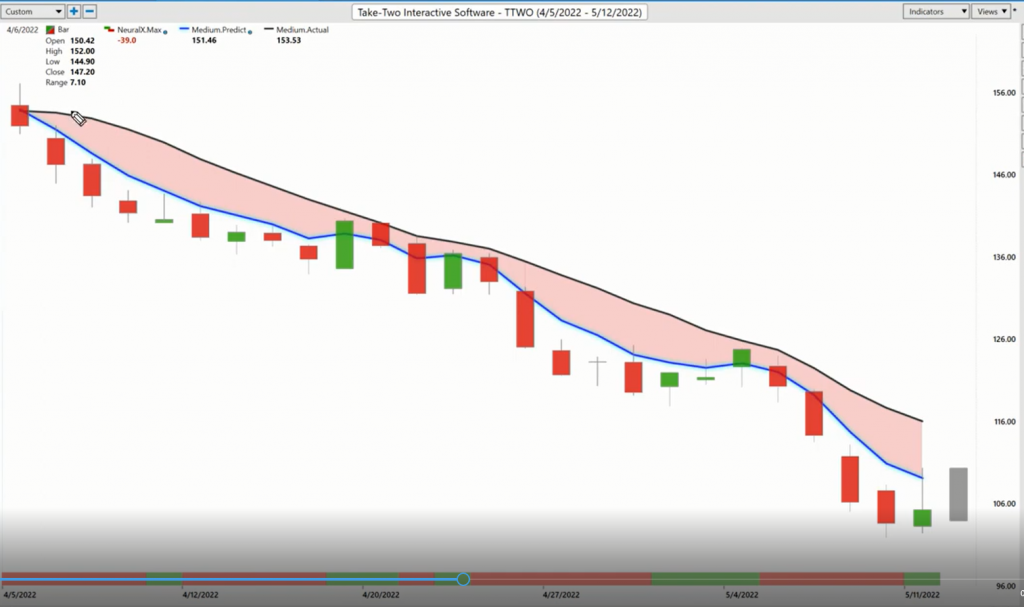
Now here’s Take-Two Interactive. Indicative of the entire tech space, the NASDAQ, we saw these shares in the NASDAQ index start moving lower. And here again, you see that blue line crossing below the black line? It’s hard to find an area where the blue line isn’t below the black line and use the exact same approach. But what I wanted to highlight here is that these tools are trying to find these buyers and sellers in the market. And you’ll see we look at this every once in a while where you have this day where all the price action takes place towards this predicted low. And you see the very next day it shoots up towards that previous predicted high and the overall trend is still moving lower here.
And you just see the software doing a very good job at picking up on these very short-term levels. So that you’re really aware of where to take positions, where to make adjustments potentially to those positions, where to add to markets. So when you get that trend and things are moving and things keep accelerating, well, you can use unrealized gains to potentially build a larger position to make even more money. So here we have a 30% decline in shares of Take-Two Interactive.
Well, let’s look at another tech stock here shares of Splunk.
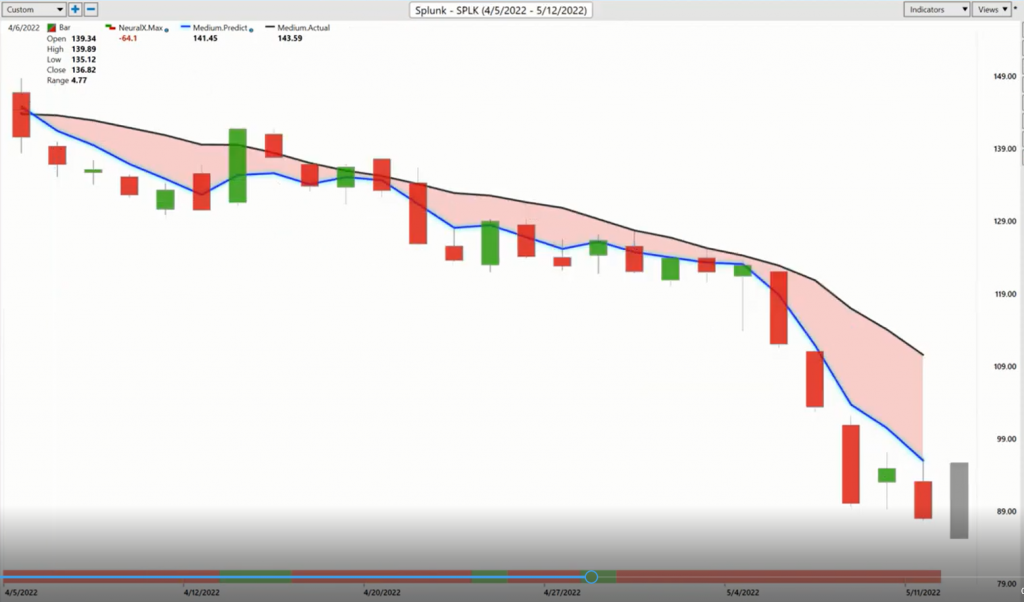
And this has just been the issue where if we look at the Hot Stocks Outlooks over the past several weeks, you’ll see this very big shift from, “Okay, yeah, there may be some bullishness and bearishness out there too. We’ve got some serious problems out there.” It’s very hard to find any strength in the market and the portfolio needs to adjust. So here in shares of Splunk, we see that crossover to the downside.
I mean, you got about four days out of dozens here where that neural index is even bullish. So again, it’s speaking to that very high level of accuracy that it’s going to get it right more times than not. And if you gear your action to those indicators, you can start getting some of that accuracy for yourself. So here you see you get one day where you’re coming out of the area here, pretty good, but it’s good the software is adapting and saying, “Okay, what happened there? Where’s the close? What happened in those intermarket relationships? And let’s get these forecasts back on tracks that the trader can make the best trading decisions in this type of trading environment.”
So there we have shares of Splunk and the charts aren’t going to look very dissimilar here. And this is so important as to, well, what’s going on? Those big markets are having big rippling effects through everything, the Dollar Index, crude oil prices, the S&P 500, all of this stuff is moving around and it’s creating volatility, but it’s creating tremendously profitable trading opportunities. So you see a 36% decline here in shares of Splunk.
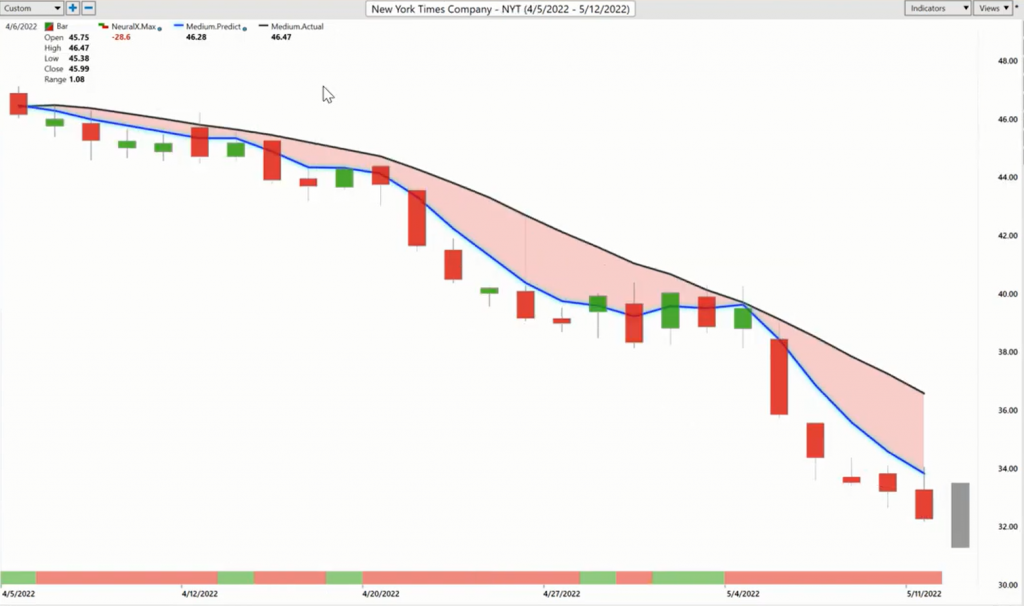
Move over to the New York Times. There’s a lot of earnings reports and things coming out, but this is just last week we looked at this stock and you see that, yeah, the neural index gets bullish. You get this sideways price action for a few days, but is the blue line above the black line? No.
And not only that, but you see before this neural index going back to bearish and the market continuing its decline lower. But when you recognize these shifts in the market and you’re able to take short positions up here potentially at 45, 46 a share, well, you can add to those positions and manage the opportunity that doesn’t appear to be over. Until that blue line crosses above the black line, until we see a big shift with the help of our IntelliScan feature, there’s no reason to assume that anything’s going to shift here.
And so again, you see these repeated predicted high levels doing an excellent job of guiding the trader. And now we see just so many of these markets really accelerating to the downside, but you got to get those positions on ahead of time so you can benefit when that volatility really kicks into things and ripples through all this. So there you have New York Times, we can again, take a look at this and you just see how dreadful a lot of this stuff looks as far as the forecast. Again, a 30% decline.
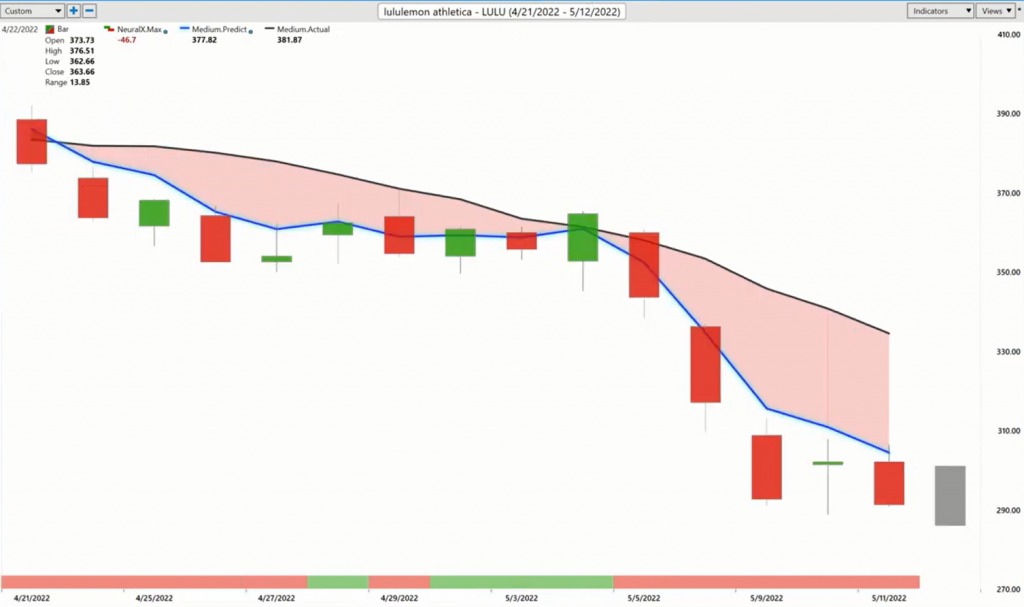
Here’s Lululemon. And this was actually a bullish opportunity at the end of February. So this was a great stock to buy in February, March, we had these big uptrends, but we saw actually all those stocks that started to do good through the month of March actually start to turn lower. And so here you see Lululemon, this crossover the downside and you just see fewer and fewer names holding on here as far as strength in the marketplace. So that neural index goes bullish and you get this sideways price action, but is that sideways price action and opportunity to buy? Is the market leveling out? Well, no.
VantagePoint software will say, “Look, well, try to short up at these predicted highs and benefit as this last week of volatility has really accelerated in things.” But we just see again a dollar that’s extremely persistent and now up above 104 and it’s pushing down shares. And it just creates this very binary sort of world where you’re either getting it right or you’re not. There’s not very much diversification out there. You need to be on the short side of the market if you’re trading shares if you really want to be making a lot of money here.
So again, shares off 22% already just in the past 14 trading days there in shares of Lululemon. So we’ll go ahead and break it there. But once again, this has been our Hot Stocks Outlook for May 13th, 2022. Thank you all for watching, best of luck and bye for now.