


Register for a Free Live Training
The Hot Stocks Outlook uses VantagePoint’s market forecasts that are up to 87.4% accurate, demonstrating how traders can improve their timing and direction. In this week’s video, VantagePoint Software reviews forecasts for SPDR SPY($SPY), QUEST ($DGX), Royal Caribbean Cruises Ltd. ($RCL), Texas Roadhouse ($TXRH), KB Homes ($KBH) and Nucor ($NUE),
SPDR SPY ETF ($SPY)
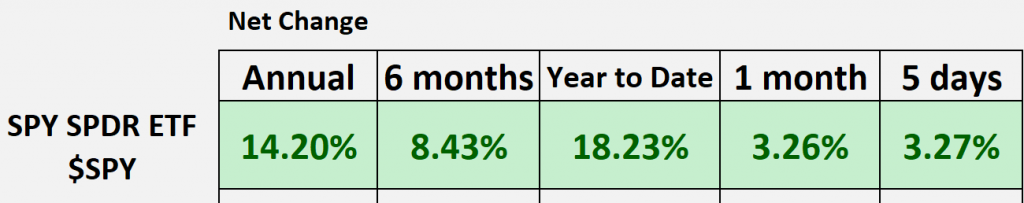
Hello again, Traders, and welcome back to the Hot Stocks Outlook for November 17th, 2023. I hope you all are having an excellent week out there in the financial markets. Really exciting things going on in the financial markets, so let’s go ahead and get caught up here. But if you haven’t already, go ahead and make sure you click on the link in the description below, and you can get a live demonstration, learn all of the specifics about how this technology can help you solve problems in the market, really make better trading decisions out there. So let’s go ahead and, as we typically do, we want to take a look at where has the broader Market been via the S&P 500 ETF here. And so we can see that year to date, we got that number perked up again, getting close to that 20% mark. And that’s because we’ve seen a lot of strength recently. And so we can see that very clearly when we just look at Vantage Point’s SPY forecast.
And so I want to use this as a template for us to explore some of these other opportunities and for Traders to understand how to utilize these set of predictive indicators, essentially the suite of tools to help you make those better trading decisions.
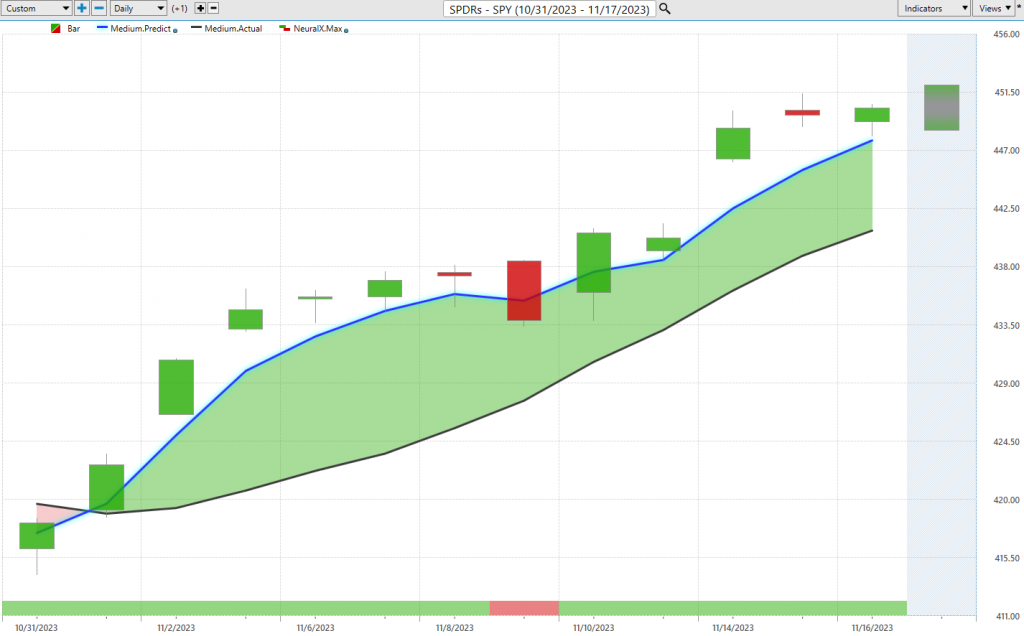
So here we have the SPY, and every week what we do is really just look back at the daily price action. Right up against that price action, what we have is our black line and our blue line value.
Now, what that black line value that you see on the chart is, that’s a simple moving average. It’s a very common technical indicator, and what we really use it for within Vantage Point is to act as a baseline, right? To let us know where market prices have really already been. It’s more of a rearward-looking tool, and that’s really the problem with traditional technical analysis is all the data that generates those indicators comes from the past, and so it’s always lagging behind what’s already occurred. And so what we want to do is actually compare that black lagging moving average to this proprietary predicted moving average, it’s blue line value.
And for that number or price, if you want to think about it, to get plotted on the chart every evening, well, this is where that artificial intelligence is coming in. Those neural networks are doing what we would call inter-market analysis. And so what that means is that there are known markets that drive and influence the S&P 500 futures. Now, if we want to think very broadly, these are things like the value of the Dollar Index, these big macro markets, things like the other indices like the NASDAQ, things like the DAX over in Europe.
But you’ve also got things like big important stocks. We’ve seen Microsoft doing really well. Well, that typically has a strong correlation with the SPY. And so this goes all the way down the road into different ETF groups, again, different individual stocks, different currencies like the Euro. And it’s taking this really global approach and saying, “Okay, well, how does this on an individual basis affect future prices of the SPY ETF?” And so whenever that blue line, in this case, crosses above the black line, it’s essentially predicting that average prices are expected to move higher. So we can say that, okay, we’re expecting prices to go up, essentially the prediction of the overall trend.
We can see that well, the market’s up about 7%, and we had these forecasts come in really the first day of November. We really have a lot of clues to see this strength coming in here. But what’s also important is every week, we take a look at our predicted neural index at the bottom, and I wanted to use the SPY this week really as an example of how this works. You can understand this as we look at subsequent charts of how to think about this with your time frame and what sort of trading that you do here.
But you’ll notice that once that blue line crosses above the black line, we really only get one day where that neural index is bearish. Now, I would argue that it’s incorrect there, but it’s correct about 13 other days. And so this is where this predicted neural index, it’s forecasting short-term strength over just a 48-hour period, and it gets that right with an extremely high level of accuracy, upward of 86-87%. This is constantly improving, and this is across a very wide swath of markets, whether you’re trading the SPY or stocks.
And so what it lets you know is that short-term strength is coming in, accompanying in that trend. And we can see that as that blue line gets away from the black line, it’s signaling that this is a very, very strong situation, and we see the trend resumes. Now, as we look at these stock charts, we also look at predicted highs and predicted lows, and this really rounds out the suite of these predictive tools that say, okay, even before the trading day occurs, you have all this information of what is the expectation for the trading range.
And what we can do is look back and see, okay, how accurate have all of those predicted trading ranges been? And so with the SPY, you’ll get all this information that the trend is reversing. But this is where the Futures can be really helpful. When the Futures start moving up, whether it’s driven by news, sometimes this happens before 9:30 in the open. But we can see all that strength coming in, and as the market starts to settle, the neural networks do a great job of saying, okay, well, where is price expected to trade?
And as we look at these subsequent charts, you’ll see just how effective all of this is to help short-term Traders or traders who want to add to an existing Trend participate, and so here we can see that if you’re trying to even time your stock trades, this becomes very helpful, saying, okay, when the SPY is down at these levels, that’s where you’re likely to see your individual stocks in the broader Market perk up.
And this is what’s really interesting, even this day where we come out a little bit outside the range, look at how quickly you Gap up, and you’re moving higher to that predicted high, and the trend resuming there. So this is why this is all very, very important to have this information so you’re actually ready to buy on that day before the trading day even occurs.
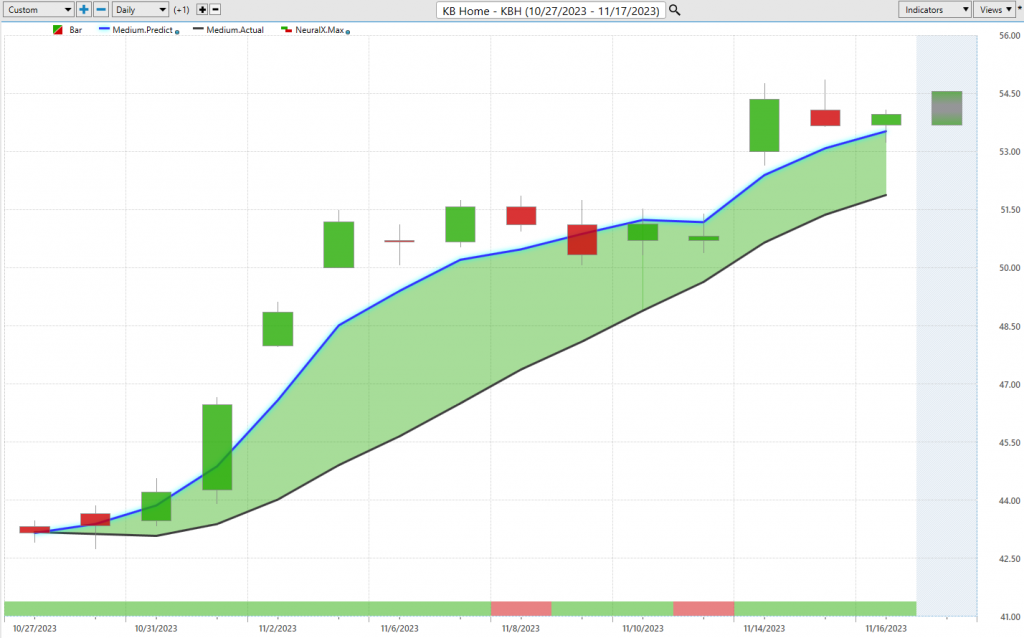
So let’s go ahead and move forward and look at some of these other opportunities. Well, here’s KB Homes, and this is one of the home builders, and we can see this via KB Homes, Lennar Homes, Pulte Homes, the home builder ETF. We all see these blue lines crossing above the black line and a lot of strength from the neural index. And the reason that you can actually identify that is there are features inside VantagePoint like the intelliscan, which you can set whatever indicators you want that match your time Frame and your approach, and make sure you see these things exactly as they start and begin. So you can cut out that lag time, recognize the trend early, and really get maximum value out of that trading opportunity here.
And so we can see that well, home builders have been a great spot to be right. 24% move since that blue line crossed above the black line. But let’s take what we know about these predictive indicators and say, okay, well, neural index gets bearish here. Well, you see that’s where the sideways starts, but overall, ton of strength out of that indicator saying, look, expect short-term strength. The trend is very, very strong here. And of course, if you want to take this very short term, those short-term day traders can come in and bring in predicted highs and lows.
And so you see the same thing right when the SPY is down at these levels. Well, these stocks are hanging down at these levels as well before they’re ready to make an advance. And you can even see again just in things like this, the correlation that plays out in certain stocks and the indices at the same time.
Royal Caribbean Cruises Ltd. ($RCL)
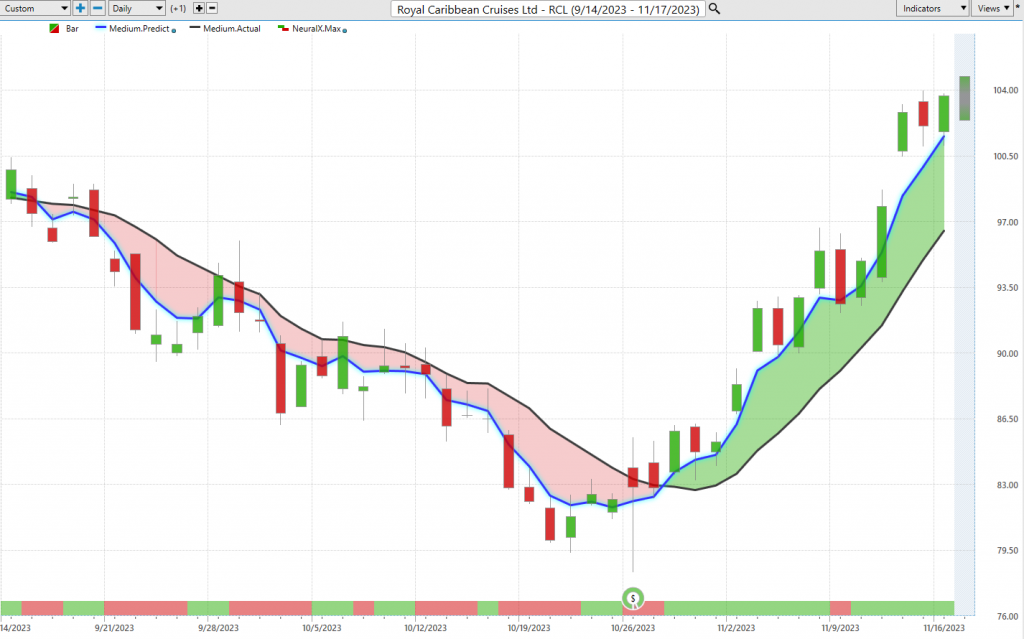
Now we did have some weakness in equities, and so you want to find the things that are really the weakest. And so this was something that really stood out on the bearish side of a good opportunity where we’ve got a lot of weakness.
You’ve got those guidance every day from the VantagePoint forecast that say, okay, well look towards these predicted highs to go ahead and set short positions and take some profit. And so this is what’s really helpful to maybe even help you hang on to your long positions. You have things that are really balancing out the portfolio and making money even as the market goes lower. And that can help you keep some Longs in the portfolio. But what’s so interesting about this is, well, when do we have to recognize that sh…
Well, very clearly here, something has dramatically shifted as far as the overall trend. And so again, we can see that Blue Line crossing above the black line, and it’s indicating that look, expect market prices to go higher. Where will they start moving higher from? Well, likely these predicted lows as we move day to day. And you see again, you get about four entries there where the market is just screaming higher within 24 hours. That Market’s moving up to subsequent predicted highs and resuming that uptrend.
But just a great example of, you know, we look at markets that are in downtrend, and the whole point is that, yeah, they may turn up and may go into an uptrend, but you’re going to wait until that happens, and then you’ll have the guidance to really help you again get maximum value out of that opportunity. And you can just again balance out the portfolio here.
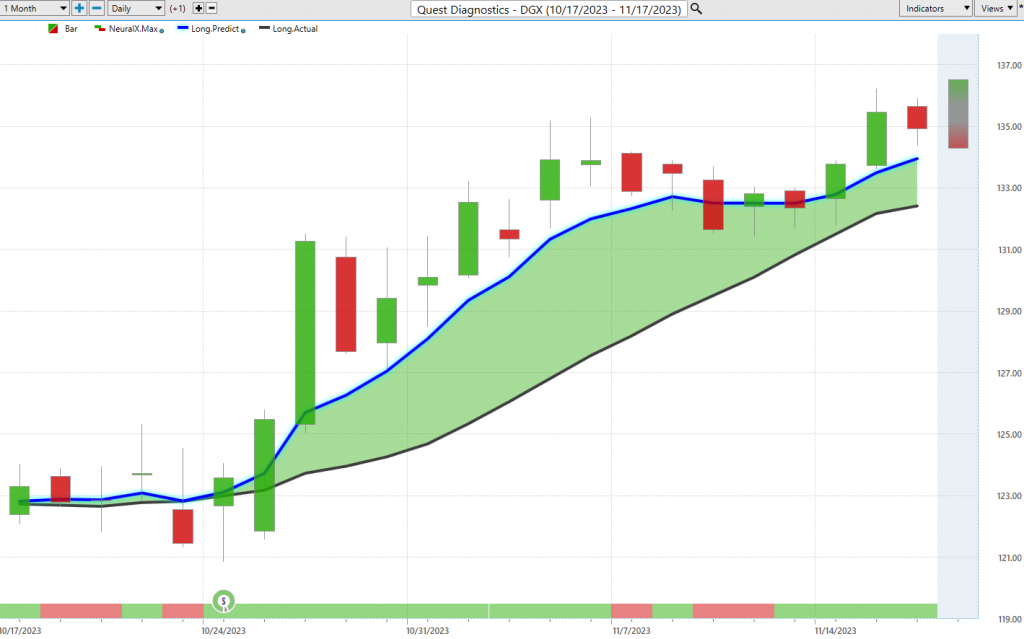
Now, Quest, this is something we really brought in before, a lot of this strength because again we see these blue lines crossing above the black line.
We have earnings in here, but even just go ahead and ignore all that and say, okay, well, how have the forecasts worked over the past few weeks? How has this information, regardless of what we’re going to get in the market, forewarned you? So that you can be prepared. And so here you see Quest. You see as that volatility heats up, well, these predicted levels doing an excellent job. Even this day, so interesting where you come out of the range, look what happens literally the next trading day. You Gap up, you’re trading literally at that predicted low level, meaning that there’s very little low trading happening there, and immediately as buyers come in, we’re trading at higher prices again.
You see these movement down towards the predicted low, saying, look, this is where you want to accumulate a position if you’re trying to exploit that bullish trend, which we can see is clearly up, as highlighted here in Quest Diagnostics. Right, you never get that Blue Line crossing below the black line, but you do get a little warning here that, okay, you may run sideways here, but you’re going to get those updated predicted highs and lows to help guide you day to day to make those trade adjustments. So again, really nice opportunity here in Quest, something that started a little bit earlier than this rally we’re seeing right at the beginning of the month here.
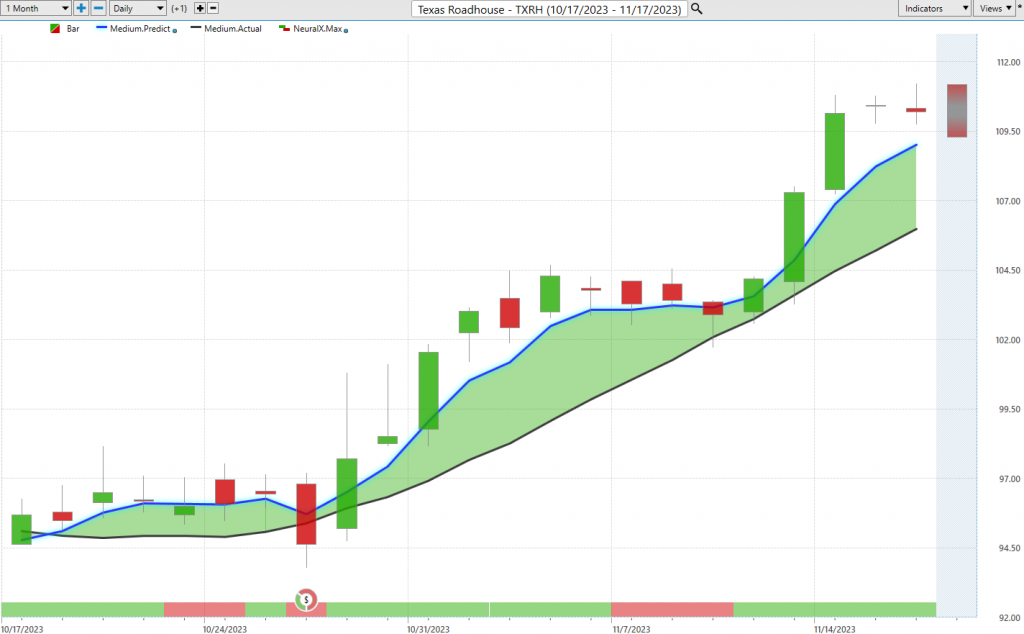
But 9.8, about a 10% rally here in the past 19, almost 20 trading days. Texas Roadhouse, a restaurant stocks. We looked at Darden last week, doing real good. Here’s Texas Roadhouse. So again, understanding that hey, there’s strength in these restaurant stocks. Maybe I can utilize the ADV Vantage Point forecast there. And so you see that blue line crosses above the black line, little weakness from the neural index and some of this recent price action. You’ve really got a strong roadmap here. I believe this is earnings right here in this mess here.
But again, you see predicted highs and lows, adjusting to the volatility and saying, let’s get this back on track and figure out the places of value to accumulate a position and do even some short-term trading, potentially through these periods here. So again, we take a look at the overall move here. Really, really nice rallies here. About a 15% rally in the past 22 trading days.
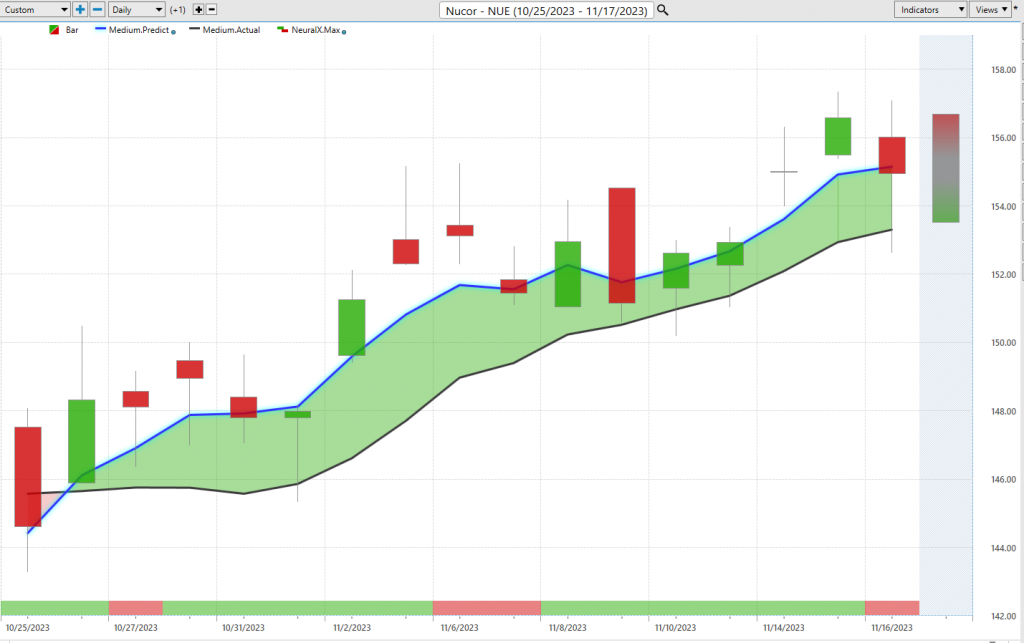
Lastly, let’s take a look at Nucor. So just flipping over to some steel stocks, and again, just highlighting that it’s the quality of those updates and the forecast, right?
Having a tool that every single night is going to say, okay, what’s changed out there? What’s happened with the dollar? What’s happened with the SPY? What’s happened with the relevant ETFs and individual stocks? And so here again, you see Nucor. What’s that going to be driven by? Things like steel stocks, ETF, maybe stocks like Cliffs Natural Resources or these sorts of things. But all of that gets factored in and really summarized right into a price prediction that’s extremely accurate and can help you make these trading decisions.
So if this is a stock you might be focused on, well, okay, well maybe look to buy down at these predicted lows, down at these levels, and take some of that profit along the way because you see often times you get to these levels, we’ll get those reductions in price or the market then returning right back to that price level before we get that resumption of the overall trend here.
So, a little nice move here in Nucor, but again, just highlighting again how to make those adjustments, right?
You’re going to get these updated forecasts, and that’s what you really need to do to take these sort of pieces out of the market and really match it to, you know, what is your trade style? What is your approach? What are we really going for with your trading in the markets? And really have VantagePoint complement that. So, once again, this has been our Hot Stocks Outlook for November 17th, 2023. Thank you all for watching. Best of luck out there, and bye for now.


