


Hot Stocks Outlook for the Week of November 29, 2019
The Hot Stocks Outlook uses VantagePoint’s market forecasts that are up to 87.4% accurate, demonstrating how traders can improve their timing and direction. In this week’s video, VantagePoint Software reviews forecasts for Amgen (AMGN), BioMarin Pharmaceutical (BMRN) Autodesk (ADSK), lululemon athletica (LULU), and Adobe (ADBE).
Register for a Free Live Training!
This Week’s Hot Stocks Outlook
Good afternoon, traders, and welcome back to the Hot Stocks Outlook for November 29th, 2019. I hope you all are having a great Thanksgiving Day holiday, and are doing very well out there in the financial markets. And as we look at really a lot of these stocks that we’ve really paid a lot of attention to, healthcare, biotech, over the past several weeks, continuing to do well with that broad-based strengths. We’ll go ahead and take a look at a couple more stocks within that area. We also got a couple of tech stocks here. We’ve got Autodesk. We’ll take a look at Adobe, and also Lululemon here. But looking here at shares of Amgen, what we have here are daily price actions. Each one of these bars is a full and complete trading day. But against that price date and also at the bottom of your screen, you’ll see there’s a couple indicators there.
Amgen (AMGN)
Now, right up against the price data, we have this black line and the blue line. Now the black line that you see there, that is an actual simple moving average. So a very common technical indicator. What it does is it acts as a really good barometer of where prices have been over a given period of time. But of course, as traders, we need to know, okay, well where are prices going to start moving forward. And so if we look at the value of that blue line, this is actually predicted moving average that’s generated via the artificial intelligence found within VantagePoint. So when VantagePoint is producing a forecast for the target market, in this case, shares of Amgen, it’s going to be looking at things like other related stocks, other biotech, healthcare stocks. It’s also going to look at ETFs, which have a huge effect on the overall market. Things like the S&P, NASDAQ, dollar index, futures, currencies, commodities. And all these markets are known to drive and influence the target market that you’re trading.
So these unique sets of Intermarket are used to generate predictive prices that are actually used to generate these predictive indicators and forward-looking indicators. So whenever you see that predicted moving average, in this case, cross above the actual moving average, it’s letting you know average prices are expected to start moving higher. And therefore you’d want to go ahead and look to take a long position. Now, in addition to that indicator, you also have this indicator at the very bottom where you see we can go from a green to a red, back up to a green. This is an extremely accurate indicator, but it’s only looking ahead two candles at a time. It’s really a 48-hour forward-looking indicator.
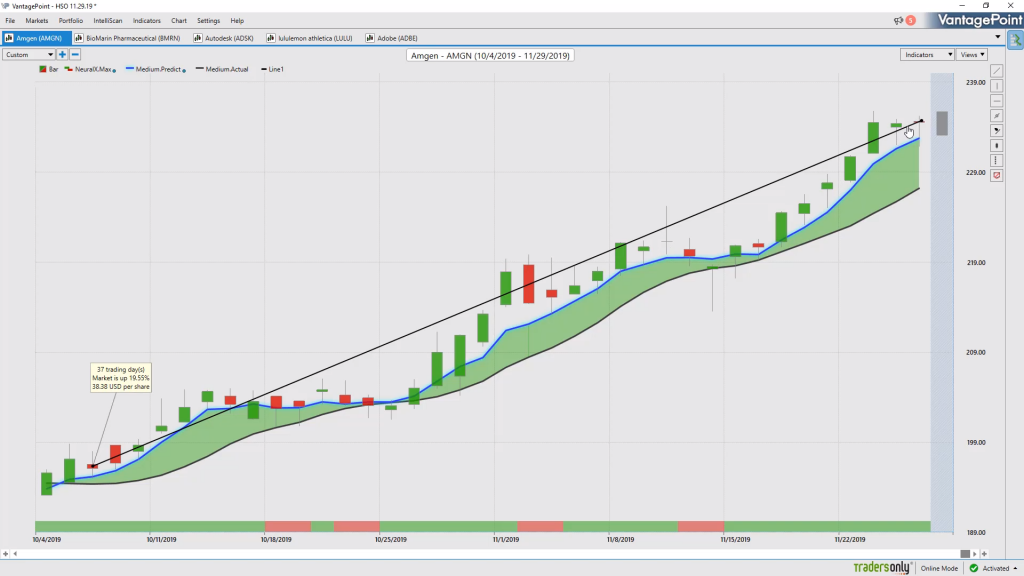
And to really round out the entirety of all these forecasts, which really work the exact same way, whether you’re trading the S&P 500 futures, or you’re trading shares of Amgen here, you also get provided before each and every trading day, so at 6:00 PM Eastern Time, a prediction of the next day’s predicted high and predicted low. So you really have a game plan as far as trend direction, short-term strength or weakness, and actually intraday levels, to go ahead and trade from.
And what we can actually do is understand and say, okay, well, let’s see how accurate each one of those daily predictions are, those predicted lows that are generated also from those neural network relationships. And you see that you get this good guidance, that says, okay, well, you want to belong in the market. You see you’re banging up against these predictive highs as the trend breaks out. But providing some really great intraday levels to go ahead and take a position, where you don’t have to take a huge amount of risk, but you can still get involved in the overall move.
So you see you’ve got about one, two, three, four, five, six, seven really nice entries in this overall uptrend. If we go ahead and go back to that predicted moving average and take a look at the entirety of the move, we’ve just seen healthcare and biotech stocks just keep moving higher. And so if you’re looking for a place, even as a short-term trader, to go ahead and participate, a nineteen and a half percent rally here in shares of Amgen, and you see a lot of that just coming over the past week here, as stocks keep moving higher, the S&P still projected to move higher. And it really helps you understand where you want to be, where you control your stops, and be on the right side of the overall trends here.
BioMarin Pharmaceuticals (BMRN)
Here’s BioMarin Pharmaceuticals. Exact the same approach, where you see we get this crossover between that predicted moving average. And again, these indicators are utilizing predictive data, generated via those neural networks and those Intermarket relationships that are being analyzed, and actually forecast future prices moving forward.
Now you’ll notice at times that the neural index will go down to a red configuration. How I really like to think of that is if you have a good sense of where the overall average is going to be as far as prices, well, you can really expect that when that neural index says, hey, there’s weakness over the next 48 hours, well, you’re probably going to trade below that predicted moving average. That makes sense. An average, we should trade above and below it, and also look towards those predicted lows. But understand, look, the overall trend direction is up. So you see, you get these points where the market sort of runs sideways. You get some lower lows over the next couple of days as the neural index goes down to that red configuration. But when you’re prepared for that, you understand, okay, well, let me look towards the guidance of those predicted highs and lower levels, and go in and execute that overall trading style.
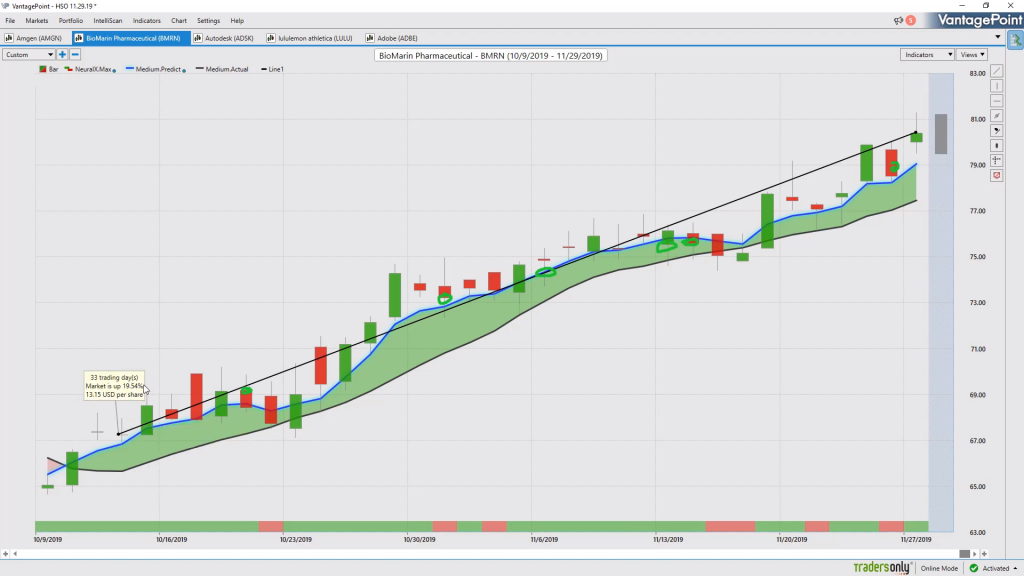
So whether you’re a day trader, or a swing trader, or just a trend trader wanting to add to your position at strategic levels with those profits as the trend continue, you see just multiple opportunities here, where that range is doing an excellent job of letting you know where to take some profit, where to look to buy back in, and really make the most of each one of these trading opportunities. So if we go ahead and look at the overall move here, once again, just phenomenal trading opportunities all throughout the equity markets. But again, specifically the software directing you to biotech stocks, healthcare stocks. We looked at United Healthcare, Humana. Really, really safe places to go ahead, take a bet on the market, and benefit from this huge wave of strength we’ve had in the S&P 500, as we’re bouncing up on new highs just day, after day, after day.
Autodesk (ADSK)
Going over to shares of Autodesk. Now some of these tech opportunities coming in a little bit later. You see some of these crossovers coming in towards the end of October, but very clearly here you see again that neural index goes to red. You get a couple of days trading below the predicted moving average there, but the duration here saying, look, over these 48-hour windows, there’s a lot of strength there. I mean, pretty much every single day it’s saying, look, expect this market to move higher, and when you have a lot of distance as well between that predicted moving average and the actual moving average, it says there’s a lot of strength in that overall trend. And so when you get into these things at the right time, you can go ahead and add to your position. And I have to take a whole lot of risk but build a decent size position, and then benefit when these trends really go ahead and take off.
So again, if we go ahead and look at the entirety of this move, also with the predicted highs and lows, you just see how many of these predicted levels keep getting hit, and then you buy at the predicted low. Target the predicted high, as a short-term trader. But this market moving up over 22%. And you see about one, two, three, four, five, six, seven, eight, nine, 10 entries. Even on this huge day where the market moves up, we hit that predicted low for the day, and then immediately move higher about $10 per share. So really nice move where you can capture even more than that 22% with some trade management, and the help of the guidance of these predictive indicators.
lululemon athletica (LULU)
Now a little bit different place in the market. We go to Lululemon. And again, you just see these forecasts coming through and saying, look, there’s strength here. If you want to trade here, it’s saying, look, over these subsequent 48-hour predictive windows, expect strength in the market. So even when this market’s running a little bit sideways, you get no indication that this market is ready to move lower, and you start gapping up. The trend continues. And a really fantastic opportunity to get involved in shares of Lululemon’s.
Once again, let’s go ahead and take a look at those predicted high and low levels. And you see that you get one hit here, but overall the trend very, very strong here. You get close on a couple of these days, and a couple of these more recent days just in the past week, hitting a predicted low in this market. Just over the past four trading days, you see moving up a pretty nice percentage here. About a 6% move just over the past few days. Overall this trend up. Again, over 12% just in the past month here, in shares of Lululemon.
So again, a really nice opportunity, but you see these things spread out, right? You can get involved in healthcare, biotech. You see some tech stocks coming through more recently. Things like Lululemon coming through as well, highlighting some opportunities to go ahead and take long positions as the markets generally start moving up. And you can trail your stops, lock in some profits and participate in this really nice rally that we’ve had for just week, after week, after week.
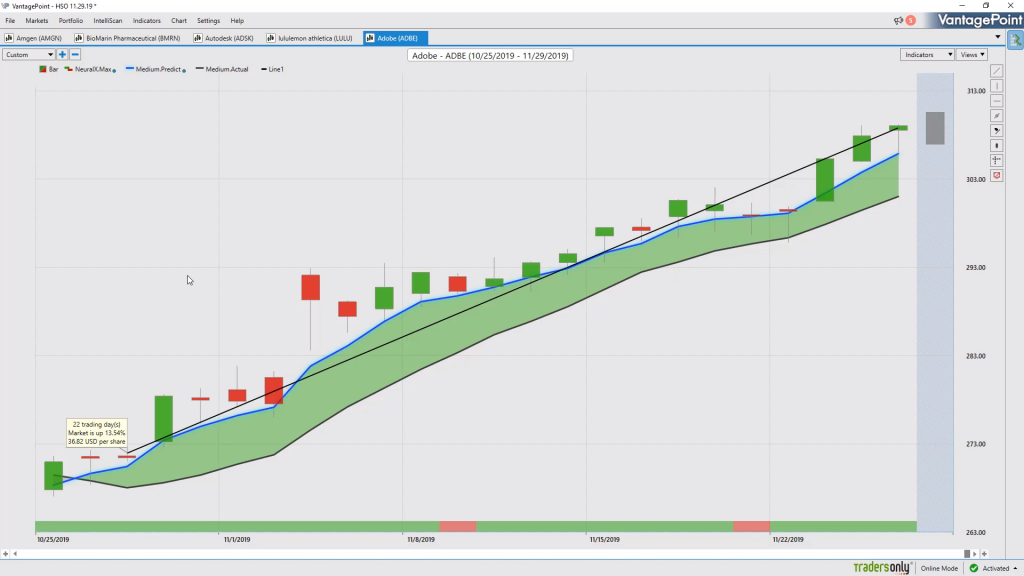
Adobe (ADBE)
Here, shares of Adobe. And just another clear example of you see how much strength is coming via these neural network forecasts. So you get a couple of days where, hey, yeah, there’s some weakness over the next 48 hours. Expect some lower lows to come through when these neural indexes get bearish. But the trend very, very strong here, and the overall picture, day-after-day, getting trend up, short-term forecast up, and your predicted highs and lows moving up as well and letting you know that this trend is likely to continue.
So what’s really nice about these opportunities when you can recognize them early, sometimes you get some really nice surprises. The market gapping up, moving in the right direction. But you have plenty of places along the way to go ahead and add to that position, make the most of each opportunity that you get involved in. But also, as well, when the markets turn around, understanding that, okay, well, now you can go ahead and get out of your position, take profits and make sure you make the most of that 13% rally so far. But if it comes time to take some profit and move on to something else, you’re going to have that indication, as well as that blue line, crosses below the black line, and trends start moving to the downside.
So just again, rehashing a lot of these great opportunities. And we know we have a shorter week with Thanksgiving, and markets closing a little bit early and not being open on Thursday, but there’s plenty of great opportunities over the past several weeks where you can be trailing your stops, have a great position. And when this market turns, software’s going to let us know that it’s time to go ahead, take short positions, take some profit on our longs, maybe buy some puts for some protection, but we’re not seeing that quite yet. And when we do, we’ll be sure to bring it in, in our Hot Stocks Outlook. But it’s pretty much been, go ahead, get long in the markets. Healthcare, biotech, the most obvious of places as far as using the VantagePoint software. Been a really great couple of months here in the overall marketplace.
So once again, this has been our Hot Stocks Outlook for November 29th, 2019. Thank you all for watching. Best of luck, and bye for now.

