Register for a Free Live Training
The Hot Stocks Outlook uses VantagePoint’s market forecasts that are up to 87.4% accurate, demonstrating how traders can improve their timing and direction. In this week’s video, VantagePoint Software reviews forecasts for SPDR SPY($SPY), META ($META), Adobe ($ADBE), Electronic Arts ($EA), Lowe’s ($LOW), McDonald’s ($MCD), HASBRO ($HAS)
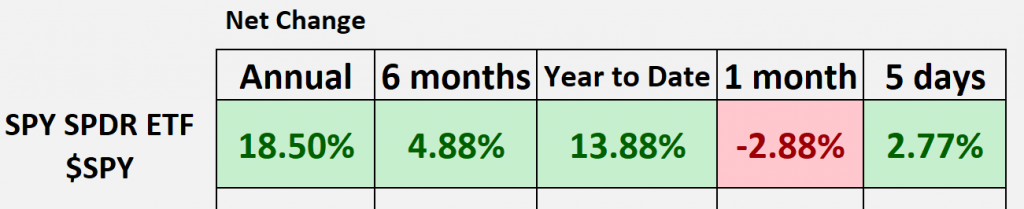
SPDR SPY ETF ($SPY)
Hello again, traders, and welcome back to the Hot Stocks Outlook for October 13th, 2023. Hope you all are having an excellent week out there in the financial markets. As always, we’ve got plenty to cover for this week’s Hot Stocks Outlook. So if you haven’t already, make sure you go ahead and click on that link in the description below, and you can get a live demonstration to learn more about the specifics of how this technology can really help you make better trading decisions day in and day out in the marketplace.
So, as we typically do, we can take a look at the broader S&P 500 performance through that SPY ETF, and really each week what we keep looking back at is, if we go back 12 months or really that year-to-date number, we’ve had those really great rallies. It started towards the beginning of the year, but things have really started to run sideways. And so what we’ve been highlighting in this Hot Stocks Outlook for the previous weeks is that you really want to identify those strong markets but also avoid some of that weakness in the equity markets. Right? So, as the indices or the SPY runs sideways and sort of chops up and down, you want to find those opportunities where you can pull some money out, whether it’s on the bullish or the bearish side.
So what we’re going to do is we can start out here. We’ve got shares of meta, Adobe, EA, so a lot going on in the tech space as far as Vantage Point’s predictive indicators. But again, highlighting that there’s a lot going on here in the markets, and it’s not all just sort of straight up here as we look at a chart of meta. But let’s go ahead and use this as an example of how all of these predictive indicators and tools work for the trader coming in every day and making those short-term trading decisions.
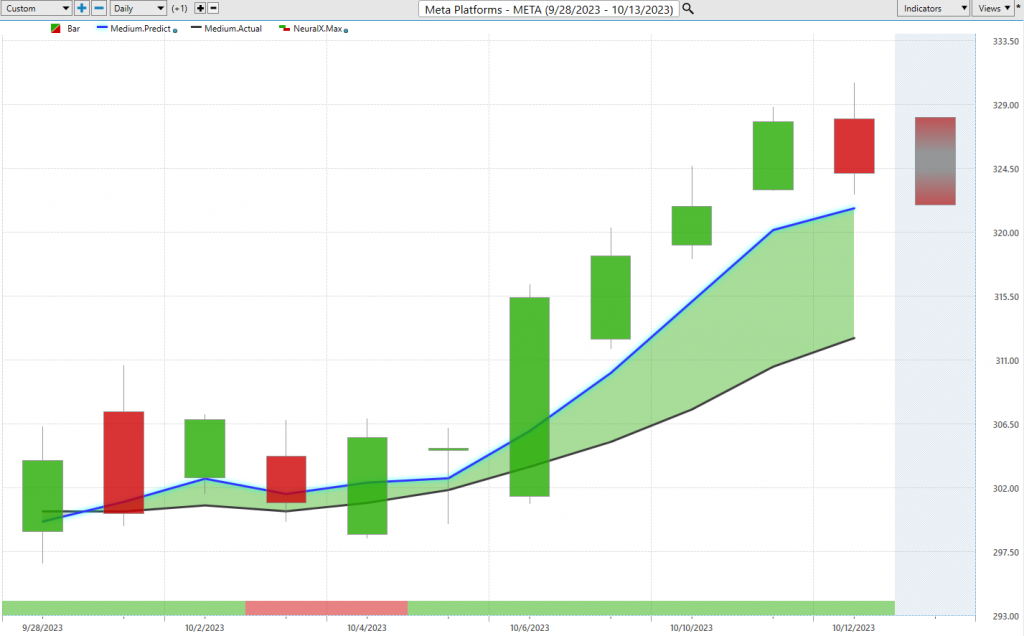
So here with meta platforms, what we have is daily price action. Right? So each one of these candles that you see is representing a complete trading day, and it’s right up against that price data. What you’ll notice is there is a black line and also a blue line value. So what you’re going to notice there is that black line value, that’s a simple moving average. So that’s a very common technical indicator, and in this case, it really acts as our baseline. Right? It’s going to look back at the previous 10 closes, add those all together, and then divide by that number, and it really smooths out the existing price action, letting us know where market prices have been over a given period of time.
But traders need to be ahead of those next shifts and moves in the marketplace and really get ahead in identifying that. And so what we’re able to do is actually compare that black and blue line value. And what this blue line value is for that number to get plotted and generated every evening, what’s happening is the artificial intelligence or artificial neural networks are performing what we would call intermarket analysis on meta to determine what is the likely direction of future prices.
And so what this means is it’s not just to look at, you know, what’s the past price of meta like a simple moving average or an exponential moving average. It’s going to look at other markets that are known to drive and influence future prices. So it may look at, you know, XLK the ETF, it may look at other individual stocks. It’ll probably look at the S&P 500 or the NASDAQ index as well as things like the Dollar Index or the Gold market. Right? Individual markets, depending on what they are, are going to have, you know, very important influences by things like the commodity markets, by oil, by gold prices. And this is how this software is able to look specifically at what is the market you’re trading, what are the markets that are known to drive and influence the future price there, and it’s utilizing that technology to actually generate future price predictions.
So it’s really that data that’s generated via the technology that’s used to construct these what we would call predicted moving averages. So whenever that blue line in this case crosses above the actual moving average, well, it’s suggesting that those intermarket relationships are really working well in this case, pushing the market higher. Right? So in this case, the Dollar, the XLK ETF, other individual stocks, ETF groups, and it’s all sort of skewing and highlighting that that blue line is getting above the black line, and average prices are expected to go up. And we can see here this is now 10 days, that’s two full weeks of trading in the market where meta, very clearly, we’ve seen, has been in an uptrend as far as Vantage Point is concerned with that blue line over the black line.
Now each week, we also take a look at this indicator at the very bottom of the chart, this line that goes from green to red back to green, and this is another predictive indicator utilizing that technology, but it’s only looking ahead 48 hours at a time. And so each week, as we look at these forecasts, we can see that, okay, when that neural index goes bearish, you can expect some weakness over the subsequent 48-hour period. But what’s the direction of the overall trend? And we see as you get towards the tail end of that 48-hour period, the neural index gets bullish again, we see all that momentum and strength come into the market.
So, you know, this past week, when you’re trying to identify, okay, well, where’s the uptrend? Where’s the short-term strength in the market? We can see Meta, the entire week here, has been very, very bullish. That’s been a safer place to potentially do some trading. And lastly, what we do is we look at these predicted highs and lows. So, you know, aside from getting the trend direction right, that short-term strength or weakness from the neural index, you’re also given a predicted high and a predicted low, some intraday price levels to help traders make those better trading decisions. And this is what we do each week is we come in and look at how accurate these very short-term forecasts are.
It’s saying, okay, well, the trend is up, the neural index is bearish and gets bullish here, but where’s the daily predicted low values? Well, down here at the lower part of the range, and you see how that offers excellent entries to get involved in the marketplace. And really, no looking back from there with shares go higher here in Meta, up about 8%, really just over the week there.
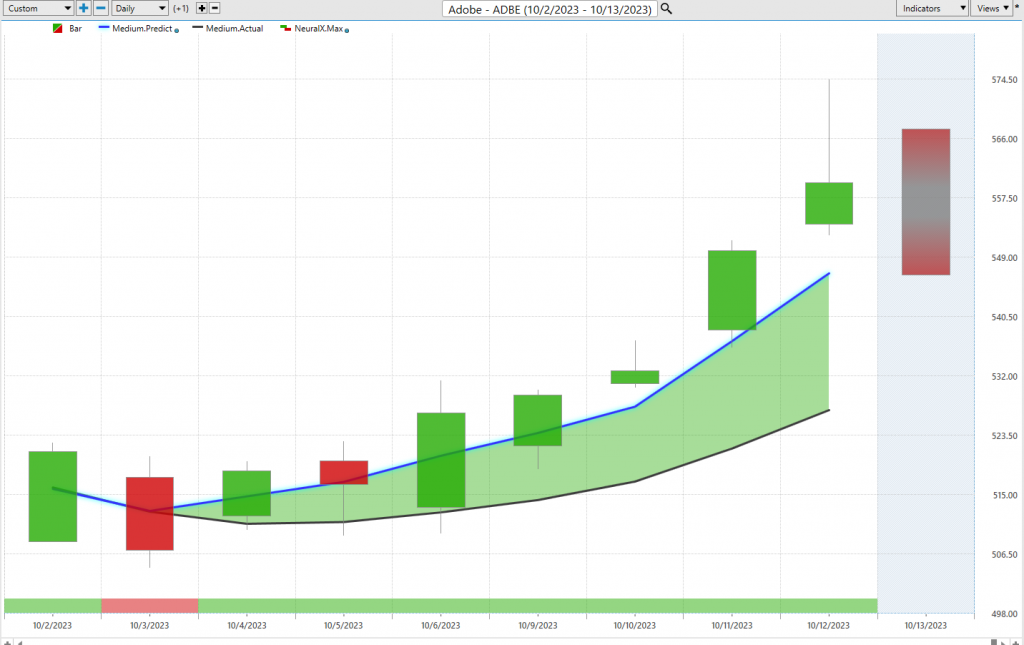
Now, here’s shares of Adobe, and again, another tech stock, and you see here that we have that predicted moving average really right on top of the actual moving average. But look how this forecast really starts to separate that blue line or that prediction from the actual moving average. And that neural index gets very bullish. And again, when you’re trying to identify strength in the market, well, clearly here, Adobe, very, very bullish. And you see just more and more separation. And so this is why you really need to be careful as far as a market like we’re in right now, where you can take those long positions, but you
want to find the safest places to go ahead and do that. So you see about an eight, almost 9% rally over the past seven trading days. And again, we can look towards those very short-term Vantage Point predicted high and low levels and see how good of a job they do at really offering levels to get involved in a particular market or trade. So again, really nice entries and really no looking back from there with shares of Adobe.
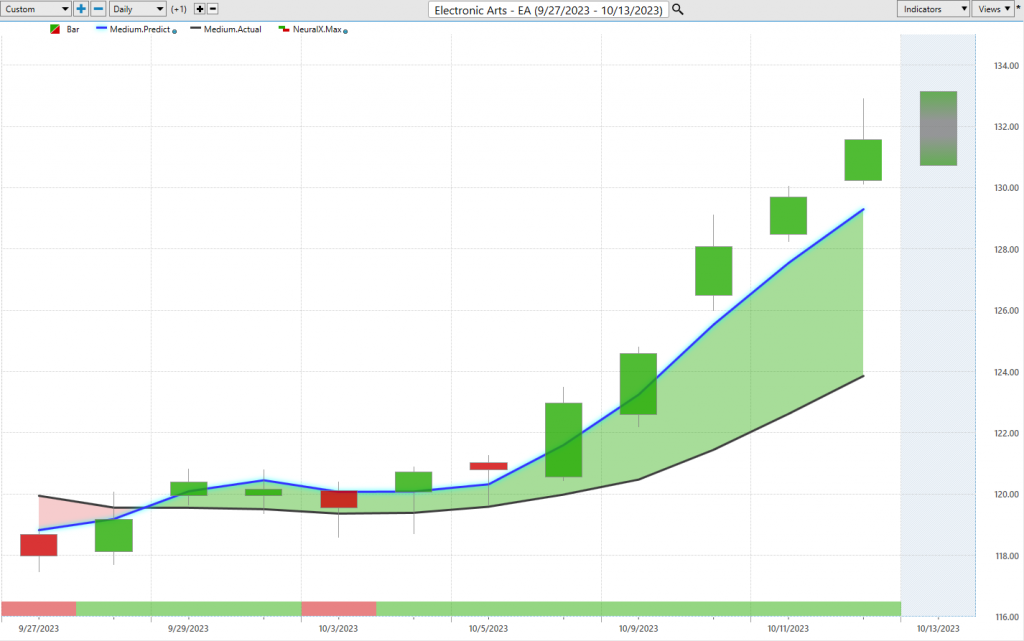
Here’s EA, so again, another tech stock, seeing that blue line cross above the black line. And this is where tools like Vantage Point’s and Telescan are really helpful. So what we can do is actually open up these scans and identify really all these fresh crossovers right as they occur. So you can really set up a process by which you identify that, hey, we’re seeing these bullish crossovers come through a lot of the tech space. Maybe we can focus some attention there, just like those previous examples with meta and Adobe, we can look at these predicted lows and see how they offer really excellent levels to go ahead and participate in the marketplace, and even on the bullish side as the market moves higher.
You see that offers a good level as far as where the market’s likely to move. We tend to gravitate back towards those levels, and the trend resumes here. So really nice opportunities, a lot of momentum in some of these tech stocks. So here we see EA with a really nice move along with, again, Adobe, Meta, of about 10% just in the past 10 trading days. So again, over the past couple of weeks, where we’ve seen a lot of up and down in the S&P, we hear it’s been pretty consistently up across a lot of the bigger Tech names, and they’ve really been leading the way.
And so what I want to highlight here is that it’s not all straight up, though, right? There’s some really nice opportunities here where the Vantage Point forecasts are performing extremely well, but there’s other sides of that S&P 500 in the broader indices that are really weighing things down. And again, it gets back to this point of why you want to identify, you know, specifically the individual markets that are more likely to hold up and form and completely avoid a lot of these markets where Vantage Point is forecasting that the markets are in a pretty strong downtrend here.
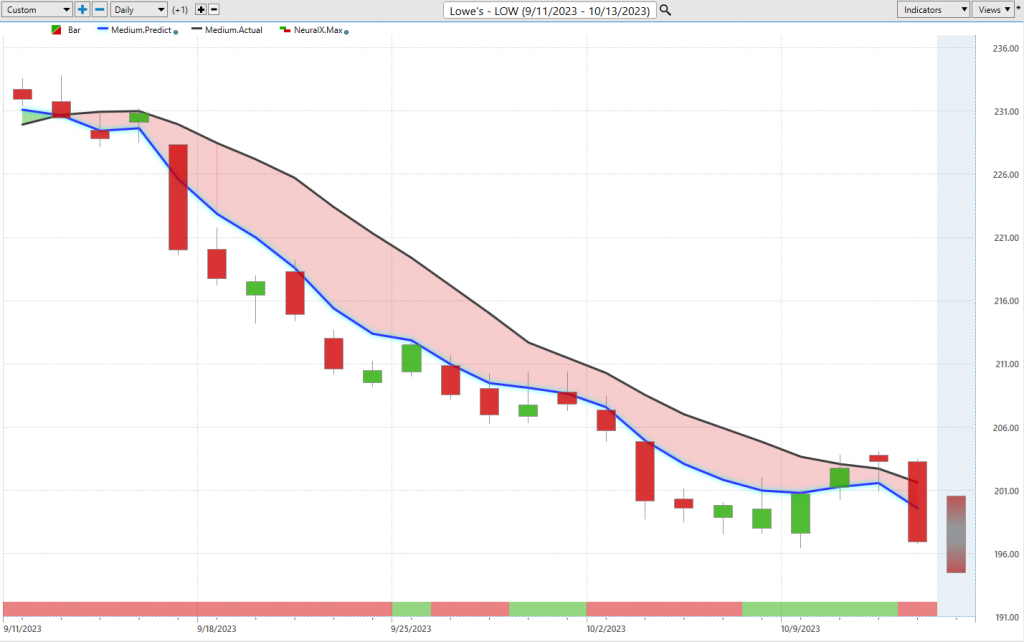
So here in shares of Lowe’s, we can see that blue line crossing below the black line, and let’s just look at the last couple of weeks here as far as the Vantage Point predicted moving average and its short-term forecast, right? So not even close to getting a crossover here, very strongly here, still on a downtrend. And we can see this neural index, right? It runs sideways here. We get a little bit of a sideways consolidation phase, but as that neural index gets bullish, the momentum kicks back in. Another sideways period and still in that downtrend. So we can look at the predicted highs and lows, offering multiple levels along the way to say, “Look, if you want to add some diversity, short the portfolio, maybe you are getting long some of those Tech names, and you want to even some of this out.” Well, clearly you can see that these other areas of the market are not clearly as robust here and having some real difficulty.
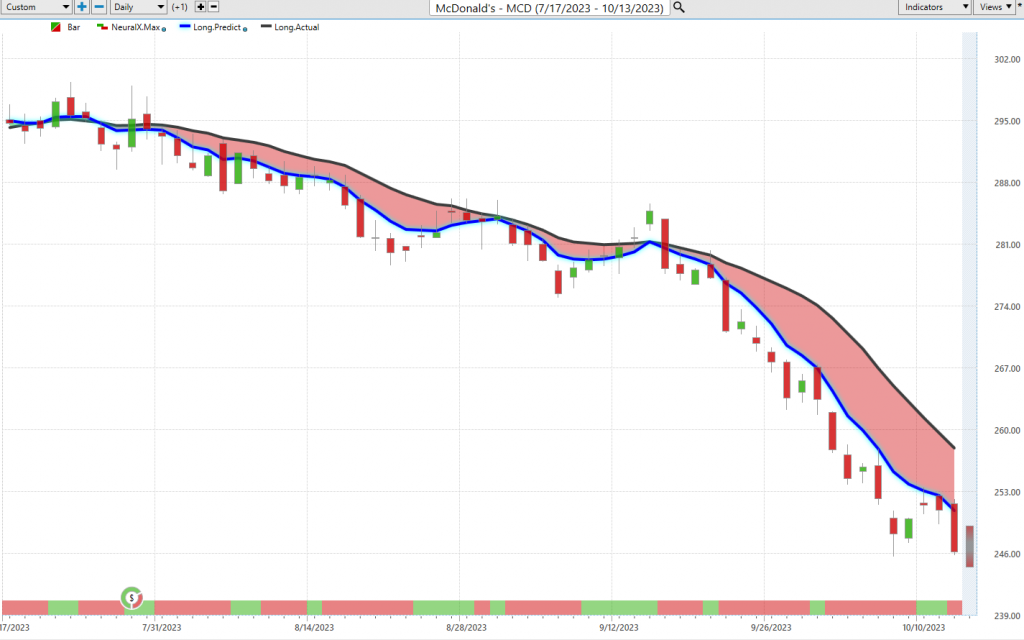
So a 14% decline just in the past 22 trading days, and you see really getting nowhere this past week and trending lower still. Shares of McDonald’s, a very similar picture, and you get a lot of areas of the market just wrapped up in a very similar sort of trajectory here, right? So we see the tech space and the NASDAQ doing pretty well there, but obviously, a whole different narrative going on in other parts of the market. So here we see that McDonald’s crossed below the blue line and the black line, and just a lot of weakness here, right? So if we look at the neural index, it’s not bullish very often here, a couple of little spats where we get those sideways price action with higher highs over the subsequent 48 hours of trading.
But day-to-day here, very clearly, hey, if we get up towards these predicted highs, what do you want to be doing? Well, shorting, taking profits on short positions and managing it that way.
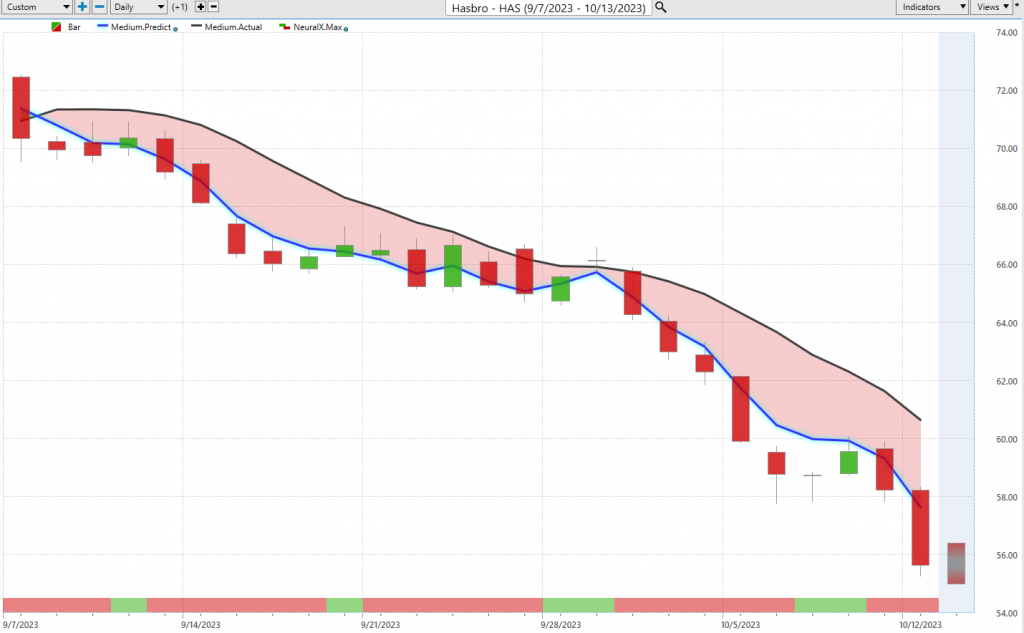
So you see about, you know, five, six entries on the bearish side as shares go lower, and really Hasbro getting really hammered recently this week, as we see going into the week. Well, you know what did you have? Well, a lot of momentum to the bearish side. You get a little bit of strength at the beginning of the week, but clearly, Blue Line well below the black line, the overall trend very, very bearish there now, 21% decline just in the past 25 trading days.
So, you know, there’s really a lot going on out there in the markets and really nice opportunities. But of course, you want to recognize those important shifts in the market and then have those tools like the Vantage Point predicted highs and lows, the Vantage Point neural index to help manage those trading opportunities as they play out. And so what we’ve seen over the last couple of weeks is some markets perk up and do pretty well offering up some pretty choice opportunities as far as those predicted low levels to get involved, but other markets clearly are in downtrends and susceptible to weakness.
So, you know, when you identify these different sectors of the marketplace, whether it be Tech, some of these other retail places where we’re having some trouble, you know, just helps you navigate your portfolio a little bit better, make those better trading decisions as you push forward and navigate the marketplace. So once again, this has been our Hot Stocks Outlook for October 13th, 2023. Thank you all for watching. Best of luck out there, and bye for now.