


Hot Stocks Outlook for the Week of
September 11th, 2020
The Hot Stocks Outlook uses VantagePoint’s market forecasts that are up to 87.4% accurate, demonstrating how traders can improve their timing and direction. In this week’s video, VantagePoint Software reviews forecasts for Pulte Homes (PHM), Baker-Hughes (BKR), Exxon (XOM), Caesar’s Entertainment (CZR), General Mills (GIS), Fossil Group (FOSL), Shake Shack (SHAK)
Register for a Free Live Training
This Week’s Hot Stocks Outlook
Hello again, traders, and welcome back to the Hot Stocks Outlook for September 11th, 2020. Hope you’re all having an excellent week out in the financial markets. And as always, plenty to cover in this week’s Outlook. So we really do have a lot here. Opened up seven markets. We’re going to start here with Pulte Homes. We had a couple of energy companies with Exxon, Baker Hughes, some consumer non-cyclical. Really important to look, really, at the sectors that we’re looking at here. We’ve got Caesars Entertainment, Shake Shack, and also Fossil Group. So starting out here with Pulte Homes, this is a really good market to really understand what’s going on with the stock market generally, and things like the S&P 500.
Pulte Homes (PHM)
And we’ll see here with Pulte, what we have here is daily price action. So this represents a full and complete trading day, right up against that price data. So it’s one day for every single candle. And you’ll notice that there’s a black line and a blue line right up against that price data. Now the black line that you see there, that is a regular simple moving average. So a very common technical indicator. And what that line does, what that value is, is looking back at the previous price action, say the last 10 closed prices, adding them all together, and then dividing by 10. So it’s a good measure of where market prices have been over a given period of time, but obviously traders need to be ahead of the move and understand where are prices expected to move tomorrow and the next day.
So what we want to do is compare that black value that you see on the chart to this blue line that you see. And this line, this blue line, for it to be calculated and generated each and every trading day, VantagePoint is utilizing what’s called artificial neural networks. And they’re doing a very specific type of analysis known as Intermarket analysis. And what that means is, rather than just looking at the past share prices of Pulte Homes, like a regular moving average would do, the software here and the technology is looking at things like the S&P 500, things like homebuilding ETFs, things like global currencies, global interest rates, futures, and commodity markets. And it’s able to utilize that information, find those important market relationships, and actually generate future price predictions of what’s going to happen in the future.
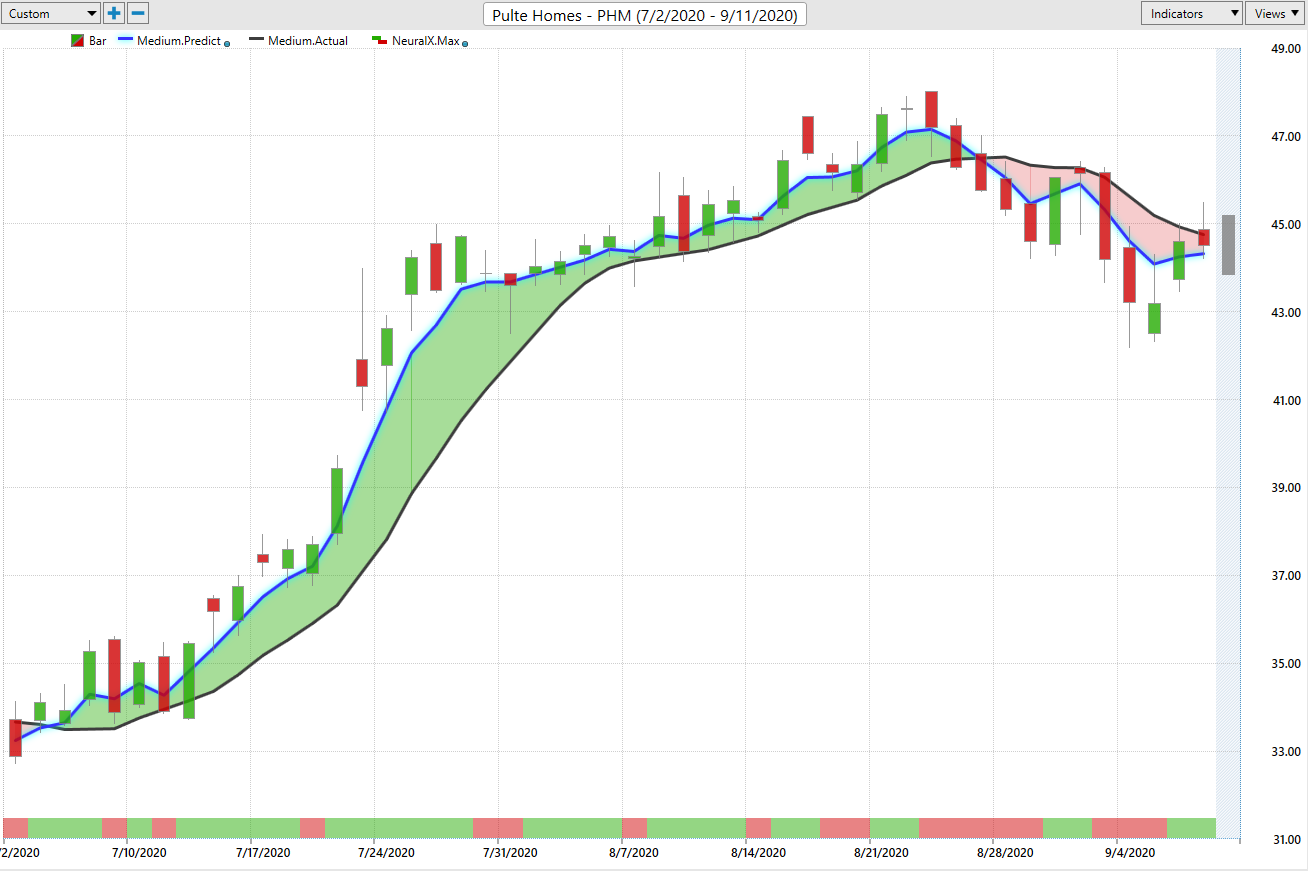
So you can think of that as things to the right of the chart that haven’t yet occurred. And then it actually takes those predicted values that are generated and builds them into the value of this blue line, turning what was a lagging indicator that just gets plotted along, based on where the market has closed most recently, into a forward-looking predictive tool. So whenever that blue line, in this case, crosses above the black line, it’s suggesting average prices, or you can think of that as the trend, is expected to start moving higher. So those average prices overall are going to start drifting higher and higher. So whenever you see that blue line cross above the black line, the trend is up and you’d therefore would want to build a strategy based off of taking long positions. Pretty straightforward idea here.
Now, in addition to that predicted moving average, you’ll see at the bottom of the chart here, we have this line that goes from green to red, back to green. So this is what we call a binary output. It’s either yes or no, up or down. And this indicator is extremely accurate, upwards of 80% accuracy over being backtested and really the entire basket of markets that we forecast for, whether it be stocks or ETFs, futures. And what this indicator is doing is actually forecasting short-term strength or weakness in the market. And it’s actually geared towards the 48-hour timeframe. So you can think of it as very short-term strength or weakness in the market. And if you look at the very right-hand side of the chart, you also get a predicted high and a predicted low. So you’ve got the overall trend direction. You’ve got short-term strength or weakness over a 48-hour period. And actually an intraday predicted high and low level. And that really rounds out the entirety of these forecasts and lets you, as a trader, know what should I expect going forward, what level should I look to be taking positions at.
And this is where things get exciting. So we can see, okay, well, since that blue line crossed above the black line, we’ve got about a 37% rally. But things have shifted in the market more recently. And this is where the software will really help you recognize a lot of this, that certain markets, whether they be energies, the S&P 500, homebuilding stocks, consumer non-cyclical, actually performing quite poorly. And it’s actually a good time to go ahead and short those markets, or take profit and get out of the way if you had been long.
But we can take a look at, again, the entirety of this forecast and take a look at that predicted high and low range. So when the market is moving up, it’s telling you, look towards these predicted lows. Again, all of this information is provided before that next trading day. So you have all of these levels before really 6:00 PM the night before, going into the next trading day when stocks open at 9:30. You’ve got all of these levels ahead. So even on days like this, if you have a limit order waiting down at that predicted low, you get filled right at the open, and then you see that market moving higher over the next 48 hours here.
So really a lot of nice opportunities on the upside here as that market moves higher. But then when things reverse, you want to do the same thing and recognize that, okay, well, from this point on, from the 27th, you want to go ahead and get out of this market or short from those predicted highs. And we can again see how accurate a lot of those levels have been. You have a predicted high hit here, here this day you come up to the previous day’s predicted high. Predicted high hit there, hit here. And really learning, you look, get out of the way. If you want to get long, you can look towards some other market, but don’t be doing that specifically. Here we have the homebuilders. Here are energy stocks.
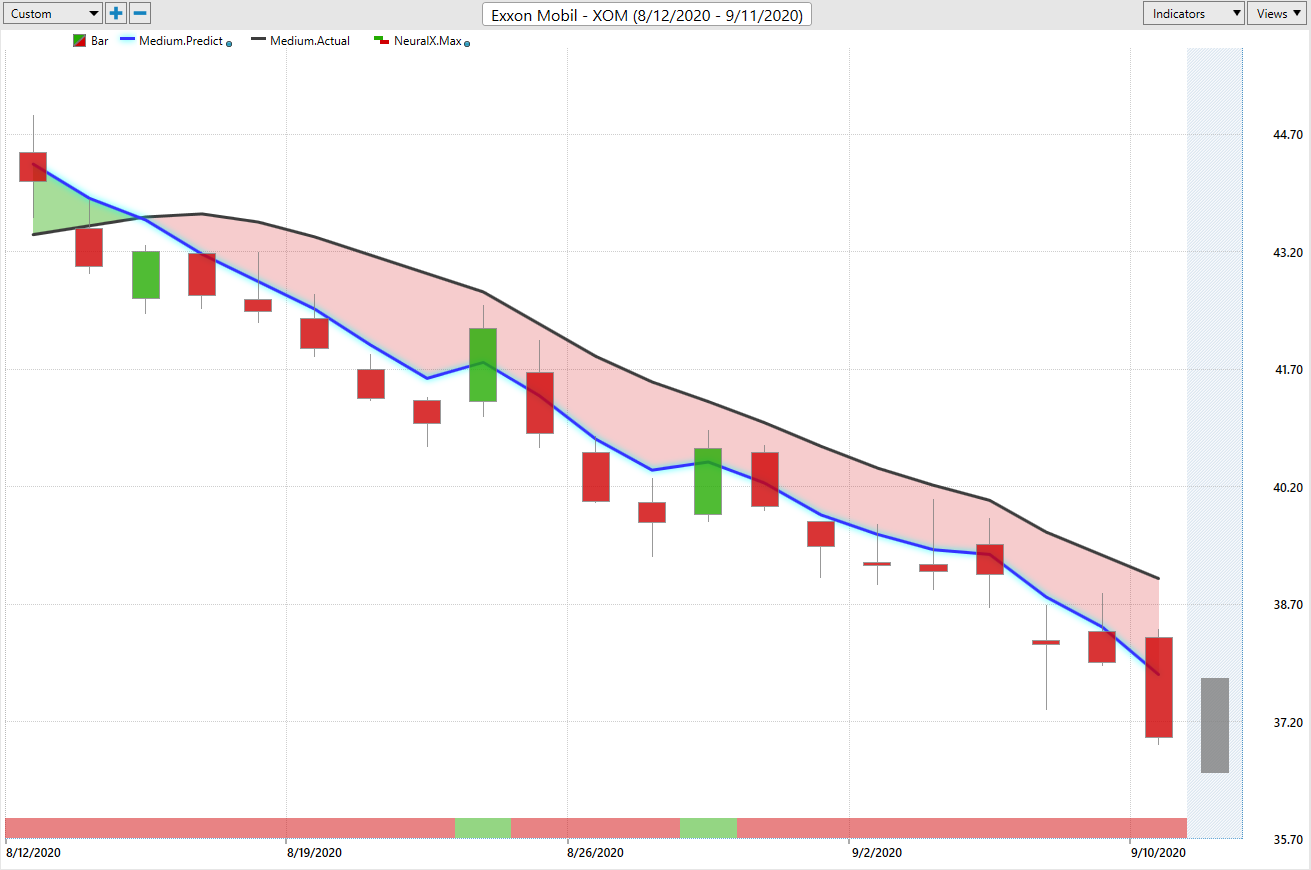
Exxon (XOM)
And you see long before the market started to get some weakness come through it last week, these are areas of the market where it’s been very, very clear you want to remain short. And we have shares moving from about $43 a share so far, moving down to a, really, well, below 38 here. The market’s moved down about 11 and a half percent here in shares of ExxonMobil over the last 17 trading days.
Baker-Hughes (BKR)
We look at Baker Hughes. So when you’re looking at these things on a sector sort of basis, you understand that the energies are quite weak. We saw crude oil and commodity markets move lower with stocks on that, move lower. And this is certainly places that if you want to hedge your portfolio and get some short positions to really contrast those positions where you may be long, these are really the places to do it in addition to those consumer non-cyclical stocks here.
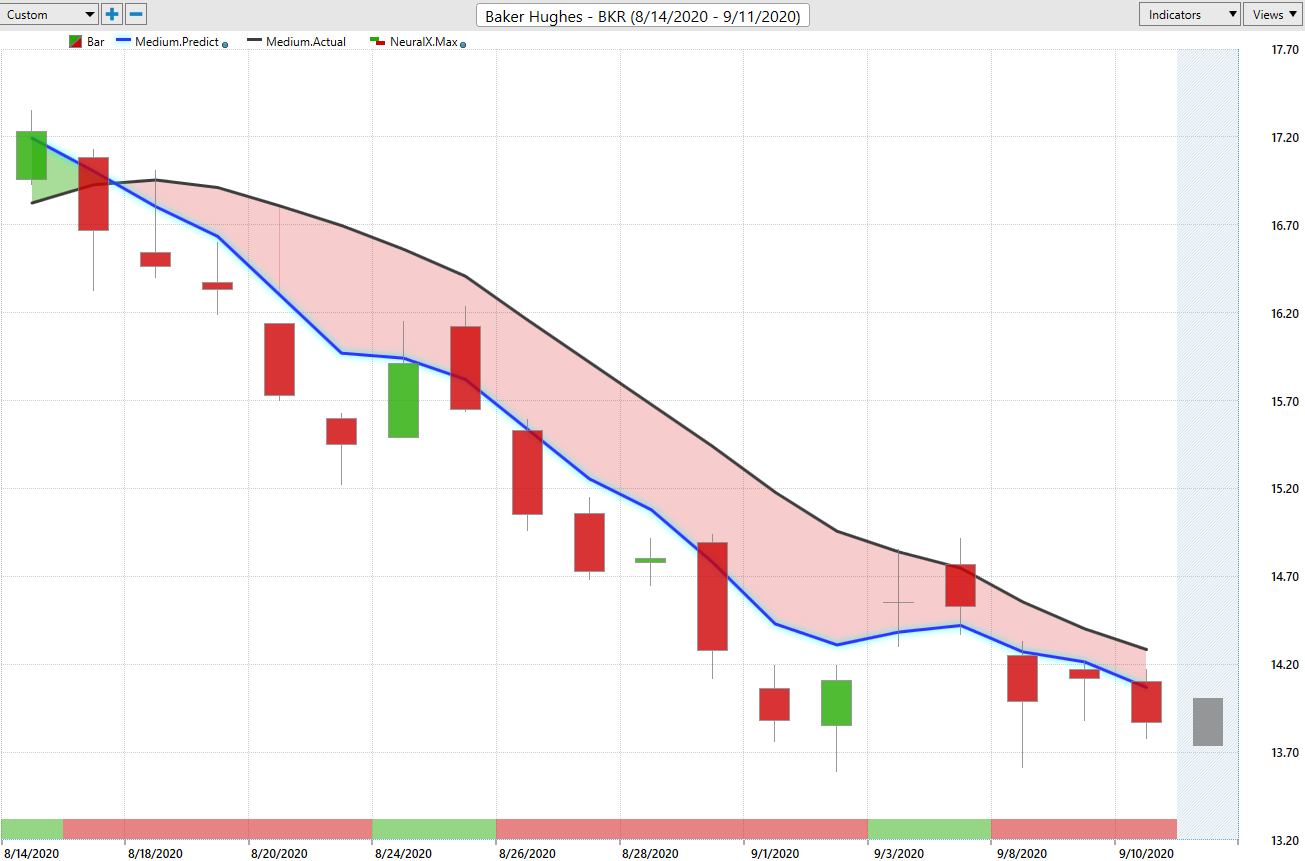
So again, we can look at those predicted highs and lows. And you see you have that good roadmap that says, all right, well, if you want to be trading in these areas, these are really the levels where you could come in and look to actually take a short position. Certainly, no reason to be long, as you see quite a bit of separation as well between that prediction of the moving average and the actual moving average.
General Mills (GIS)
Lastly here, as a sector, consumer non-cyclical. So when you look at a lot of those grocery store stocks, as far as Kraft Heinz, General Mills, Kellogg, a lot of these things very clearly getting this crossover to the downside and suggesting that prices are very, very weak here. And this is a good example of how the predicted neural index works. So you see that this indicator goes down to this red configuration in line with the trend. That’s a pretty strong downward forecast. But sometimes you’ll get this neural index popping up to a one. And what it’s telling you really is that, over those next 48 hours, expect some higher highs, or, conversely, some lower lows if it were bearish here.
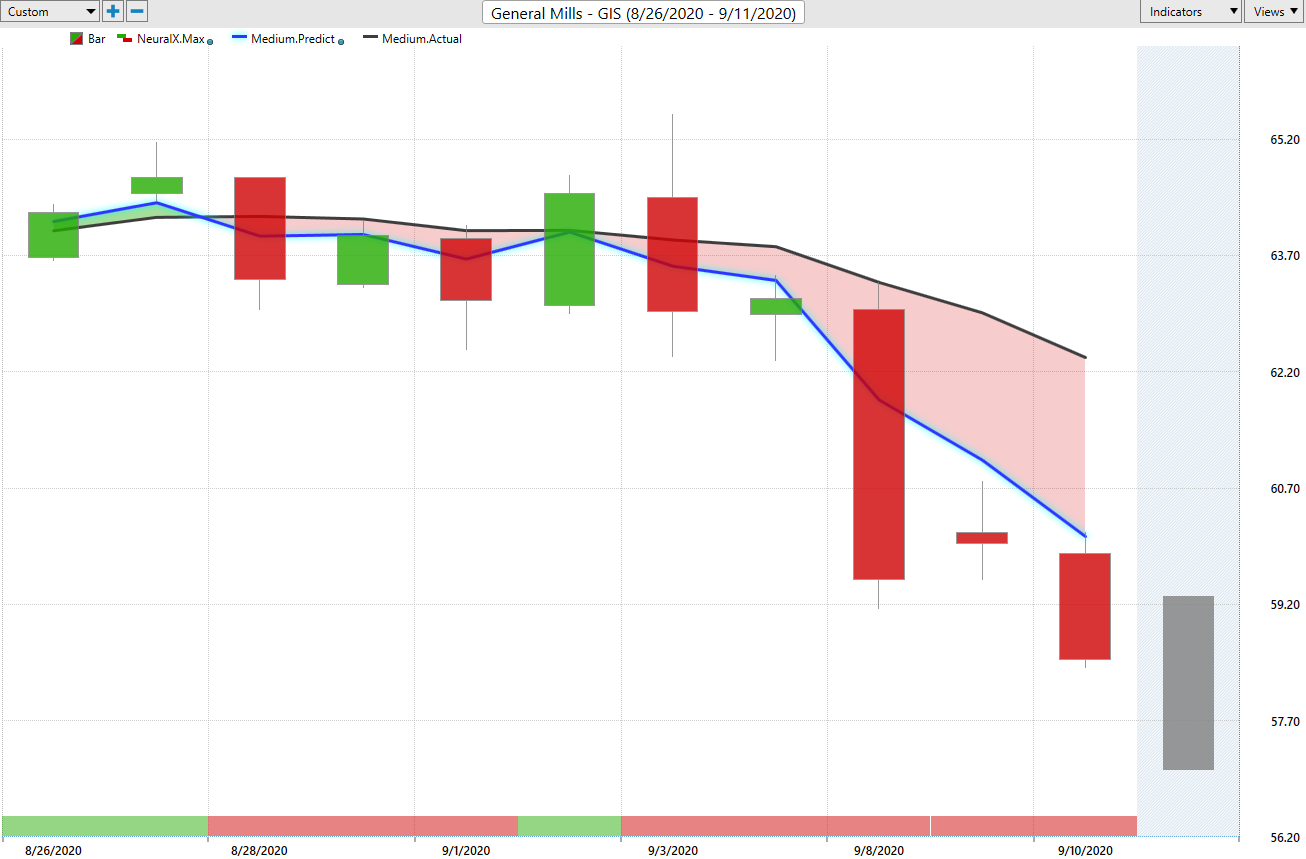
But letting you know that look, the overall trend is still down. The blue line is still below the black line. But over that 48-hour window, you may see the market push up towards those predicted high levels. And make sure that you’re using the software to understand that, okay, well, we can certainly very easily trade up here if we’ve got a neural index bullish. And you see that that prediction of the range actually moves higher as well. So as far as utilizing these tools on a daily basis, you’re going to get that intraday sort of information that, hey, if the predicted high and low range has moved higher, expect that range and those highs to potentially be met, and don’t have a stop sitting within the area that the market is expected to trade within.
Caesar’s Entertainment (CZR)
Here’s Caesars Entertainment. And what’s been really interesting is a lot of the casino stocks, hotel stocks, theme park companies, have really been doing quite well and actually recovering here. So here we have Caesars Entertainment, very strong crossover to the upside. And you see just a ton of separation between that predicted moving average and the actual moving average. And you see that while the market starts to get a little volatile and moves down in these areas like the energies and Pulte Homes and the homebuilding stocks, these areas of the market actually do quite well. And the trend is still in an uptrend. So we see you get a big dip lower here. And this is really the benefit of VantagePoint’s tools here, is to adapt to the changing market conditions.
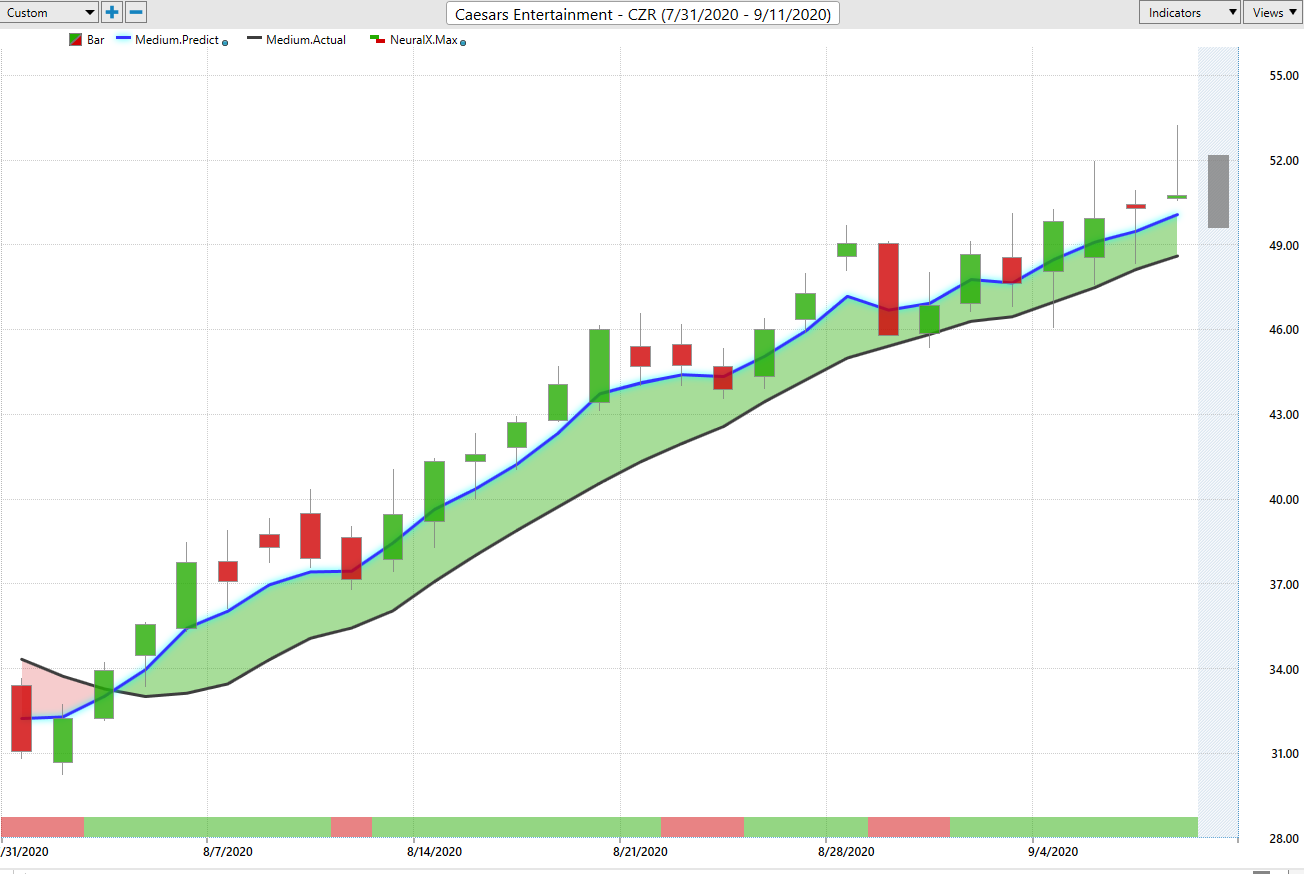
So when it recognizes that, hey, there’s been a big move. We came outside of the predicted range. Well, let’s understand what’s going on within those intermarket relationships and get back on track as far as forecasting future price here, and whether you should stay long and be looking to buy down at those predicted lows. Or if the trend shifts, like we saw in Pulte Homes, where you should get out of the way, look to short the market, or certainly take profit on your bullish positions there.
So here in shares of Caesars Entertainment, really nice move higher here. 45% rally in the last 25 trading days. So again, these areas of the market, these entertainment companies, actually doing quite well as far as the stocks are concerned, and some really profitable areas of the market to be paying attention to.
Shake Shack (SHAK)
Here is Shake Shack. Again, sort of in that same vein of brick and mortar things that are outside, really entertainment sort of companies here. Here’s Shake Shack with a crossover to the upside. Very clear strength over the course of this move. You get one blip of the neural index bearish. Here, forecast, this little bit of pullback that you’re seeing there. But overall, an extremely strong move as the market moves higher. And again, we can utilize those predicted high and low levels, and you see really nice entries at the beginning of the move.
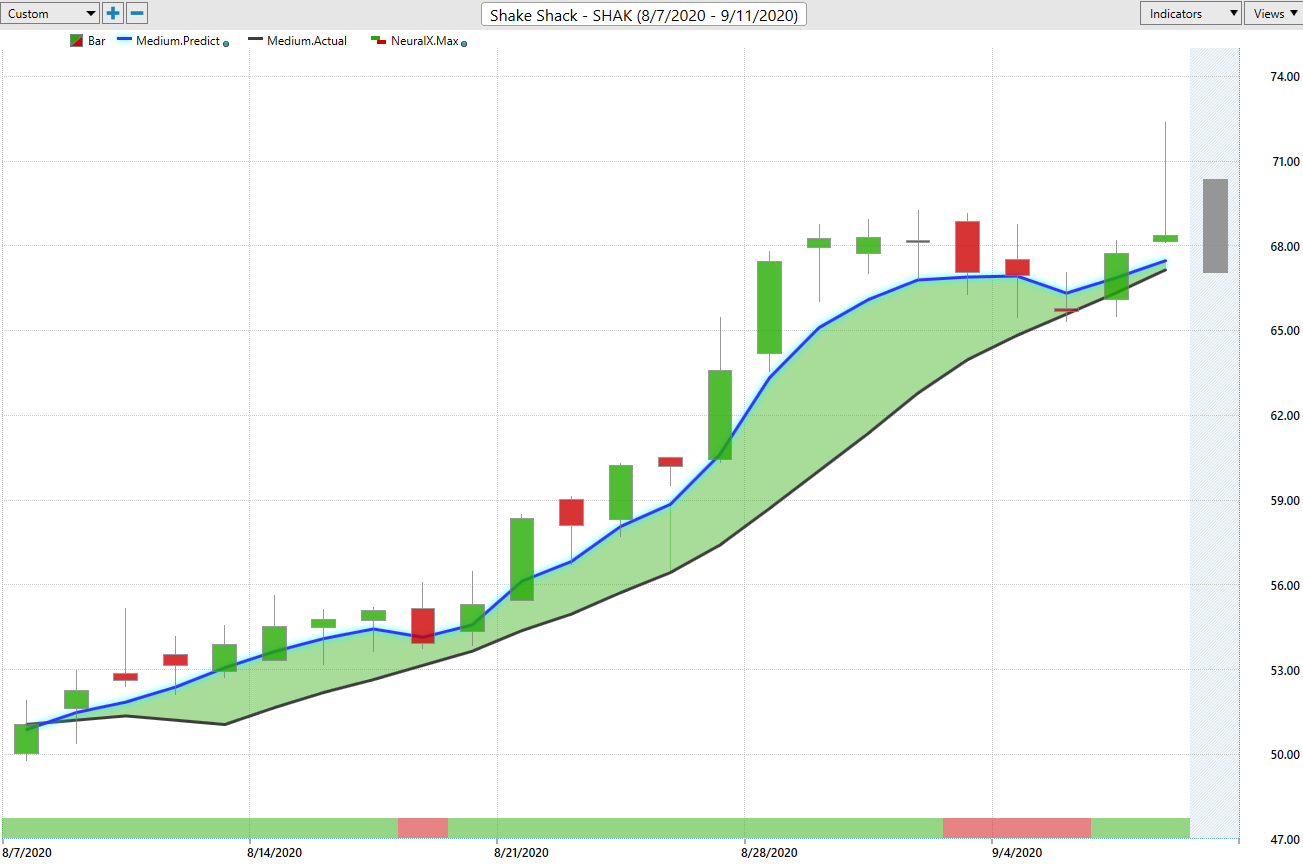
So rather than chasing the stock down and getting an entry up at these predicted highs, well, wait till you get down to these predicted lows, get a good fill, and then you don’t have to run as large of a stop loss to participate in that move. So you can minimize the risk that you take on your trades and really maximize that upside. So again, you get this pullback. Nice opportunity coming down here at these predicted lows, not chasing the market up at these prices. Actually, you see that takes some profit up at these predicted highs, if that’s where the market currently resides. So really nice move in shares of Shake Shack. Again, we can look at the overall move, see how much this has moved up in a short period of time. 28% rally in just the past 21 trading days. Pretty much a month on the calendar. Has you up about 28% there in Shake Shack.
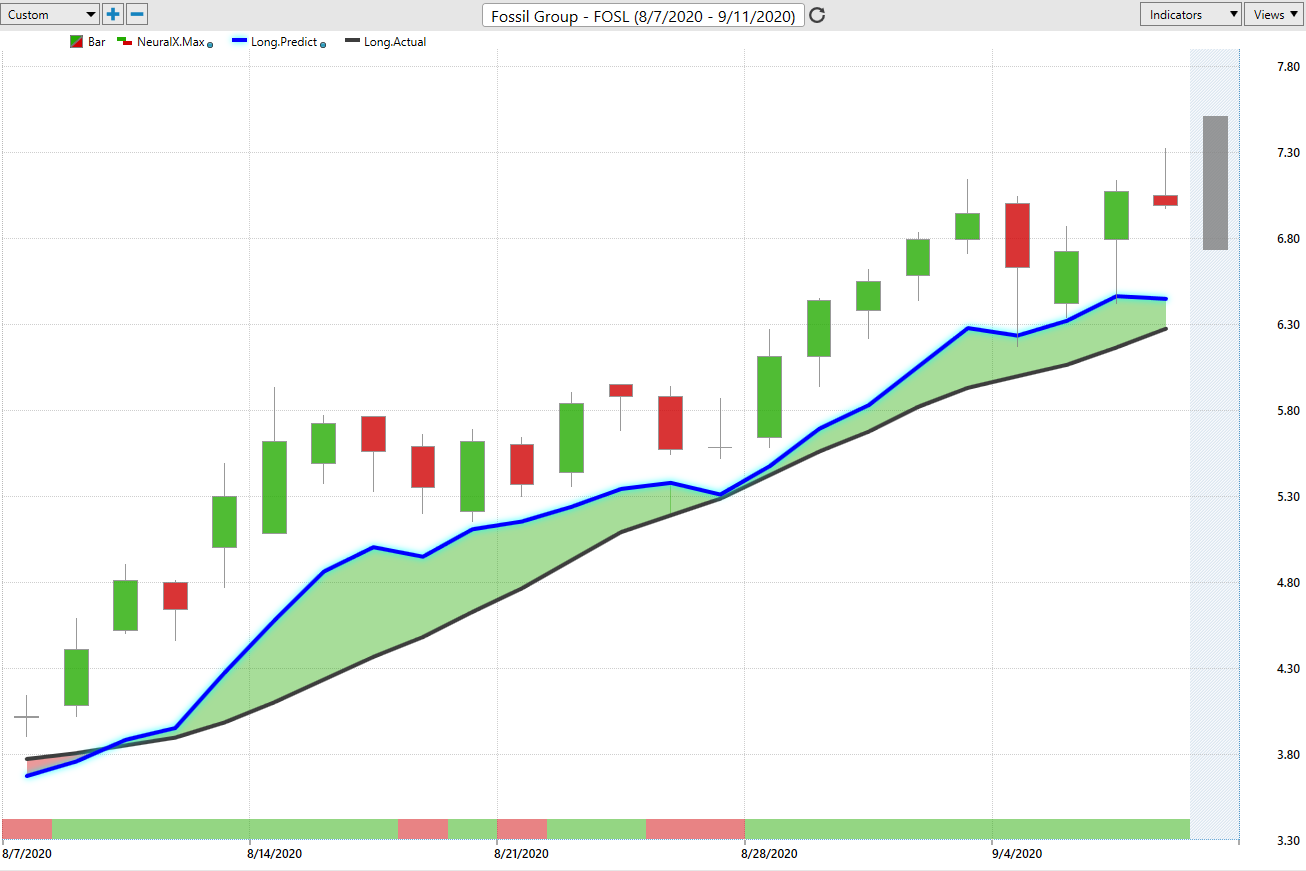
Fossil Group (FOSL)
And lastly here, Fossil Group. So company makes watches and wallets and these sort of things within a sort of retail shopping here. But crossover to the upside, this blue line crossing above the black line. A tremendous amount of separation between your blue and your black line, suggesting that this is a strong, established uptrend. We don’t get anywhere close to getting that cross to the downside. And again, you’ll see sort of the combination of these indicators. With the overall trend being up, neural index may get weak and say, hey, there’s some weakness, some sideways price action. But as long as that blue line’s remaining above the black line, if anything, those neural index are looking like signals to, look, buy on the dip, get some better prices with the help of those predicted highs and lows that update every single day. And you see some really nice levels to come in and scoop up more of a position. And just a absolutely huge move here. I think this is up over about a hundred percent as far as the overall move.
But what we can recognize, and this is really important, is recognizing when those shifts start to come in market. So what we saw was energies pushed lower, General Mills, the individual equities, as far as the S&P 500, started to trend to the downside, and that blue line crossed below the black line. And you can find those areas where that’s happening, but also recognize these other areas where it makes sense to initiate some long positions. And so what’s helped is really, again, recognizing sectors that are weak. And that’s really important for establishing a really diverse portfolio, that regardless of if we get a ton of volatility in stocks moving higher or lower, you’ve got the basket of stocks really working in your favor in the places where you’re making money, moving a little bit more so than in places that may be affected by the S&P 500 rattling up or down.
So this, once again, has been our Hot Stocks Outlook for September 11th, 2020. Thank you all for watching. Best of luck out there. And bye for now.


