


Register for a Free Live Training
The Hot Stocks Outlook uses VantagePoint’s market forecasts that are up to 87.4% accurate, demonstrating how traders can improve their timing and direction. In this week’s video, VantagePoint Software reviews forecasts for Marinemax ($HZO), Intel ($INTC), BLOCK ($SQ), American Axle and Manufacturing ($AXL), Kimberly-Clark ($KMB), and Ruth’s Hospitality Group ($RUTH)
Hello again, traders, and welcome back to the Hot Stocks Outlook for September 23rd, 2022. I hope y’all are having a excellent week out there in the financial markets and as always, plenty to cover here in today’s outlook. And if you haven’t already, make sure you click on the link below, get that live demonstration, learn how these tools, this technology of artificial intelligence can help you as the trader make better trading decisions each and every trading day and week here.
Now, we’re going to start out with shares of MarineMax, we’ll move forward through Intel block, a couple of the tech stocks. We’ve got American Axle, Kimberly-Clark and lastly, Ruth Hospitality Group.
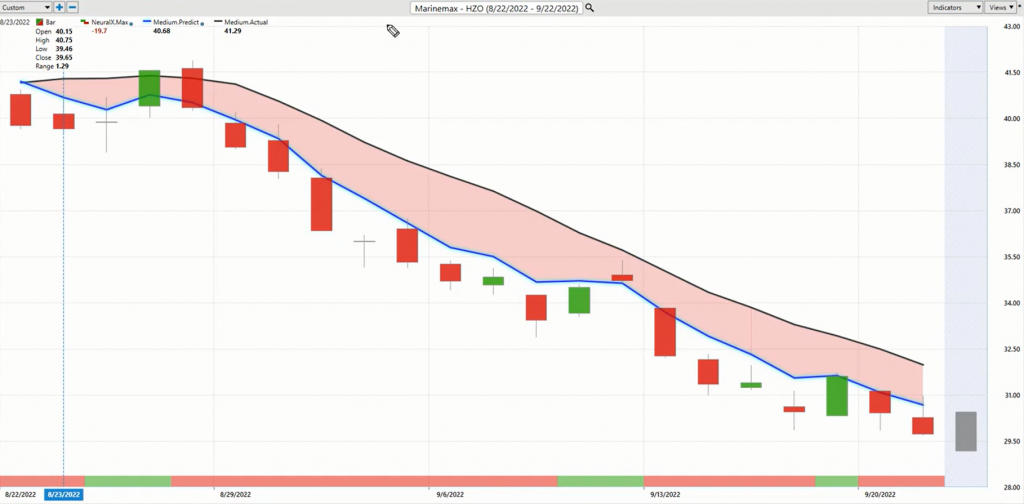
But starting out here with MarineMax, it’s a really good example of how this technology helps the trader make better trading decisions day in and day out. And so what you’re seeing here with each one of these candles is daily price action. That’s really how all of these tools work with the end of day data.
And so that’s representing a full and complete trading day, but right up against all that daily price action, you’ll see that there is a black line and also a blue line. Now, the black line that you’re seeing is a simple moving average. It’s a very common technical indicator and in this case, it looks back at the previous 10 closed prices, it’ll add those all together, divide by 10.
But the problem with tools like that is that they’re all looking back at what’s already occurred in the market. And so we use that as a baseline to let us know where market prices have already been. But what we’re really paying attention to is this blue line you see crossing below the black line. And for that number of that blue line, which is a predicted moving average, but for that number to get calculated and plotted for the trader each and every evening, this is where the technology of artificial neural networks are performing what’s called intermarket analysis. And what that means is it understands markets that are known to drive and influence the target market.
So specifically where you might be trading, in this case, MarineMax. And it’s going to look at things like the S&P 500, Dollar Index, crude oil prices. These big commodities and really macro-driven things that obviously have a huge effect on your portfolio. But it’s able to also understand a lot of the more subtle relationships that are going on between ETF groups and even down to the individual stock level. So this is very important. It takes all of this into account, and that’s really the data set that the artificial intelligence is using to generate these future predictions of where price is headed.
And it’s those price predictions that are used to really construct these indicators. So rather than having a rearward-looking tool, that’s really just summarizing, what’s already occurred in the market, you have a predictive tool that’s actually leading, and has a very high level of accuracy attached to its predictions. So when we look at that blue line crossing below the black line, you see you’ve gotten about a 27% decline just over the past 21 trading days in shares of MarineMax, but that’s not the entirety of the technology here.
So if we look at the very bottom of the chart, you’ll see that you have this bar that goes from green to red, back to green. And this is also indicator really generated via that artificial intelligence, but it’s tuned to solve a different problem for the trader. And this problem is short-term strength or weakness over what you can really look at as a 48-hour period, a couple of days of price action.
And so what you’ll notice here is as that neural index goes from red to green, you get some short-term strength in the market. You’re getting some higher highs over the subsequent 48 hours of price data, but you’ll also notice that there’s a lot of separation between that predicted moving average and the actual moving average, and it’s still solidly below the black line in this case. Now, as that neural index gets bearish, you see how the weakness accelerates. And so this very high level of accuracy attached to VantagePoint is linked to the accuracy of this neural index. And we can take that and combine it with the other tools here to get a very accurate view of what’s likely to occur in the marketplace.
So you see again, short-term strength, but as it goes bearish, a lot of weakness, persistent weakness, short-term strength, gap up, higher high, but persistent weakness here, especially as the forecast move to that bearish side. And it’s in this way that things are skewed so the trader can understand, “Okay, where are things especially weak? Where might things be especially strong?” But maybe more importantly is seeing that broadly across the market because we’re able to scan with these indicators and actually see when these big shifts occur and where these big shifts occur.
So let’s move forward.
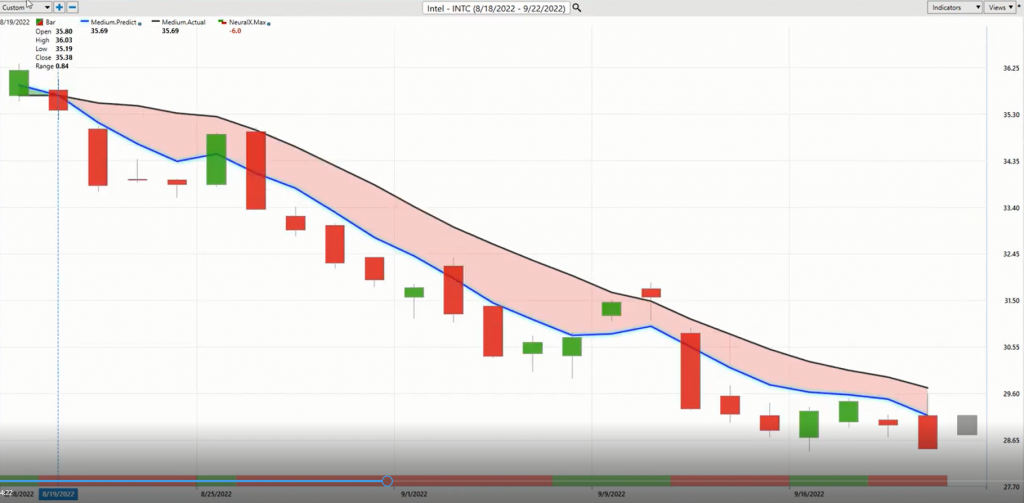
We’ve got shares of Intel and we’ve talked a lot about the tech space and how there’s been this persistent weakness and also dollar strength on the commodity and macro side of this. But here we see the blue and the black line, you see them getting right on top of each other that’s still likely going to come through this scan. It does go down to these decimal values, but neural index, very bearish. And it’s forecasting this weakness coming through all the way back in, well, that’s over a month ago now, but you can just see across the tech space that are you seeing this blue line cross above the black line? Well, no.
And as far as the portfolio, it becomes very clear where you may want to remain short or hedge other positions. So here you have a 20% decline over the past 23 trading days. And when you have this in a space like Intel, these are big markets. These are not little tiny tech or penny stocks or things like that. And you’re seeing much of the market still shifted to the downside and the software doing a good job of guiding you even through all this volatility.
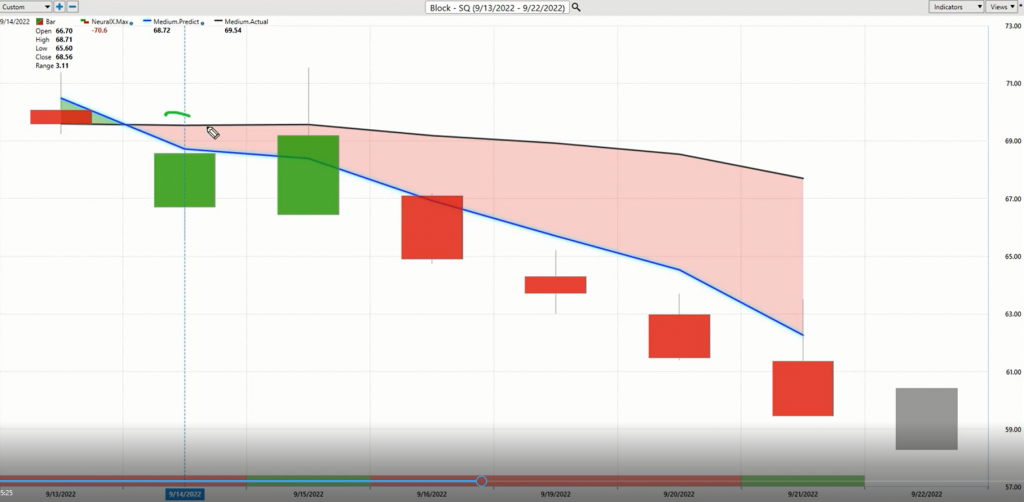
So here’s shares of Square and just more recently as we see more of the tech space moving to the downside, well, here’s over six trading days here, about six or seven trading days of Square crossover to the downside highlighting that the trend is moved to the downside, neural indexes bearish. You get a bump here with the neural index bullish, but it quickly goes back down to bearish. And this is what’s really important is not only do you have those tools of the predicted moving average and predicted neural index, but you’re even provided an intraday predicted high and low level.
So this can really act as levels to help the trader make better decisions as far as limit orders or profit targets as they express that position. So we can go ahead and bring up those predicted highs and low and you see how this works. As once you get that indication that, “Okay, the trend is now down,” you really want to look for these cells from the predicted high movements down towards the predicted low and keep expressing that position where possible. And so you see Square shares of Square here, seeing a pretty solid decline, but it becoming very clear that there’s some serious problems throughout the tech space, but stocks more broadly. And a lot of that’s related to things like the Dollar Index.
And so it becomes very clear how you can utilize a tool like this to accommodate for when this starts weighing on the portfolio and really make a lot of money as things accelerate to the downside if you’re able to short you see a 15% decline in the past five trading days and seeing things persistently bearish here. So a lot of distance between that predicted moving average and the actual moving average, you actually see a difference with about $6 a share there.
American Axle and Manufacturing ($AXL),
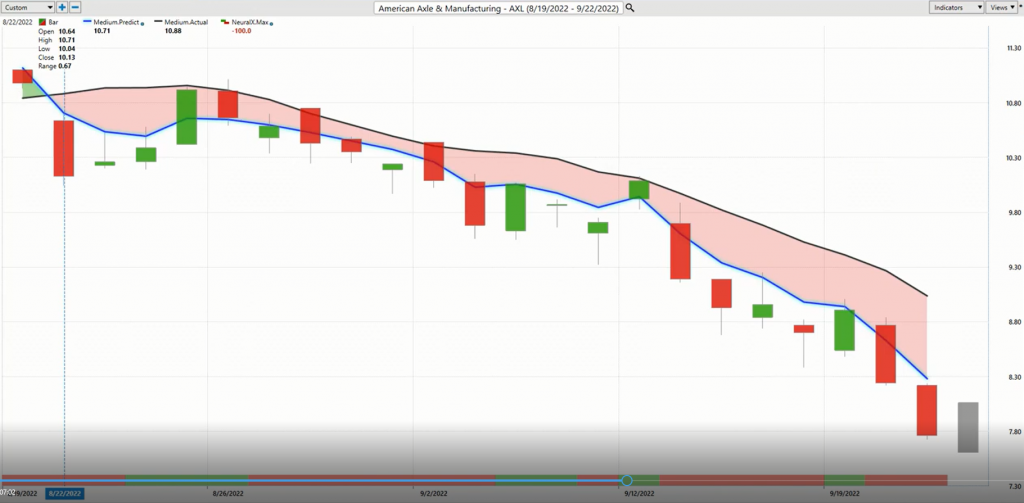
Now, let’s move forward, American Axle manufacturing, and again highlighting a lot of the broader market where there’s some weakness, but we can take a closer look at these short-term forecasts. Because that’s really what the trader’s going to use to make trading adjustments, increase position size, or decrease it, take profits along the way, and all these things that traders need to do. So you see this crossover to the downside, again, the whole sort of capital good space. You’re probably going to see a lot of this and a lot of persistent weakness, but notice how the neural index gets bullish here. And what it’s highlighting is over the next 48 hours expect that subsequent strength, but you clearly understand the bigger move it to the downside.
And as that neural index gets bearish, well, there you see that momentum pickup. And that’s where when you’re prepared for that as a trader, you can express that very efficiently. Here you see the neural index gets bullish and you see some sideways price action over those subsequent 48-hour periods, but still you want to express that position to the downside and make sure that you stay bearish.
And on a more granular level, we can take a look at the predicted highs and lows. And so you see how these act to really guide the trader moving forward is where you might want to take a short position, but also over the short-term where you might want to be covering. So where you can cover that position and look for better prices to reset shorts. And so overall, we got to really nice move lower here, and a lot of areas in the market where it makes sense you likely want to be short here. But about a 25 to 30% decline here over the past 19 trading days, again, just a couple 100 shares there would make you 600 bucks.
This is a very, very inexpensive stock, but there’s going to come a time where we start to see some opportunities to the upside and the software will do a good job of letting you know, “Hey, look, take profits on those shorts, maybe look to go long,” but seeing more broadly the market. We’re seeing those important areas start to shift and those inner market relationships start to skew, these forecast more bullish as opposed to more bearish.
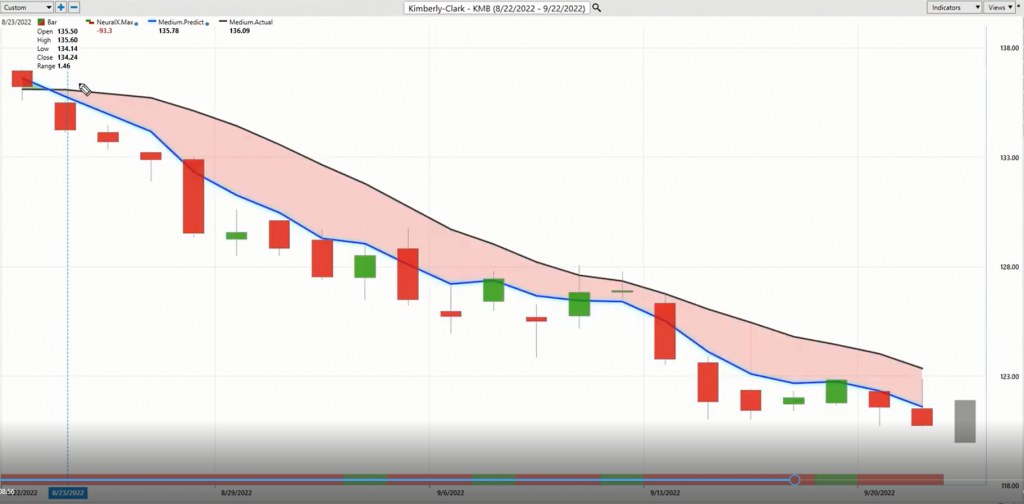
Here’s Kimberly-Clark. So again, just another example of a longer term opportunity here in the persistent weakness that you’ve seen in important areas of the marketplace. Crossover the downside, persistent weakness from the neural index, you see all that momentum picking up. And so traders can take some of even shorter-term tools intraday and say, “Okay, well, how do I want to express that short position day in and day out, as well as, of course, the predicted highs and lows?”
So knowing more on a daily timeframe if you get these moves up towards these predicted highs, that’s a good intraday level, and then certainly trade off of that momentum as things accelerate to the downside. But very clearly here you see this neural index, it goes bullish just barely hear a couple days, and you run sideways over that time period. And that’s where you see the market perking up and making these moves up towards the predicted highs, but you do not want to be long.
And clearly it makes sense to the very least have some hedges on that portfolio where you’re making money on the bearish side of things, because you’re just seeing things really way down stocks. I joked last week, you had the not stocks outlook because you can see this very broadly, especially as you use this tool day in and day out and see how much of the market is bullish and how much is pivoting to the downside and really getting into strong bearish situations.
Ruth’s Hospitality Group ($RUTH)
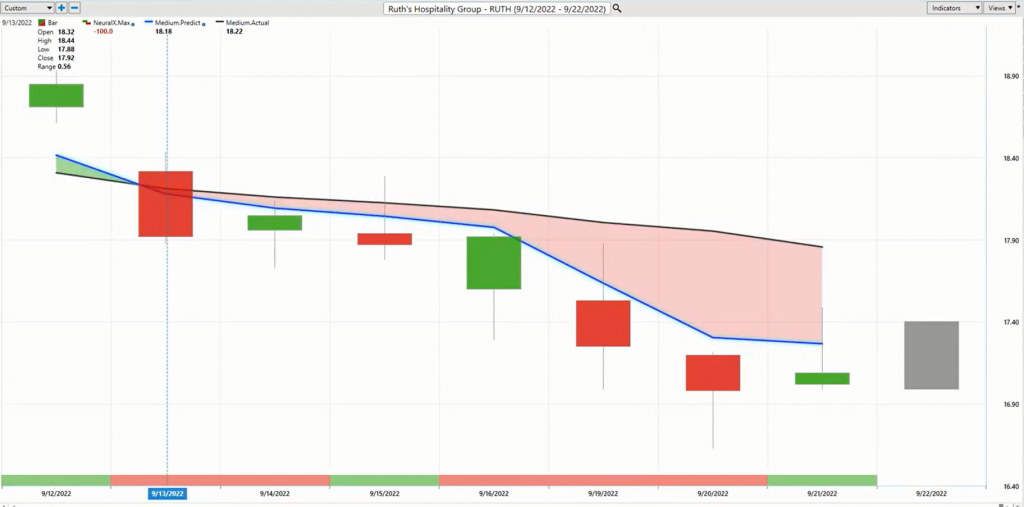
Lastly here, here’s Ruth Hospitality Group. Again, we’ve seen some volatility, but when you have your software and you start seeing all these IntelliScan crossovers move to the downside and indicate that even more of the market is bearish here. So in the short-term, how might you want to approach something like this? Well, of course, look towards the predicted highs.
Predicted highs are a good place to stake out a position. And you’ll see things like this all the time. If you look very closely how you have these predicted lows here, these previous days, and how the market tends to gravitate towards those levels, and you see some strength come in. But, of course, you clearly hear neural index even after that bullish day stays bearish, that bigger move to the downside. You see it again here.
All the bearishness takes place this day, but we still have those levels up there. And sure enough, they get hit and then the bigger move starts moving to the downside. When you understand that and can be prepared for that, well, there’s some really fantastic opportunities where you can target that bearishness, take some pieces out of the market, and really benefit as we’ve seen volatility really heat up and things start to shift. We’ve seen very important market shifts take place and you want your strategies to really be prepared to make money over that.
So here about a 10% decline just over the past six trading days, but even more short-term, again, these bigger chunks to repeatedly take out of here. So we’ll go ahead and leave it there. But once again, this has been the Hot Stocks Outlook for September 23rd, 2022. Thank you all for watching, best of luck out there, and bye for now.


