We find ourselves about six weeks into the government’s fiscal year 2024, and I’ve got to tell you, if this year is anything like the last one, we’re in for a wild ride. The federal government is racking up debt like there’s no tomorrow, and it’s truly astonishing. According to the September Monthly Treasury report, the U.S. government added a jaw-dropping $1.7 trillion in debt for the 2023 fiscal year, which ended on October 31. That’s up by a staggering $319 billion, or 23 percent, from the previous year, 2022. Just think about that for a moment. We’re talking about a massive increase here!
But here’s the kicker, folks. Some mainstream analysts are saying that this $1.7 trillion figure might not be the whole story. You see, the Treasury Department pulled a little accounting trick by counting the cancellation of the student loan forgiveness program as a windfall for federal revenues. That shaved about $300 billion off the deficit, making it look like we didn’t pile up as much debt as we really did. So, when we cut through the smoke and mirrors, it seems like our deficit might have doubled from 2022 to 2023, going from about $1 trillion to $2 trillion. That’s a whopping 100 percent increase, not the 23 percent they want us to believe.
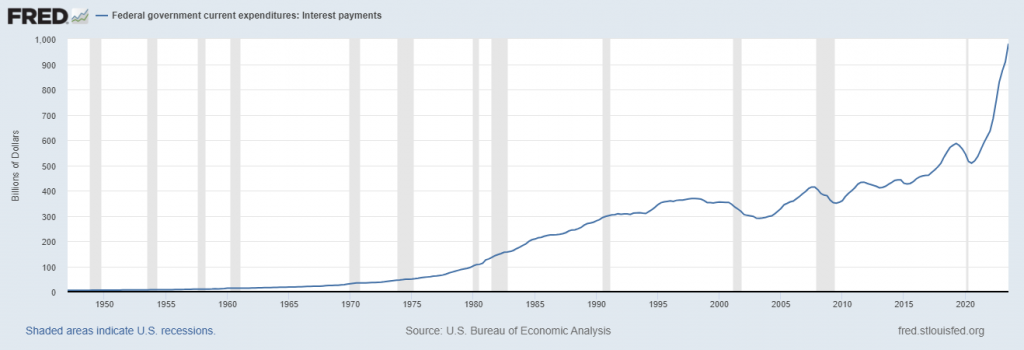
My concern is very basic. The Fed and the current administration is claiming we have a strong and resilient economy. If that is in fact the case, should we not see tax revenues to the government increasing? Study the following chart created by the St. Louis Federal Reserve. What I immediately focus on when I look at the chart is that all instances of reduction of tax revenue to the government of 15% or greater has always resulted in a recession or worse in the economy.
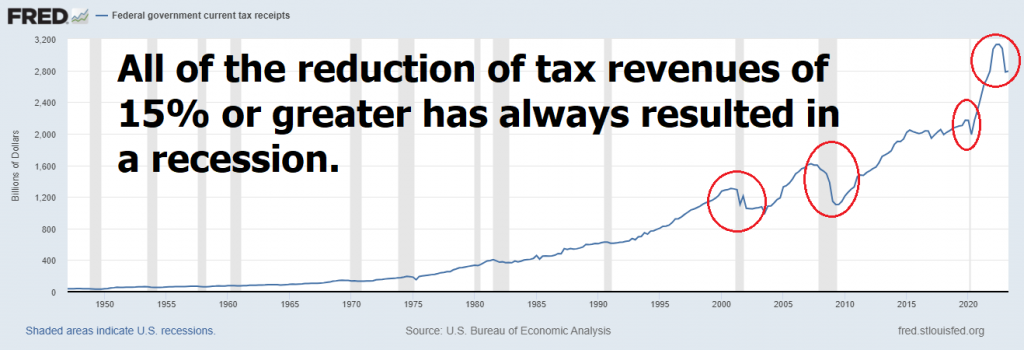
The point that I’m making is that tax receipts are reduced when businesses are having trouble generating profits. Federal revenue is primarily generated through income taxes from individuals and businesses, payroll taxes collected from employees and employers to fund social insurance programs, corporate taxes on profits, value-added taxes or goods and services taxes applied to consumption, excise taxes on specific goods, customs duties and tariffs on imports and exports, estate taxes on inherited wealth, capital gains taxes on asset sales, and property taxes collected by local governments. When tax revenues decrease it is primarily because the private sector is not prosperous and there is less that can be taxed. Look at the chart from the opposite perspective and you will arrive at the same conclusion: show me a time when tax receipts to the government were down and the economy was ‘vibrant’ and ‘resilient.’
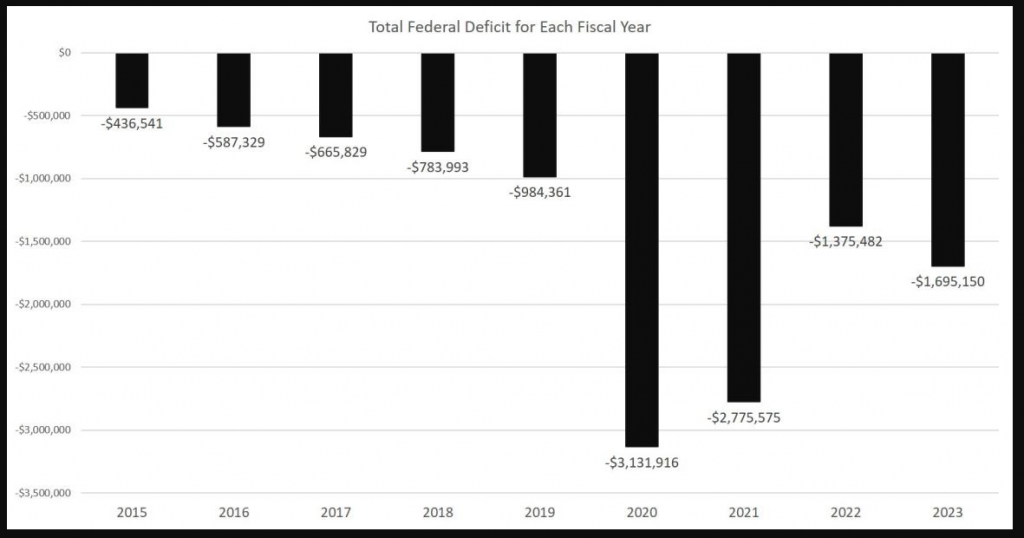
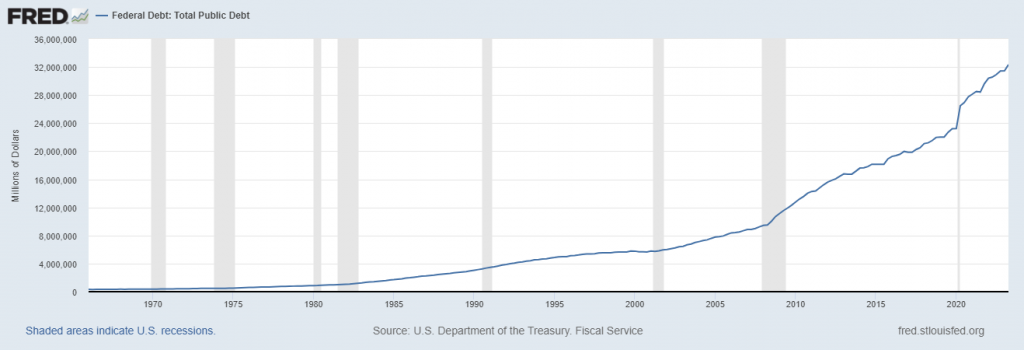
Now, let’s put this into perspective. We’re heading back towards the massive deficits we saw in 2020 and 2021 when the government was spending like there was no tomorrow to keep the economy afloat during those dreaded lockdowns. And guess what? Our national debt, the sum of all those yearly deficits, has now skyrocketed to almost $34 trillion! That’s more than $6 trillion added since the start of the Covid Panic and a whopping $18 trillion since the 2008 financial crisis. It’s a mind-boggling number. I find the number more toxic when I recall that we were promised and reassured by former Fed Chairman Ben Bernanke that the Fed was adding $600 billion to add liquidity to the economy as a ONE TIME MEASURE back in 2009.
Here is a chart of Federal Deficits on an annual basis going back to 2015.
In the current year, corporations have already outlined a staggering 604,514 job cuts, marking a remarkable 198% surge compared to the 209,495 cuts reported up to September 2022. This figure represents the most significant number of job reductions within the January-September period since 2020, a year marred by the unprecedented impacts of the COVID-19 pandemic, which saw a staggering 2,082,262 job cuts. Beyond the exceptional circumstances of 2020, this year’s total stands as the highest for the January to September period since the aftermath of the 2008 financial crisis in 2009. Yet, despite these horrific job cuts. declining tax revenue, ballooning deficits, a banking crisis we are being told the economy is strong. If this is strong, I don’t want to see weak!
But here’s what really gets me going, and I think you’ll find this interesting too. There’s this thing called “yield curve control” (YCC), and it’s becoming quite the topic of conversation. You see, our central banks, the folks in charge of our money, are trying to fix all these problems, but it seems like they’re just making things worse.
Yield curve control is when central banks try to control interest rates (the cost of money) and the cost of borrowing. They pick a certain interest rate they want and then they buy or sell government bonds to keep it at their desired level.
They’re basically printing money and messing with the economy, and it’s not working out too well.
Economists like to argue about semantics. Many would argue that what has been occurring since the Great Financial Crisis in 2008 is not Yield Curve Control. Interest rates are the pivotal factor in free market capitalism, influencing capital allocation, investment choices, and consumer behavior. Lower rates encourage borrowing and spending, fostering economic growth, while higher rates deter investment and curb inflation. Additionally, interest rates play a significant role in valuing financial assets and shaping market dynamics within a capitalist system. When interest rates are being manipulated for the benefit of the greater good, call it whatever you will but you are no longer engaged in the practice of capitalism.
The last time we saw something like this was back in 1942, during World War II, when the U.S. government was drowning in debt. The Federal Reserve capped interest rates to keep borrowing costs low, and they ended up losing control of their balance sheet and the money supply. It was a desperate move, and it’s starting to feel like history is repeating itself. After all, the government is drowning in debt and funding two proxy wars, all the while claiming we have a strong economy.
But here’s the thing about yield curve control: it’s the end of any “free market” activity in our financial system. It’s the central planners telling us how much our money is worth and what it costs to borrow. It’s like they’re trying to patch up a sinking ship with duct tape.
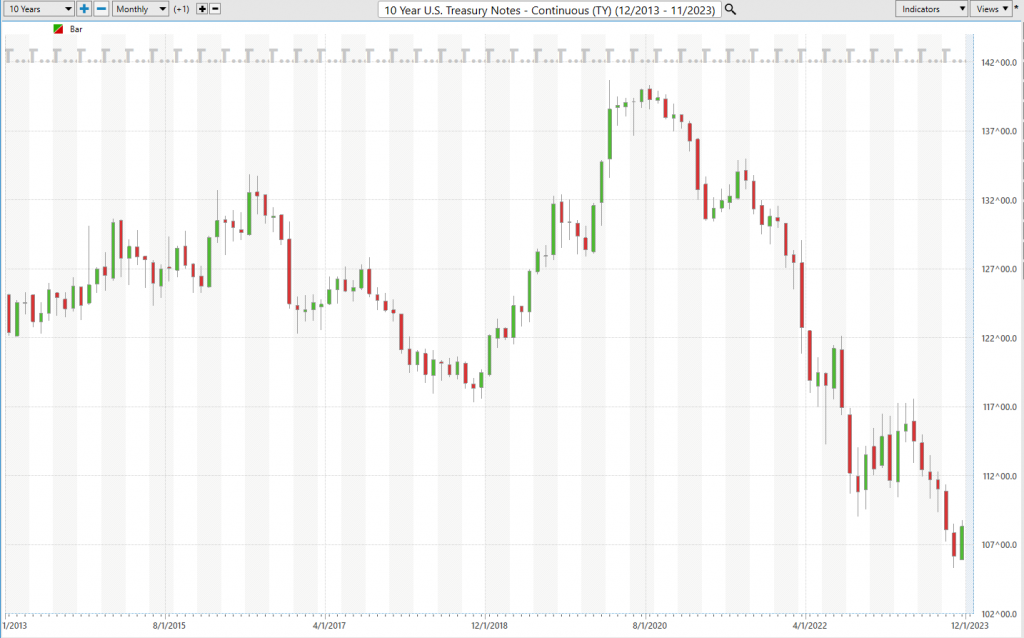
Throughout this year we have reported on multiple occasions the toxic nature of Federal Treasuries. It’s nothing personal. It’s math. When the 10-year Treasury is yielding 4.6% to evaluate its place in your portfolio you must compare it to the expected future rate of inflation. While the CPI report has recently published a 3.7% print, I have little to no faith in the accuracy of that metric. Every time I go shopping, my experience is that inflation is significantly higher than what the government numbers are reporting. Draw your own conclusions based upon your own experience.
Yield Curve Control is here for one reason. The government cannot afford to pay higher interest on the national debt.
Here is a chart of the 10-Year Treasury Note. I have written extensively about treasuries being toxic assets.
You can read previous articles on this theme here.
Are We Witnessing the Beginning of a Sovereign Debt Crisis Internationally?
De-Dollarization, Sovereign Debt and Why It Matters!
Where Are The Safe Havens? Risk, De-Dollarization and The Bond Rating Agencies
We’re in the midst of a financial earthquake, and widows, orphans, and retirees are getting crushed.
The value of Treasury bonds have nosedived by 46%, and the 30-year Treasury has lost 53%. This is a cataclysmic collapse, and it’s having a devastating impact on those who rely on Treasury bonds for a steady income. But that is just the tip of the iceberg.
Treasury bonds are supposed to be safe. They’re backed by the full faith and credit of the United States government, and they’re considered to be the lowest-risk investment in the world. But that’s not the case anymore.
The reason for the collapse is simple: interest rates are rising. When interest rates go up, the value of existing bonds goes down. This is because investors can buy new bonds that offer higher yields.
For widows, orphans, and retirees, this is a nightmare. They’re living on fixed incomes, and they need their money to last. But with Treasury bond prices crashing, they’re seeing their savings evaporate.
This is a wake-up call for everyone. Treasury bonds are not the safe haven they used to be. If you’re relying on Treasury bonds for income, you need to start thinking about other options.
I want you to think about the following.
- If you had put your life savings into Treasuries in March of 2020, you would be down 46%.
- If you had put your life savings into bitcoin when it made its all-time high at $68,450 you would still be outperforming Treasuries.
I’m not offering that comparison to entice you into Bitcoin. Rather, I’m simply demonstrating that Treasuries which have long been considered the gold standard for savers, have not been able to outperform the worst-case timing scenario, when compared to the massive volatility and risk traditionally associated with bitcoin. We are comparing two completely different asset classes. The only conclusion we can draw is that there is a bloodbath in Treasuries and that reality should help determine your best move moving forward.
The market cap of the U.S. Treasury market is estimated to be $24 trillion. Looked at another way, Treasury Bond investors are sitting on over $16 trillion of open losses over the last 3 ½ years. The government has quite the challenge in front of them to entice investors back into trusting the viability of investing in Treasuries based upon their performance over the past 3 ½ years. The consequences of what happens in the Treasury market will reverberate throughout the economy.
Yield Curve Control (YCC) may sound like a fancy financial tool, but its implications can be quite significant. But here’s where it gets interesting: interest rates aren’t one-size-fits-all.
However, YCC isn’t without its risks. Once it starts, it’s challenging to stop. If plans change suddenly, it can create confusion in the financial markets, impacting housing prices and stocks. Moreover, excessive government control can lead to problems like inflation or bubbles in asset prices.
So, as we watch the central banks roll out these yield curve control policies, remember that it’s a sign that something is seriously wrong. We’re witnessing the next chapter in the global monetary experiment, and it’s not looking good. Central banks will do whatever it takes to stabilize things, but it’s likely to lead to even more monetary debasement.
Let me tell you a story that’ll leave you scratching your heads and pondering the state of our economy. WeWork, the giant in shared office space, just took a tumble this week and filed for bankruptcy. This isn’t your run-of-the-mill company. We’re talking about a real estate behemoth with a sprawling empire, boasting a whopping 44 million square feet of office space across a mind-boggling 779 locations worldwide. But guess what? This collapse isn’t just a business tale; it’s a stark reflection of the harsh realities facing our labor market and the broader economy. It’s also a scathing indictment of the commercial real estate sector, which many saw as a pillar of stability. And if you cast your mind back, you’ll remember that, at its zenith, WeWork was strutting around with a market capitalization that could make your head spin – a staggering $47 billion.
Now, let’s get down to brass tacks. WeWork decided to play the Chapter 11 bankruptcy card and set up shop in New Jersey. Their game plan involves hammering out deals with most of their secured creditors and trimming down those leases that weren’t exactly their bread and butter. But make no mistake, the ripple effects of this bankruptcy are sweeping far and wide, extending their reach into the U.S. and Canadian corners of WeWork’s empire. And when you take a gander at their preliminary financial disclosure, you’ll see a jaw-dropping $18.65 billion in liabilities glaring back at you, starkly contrasting with their $15.06 billion in assets.
Now, this is nothing short of a monumental meltdown – a dramatic collapse of value that’ll leave you chuckling ruefully. I mean, how does a single company obliterate nearly $50 billion in perceived valuation in the blink of an eye?
But let’s cut to the chase, as I’ve said time and again in my previous analyses. This isn’t rocket science; it’s just plain old math. When you crank those fiscal deficits up to the max, pile on a mountain of debt, inflate a liquidity bubble that’s bigger than Texas, and then jack up interest rates while financing not one, but two wars – well, you’ve got a recipe for economic fireworks that can’t be ignored. It’s like getting an economics PhD delivered straight to your inbox every morning.
But this WeWork bankruptcy isn’t just a financial fiasco; it’s a glaring warning sign flashing over the commercial real estate sector. The demand for office space has taken a nosedive in the post-COVID era, and it’s happening just as the colossal “everything bubble” is starting to deflate.
So, here’s the takeaway, with interest rates perched at 5% and the Federal Reserve dialing down its liquidity support, there’s no escaping when this financial contagion inevitably sweeps through.
Sure, governments and central banks can pull some rabbits out of their hats, but let’s not kid ourselves – they’re not invincible. While some may be true believers in long-term stock market uptrends, sooner or later, the unrelenting realities of life will catch up with us, and something’s got to give.
So, when you hear talk of a “soft landing,” go ahead and have a chuckle for me, because it’s as rare as a unicorn on Wall Street. I’ll keep beating this drum and I urge you all to approach the solution of Yield Curve Control with a healthy dose of skepticism.
Remember, in the world of trading, everyone’s a speculator. And when bonds lose 46% of their value in just 30 months, you better believe that everyone is scrambling for a safe haven.
So, what’s your plan? What’s your solution? In a sea of information, your only loyalty should be to the trend.
My analysis may be right, it may be wrong, but that’s why I rely on Artificial Intelligence, Machine Learning, and Neural Networks to assist with my trading decisions. The one certainty I have is that the Fed and the Treasury will continue to debase the currency.
One of the biggest challenges for a well-informed trader and investor is recognizing that your only loyalty should be to the trend. In your trading career, what will occur thousands and thousands of times is coming across information that seems important and significant, and your job is to determine how it relates to your understanding of the current trend.
As I write these words, only 33% of all stocks are trading above their 200-day moving averages. Inversely stated, that means that 67% of all stocks are trading below their 200-day moving averages. How do you go about finding the stocks with the best risk/reward potential?
When it comes to trading, you need to control three things: How big do I trade? How long do I trade? What do I trade? Against this backdrop, you must quickly differentiate between what should occur versus what is occurring and then clearly define the opportunity.
The only thing that matters in trading is what the price does. Everything else is just noise. This is one of the hardest lessons for traders to comprehend because they expect harmony between what is reported in the news and how a market behaves.
Nothing could be further from the truth.
I want to propose that, just as Wall Street fixates on the position of the yield curve, you as a trader should focus your attention on how artificial intelligence defines the trend and the best move forward.
Don’t equate headline news with the market you are trading. Don’t try to make sense of what the financial media is reporting on the economy with what you are trading.
The only thing you want to know as a trader is UP, Down, or sideways. Everything else is just noise. And that, my friends, is no easy task. That’s why I recommend that you learn about artificial intelligence trading software to help improve your trading results.
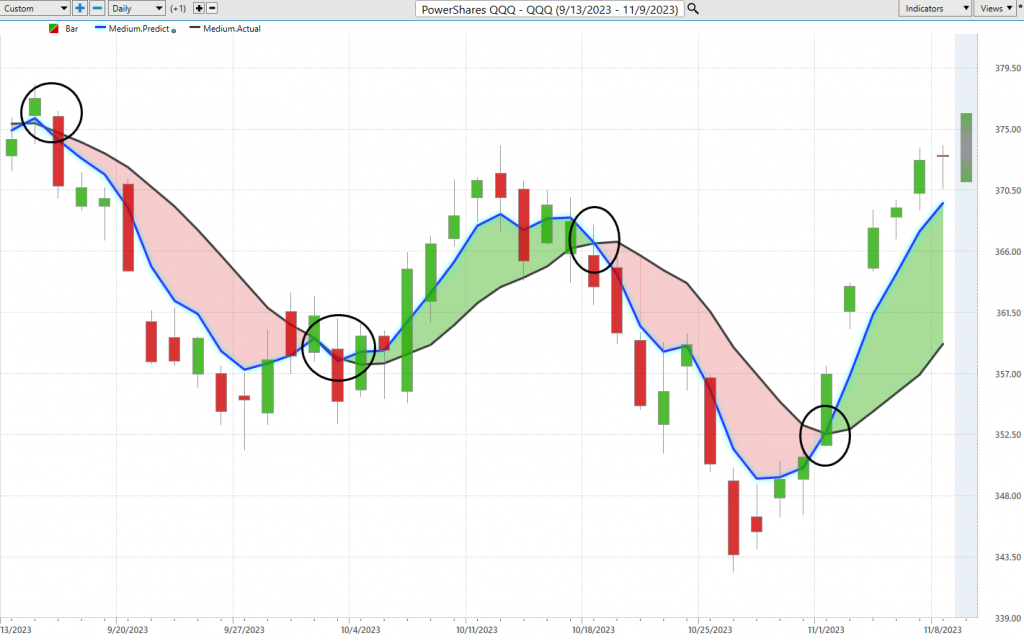
One picture is worth a thousand words. Here are the golden rules for using predictive AI. The slope of the blue line defines the trend. If the slope of the blue line is up, the trend is up. If the slope of the blue line is down, the trend is down.
Here’s a recent chart of the NASDAQ $QQQ over the last two months. The trend is clearly defined each and every day.
But all that being said, the only thing that matters NOW is:
What am I trading?
What is the trend?
How much do I commit?
How long do I stay in?
In other words, don’t let an opinion get in the way of your trading.
Define the trend.
Define your risk.
And recognize that change will continue to happen faster and faster.
A.I. is the framework where risk and opportunity are very clearly defined.
Remember, artificial intelligence has decimated humans at Poker, Jeopardy, Go! and Chess. Why should trading be any different?
Visit with us and check out the A.I. at our Next Live Training.
Discover why Vantagepoint’s artificial intelligence is the solution professional traders go-to for less risk, more rewards, and guaranteed peace of mind.
It can be as easy as Up, Down, Sideways.
It’s not magic. It’s machine learning.
Make it count.
THERE IS A SUBSTANTIAL RISK OF LOSS ASSOCIATED WITH TRADING. ONLY RISK CAPITAL SHOULD BE USED TO TRADE. TRADING STOCKS, FUTURES, OPTIONS, FOREX, AND ETFs IS NOT SUITABLE FOR EVERYONE.IMPORTANT NOTICE!
DISCLAIMER: STOCKS, FUTURES, OPTIONS, ETFs AND CURRENCY TRADING ALL HAVE LARGE POTENTIAL REWARDS, BUT THEY ALSO HAVE LARGE POTENTIAL RISK. YOU MUST BE AWARE OF THE RISKS AND BE WILLING TO ACCEPT THEM IN ORDER TO INVEST IN THESE MARKETS. DON’T TRADE WITH MONEY YOU CAN’T AFFORD TO LOSE. THIS ARTICLE AND WEBSITE IS NEITHER A SOLICITATION NOR AN OFFER TO BUY/SELL FUTURES, OPTIONS, STOCKS, OR CURRENCIES. NO REPRESENTATION IS BEING MADE THAT ANY ACCOUNT WILL OR IS LIKELY TO ACHIEVE PROFITS OR LOSSES SIMILAR TO THOSE DISCUSSED ON THIS ARTICLE OR WEBSITE. THE PAST PERFORMANCE OF ANY TRADING SYSTEM OR METHODOLOGY IS NOT NECESSARILY INDICATIVE OF FUTURE RESULTS. CFTC RULE 4.41 – HYPOTHETICAL OR SIMULATED PERFORMANCE RESULTS HAVE CERTAIN LIMITATIONS. UNLIKE AN ACTUAL PERFORMANCE RECORD, SIMULATED RESULTS DO NOT REPRESENT ACTUAL TRADING. ALSO, SINCE THE TRADES HAVE NOT BEEN EXECUTED, THE RESULTS MAY HAVE UNDER-OR-OVER COMPENSATED FOR THE IMPACT, IF ANY, OF CERTAIN MARKET FACTORS, SUCH AS LACK OF LIQUIDITY. SIMULATED TRADING PROGRAMS IN GENERAL ARE ALSO SUBJECT TO THE FACT THAT THEY ARE DESIGNED WITH THE BENEFIT OF HINDSIGHT. NO REPRESENTATION IS BEING MADE THAT ANY ACCOUNT WILL OR IS LIKELY TO ACHIEVE PROFIT OR LOSSES SIMILAR TO THOSE SHOWN.