| This week’s analysis is on the 52 Week High and Low Boundaries |
We’re diving deep into the heart of the financial markets, where traders and investors navigate a complex landscape using a plethora of tools. Among them, there’s one you simply can’t ignore: the 52-week high and low boundary. It’s not just another fancy indicator; it’s a game-changer for anyone playing in the market. Let’s break it down and see why it’s such a big deal.
Defining the 52-Week High/Low
The 52-week high/low, it’s a critical piece of the puzzle. This little number tells us the highest and lowest prices a security, like your favorite stock, has hit over the past year. This isn’t just any statistic; it’s a performance metric in the arsenal of traders and investors. It gives you the lowdown on a stock’s recent performance and a sneak peek into its future moves.
Another way to think of this metric is as a method to determine who is winning and who is losing in the stock market.
Now, pay attention, traders, because this is gold:
Resistance and Support Levels: That 52-week high, it’s like a fortress wall. Stocks often struggle to break through it. It is the highest price that the stock has traded in its last 52 weeks. Meanwhile, the 52-week low is your safety net, a support level that will usually catch a falling stock. Traders use these levels to gauge their moves. The importance of these levels lies in monitoring how the stock reacts and responds when it approaches these critical price points.
Companies, their employees and investors are very aware of how their stock is performing at all times. When they make new 52-week highs it is also perceived as a vote of confidence by participants in the company’s recent reporting and management’s decision making. Likewise, the inverse is also true, that when a stock makes new 52-week lows, it is a vote of no confidence in the company, management, and recent decision making.
Every week whenever we do a stock study, we analyze the 52-week boundaries very closely to see how the stock has performed. More importantly, we monitor it by defining at what percentile the stock is trading in its 52-week range. You can quickly calculate this yourself by simply doing the following math:
First compute the annual range: To do this simply subtract the 52-week low from the 52-week high. This will be the denominator in your equation.
Next, subtract the 52-week low from the current price of the stock. This will be the numerator in your equation.
We also refer to this equation as the CHANGE/RANGE.
Example:
The 52-week high is 100.
The 52-week low is 65.
The current price is 95.
To calculate the change, we subtract 65 (the 52-week low), from the current price of 95 = 30.
So, the change is 95-65=30
The range is 100 minus 65 = 35
So, we have 30/35 = 85.7%. Based upon this data we understand that this asset is trading at its 85.7 percentile of the last 52 weeks. This percentile can then be easily compared to other stocks, indexes, or investment opportunities.
Entry and Exit Points: You want to time your entry and exit perfectly, right? Well, the 52-week boundary helps with that. Imagine buying a stock as it breaks through its 52-week high or selling when it dives below the 52-week low. It’s all about riding that momentum.
Stop-Orders: Managing risk is the name of the game. Use stop-orders to set your boundaries. When the price breaches a specific level, boom, your trade gets executed. It’s like having a safety net.
The Significance of Closing Prices
Now, here’s a crucial nugget of wisdom: the 52-week high/low is all about closing prices. Stocks can go wild during the day, touching that high or low, but what really matters is where they close. If a stock can’t hold its new high or low by the closing bell, it’s telling you something about market sentiment.
Market Behavior Surrounding 52-Week Highs and Lows
Picture this: when a stock flirts with that 52-week boundary, the trading volume often explodes. It’s like bees swarming honey. Research backs this up, showing that traders get all worked up when prices dance near those critical levels. Everybody wants to be on a winning trend and a stock that is making new 52 week highs is clearly winning.
**52-Week High/Low Reversals**
Pay attention to those 52-week high intraday reversals, folks. When a stock hits a new high during the day but ends up in the red, it might’ve peaked. We call this a “shooting star” formation, signaling a potential downturn.
Institutional players, the big boys in the market, use 52-week highs to focus on stocks that are poised to make big moves. On the flip side, they employ 52-week lows to set stop-loss levels, safeguarding their gains.
**Market Sentiment and Trend Reversals**
Now, here’s the kicker: a 52-week high usually screams bullish sentiment. Investors want to lock in those gains, so they sell on strength, leading to pullbacks and trend reversals.
Conversely, when a stock hits a new 52-week low intraday but doesn’t close there, it might be time to look for opportunities. This often happens alongside a “hammer” candlestick formation, causing short sellers to scramble and bargain hunters to make their move.
What we recommend that traders do when monitoring the 52-week high or low is to also calculate how far on a percentage basis the stock is from both the percentage high and low.
**Real-World Example**
Let’s put this into practice, shall we?
Recently we did a stock study on Uranium Energy Corporation. One of our key filters in stock selection is looking for stocks that have either broken out and successfully breached the 52-week highs or are approaching their 52-week highs. From this short list we then use our ai trading software to apply machine learning and neural networks to the trends with the highest probabilities of success.
Here is the first chart of Uranium Energy Corporation when we began our analysis and began our trading decision-making process.
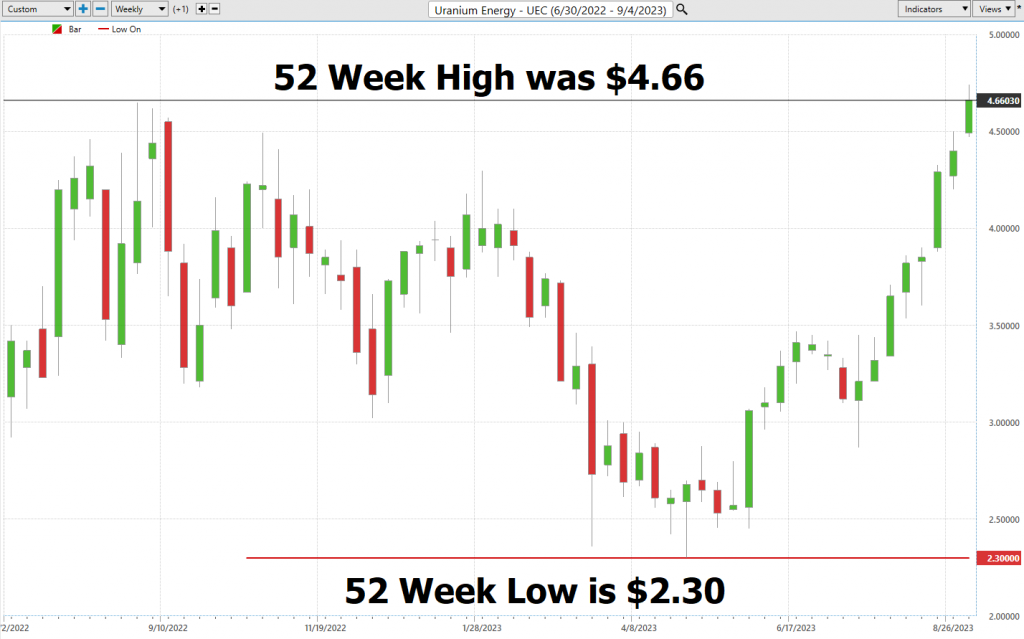
You can see that $4.66 acted as a very strong resistance point over the previous 52 weeks. Price originally failed at $4.66 and fell to as low as $2.30 making a new 52 week low.
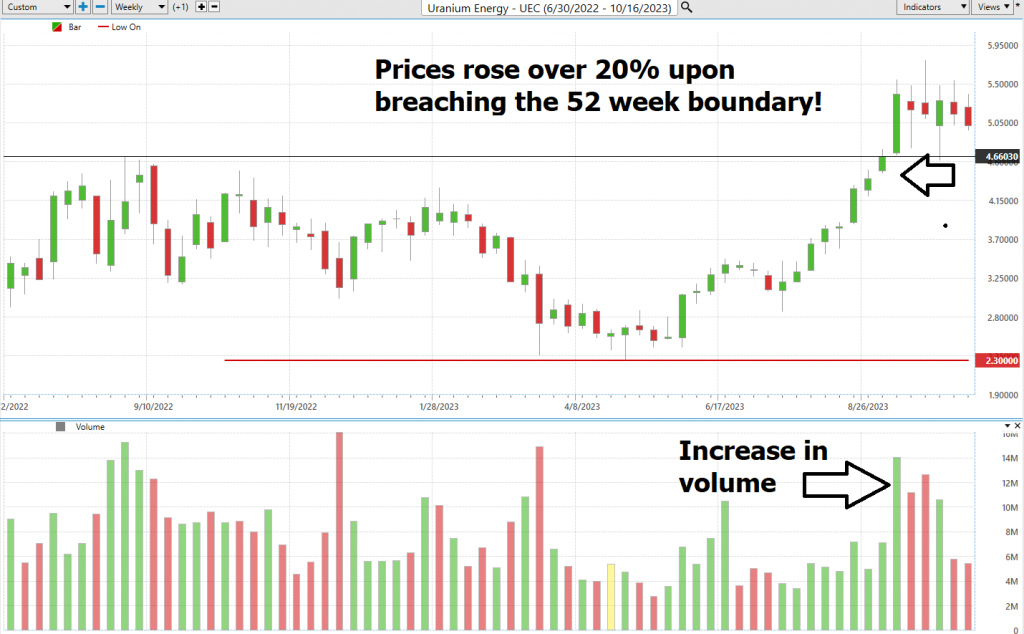
Prices tested the 52-week low of $2.30 four times before reversing and slowly moving into an uptrend. Thirteen weeks later prices once again challenged and eventually breached the 52-week high on significantly higher than normal volume. Prices rallied an additional 20% after successfully breaking the 52-week high of $4.66 which is currently acting as strong support.
So, there you have it, folks. The 52-week high and low boundary isn’t just another fancy chart point; it’s a powerful analytical trading tool. It empowers traders and investors to make smart decisions, using historical price data to predict potential moves and fine-tune their portfolios.
These boundaries are like guardrails, helping investors assess a stock’s performance. When a stock crosses its 52-week high, it can signal potential growth, and when it drops below the 52-week low, it might spell trouble. These boundaries provide valuable insights for making trading decisions and managing risk.
Remember, knowledge is power, especially in the world of finance.
It’s not magic.
It’s machine learning.
Make It Count.
Disclaimer: THERE IS A HIGH DEGREE OF RISK INVOLVED IN TRADING. IT IS NOT PRUDENT OR ADVISABLE TO MAKE TRADING DECISIONS THAT ARE BEYOND YOUR FINANCIAL MEANS OR INVOLVE TRADING CAPITAL THAT YOU ARE NOT WILLING AND CAPABLE OF LOSING.
VANTAGEPOINT’S MARKETING CAMPAIGNS, OF ANY KIND, DO NOT CONSTITUTE TRADING ADVICE OR AN ENDORSEMENT OR RECOMMENDATION BY VANTAGEPOINT AI OR ANY ASSOCIATED AFFILIATES OF ANY TRADING METHODS, PROGRAMS, SYSTEMS OR ROUTINES. VANTAGEPOINT’S PERSONNEL ARE NOT LICENSED BROKERS OR ADVISORS AND DO NOT OFFER TRADING ADVICE.