


This week’s ai stock spotlight is American Eagle Outfitters ($AEO)
American Eagle Outfitters isn’t some one-trick mall pony. It’s a multi-brand retail machine selling casual confidence to the masses — here at home and overseas — by owning the entire relationship from hanger to checkout.
At the core, they move the staples people actually wear: jeans, everyday apparel, accessories, and personal care under the American Eagle name. Then they turn up the margins and the loyalty with Aerie and OFFLINE by Aerie — intimates, activewear, swim, and comfort-first gear aimed squarely at repeat buyers who don’t shop once, they shop often.
On the higher-end flank, they run Todd Snyder New York, a menswear brand built for guys who want “grown-up” without “boring,” while Unsubscribed handles the curated, fashion-forward crowd that likes its clothing with a side of values and storytelling.
And here’s the real leverage: they don’t rely on one channel. They sell through their own stores, licensed locations, shop-in-shop concessions, wholesale relationships, and a tightly controlled digital pipeline; ae.com, aerie.com, toddsnyder.com, and unsubscribed.com, where they own the data, the customer, and the profit stream.
In short, this isn’t just a clothing company. It’s a brand portfolio engineered to capture attention, keep customers inside the ecosystem, and extract value at every click, rack, and register.
American Eagle Outfitters is what happens when a 1970s mall brand refuses to accept its own obituary. Founded in 1977, headquartered in Pittsburgh, and employing roughly 32,000 people worldwide, this company has spent decades selling jeans and optimism to teenagers who swear this pair is “totally different” from the last pair. Leadership currently sits under CEO Jay Schottenstein, part of the retail royalty family that’s been elbow-deep in apparel longer than most traders have been alive. That matters, because retail is one of the few industries where scar tissue counts as experience.
They are the retail equivalent of a boxer who got knocked down, spat out a tooth, stood back up, and learned how to win smarter instead of prettier. Everyone wrote it off as a dying mall relic, turns out it just needed to evolve.
Aerie is the real muscle behind the move. While the rest of apparel retail is gasping for air, this brand keeps cranking out growth, loyalty, and margins like it knows a secret the others missed.
The balance sheet isn’t a horror story either. In a world where higher rates punish sloppy operators, American Eagle shows up with cleaner books than most of its peers — and that matters when the market starts checking receipts.
The stock doesn’t care about runway trends or fashion headlines. It reacts to earnings, margin control, and whether management knows how to keep inventory from turning into discounted landfill.
The business itself is deceptively simple. American Eagle sells casual apparel under the American Eagle brand and intimate apparel, loungewear, and activewear under Aerie. Think jeans, hoodies, bras, leggings, and enough neutral colors to calm an anxious mall cop.
Most products are private label, which means higher margins when done right and catastrophic markdowns when done wrong. They sell through physical stores, e-commerce, and increasingly through digital-first engagement that tries very hard not to sound like it was written by a corporate committee.
Here’s the thing traders need to understand: American Eagle is no longer just about American Eagle. The real star of the show is Aerie. Aerie figured out something revolutionary in retail — sell comfortable clothes to normal people and don’t insult them in the advertising. That single insight has powered years of growth while competitors were busy airbrushing reality out of existence.
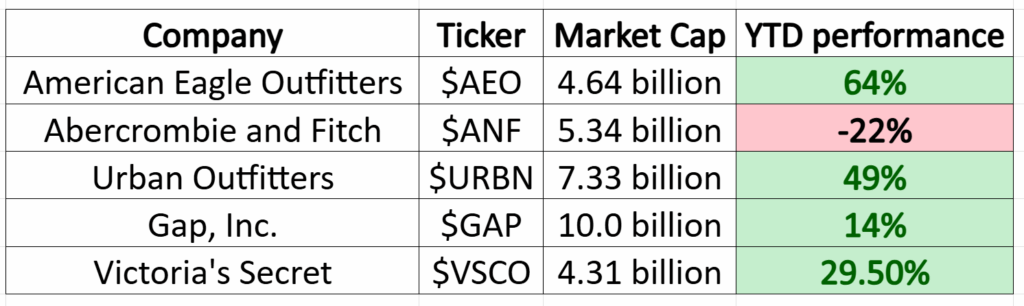
Competition is fierce, mostly because everyone sells the same clothes with slightly different fonts. Abercrombie cleaned itself up and discovered adults. Urban Outfitters leaned harder into cool. Fast fashion players like Shein and Zara sprint on price and speed. Specialty retailers like Gap, Hollister, and Victoria’s Secret are fighting various stages of identity crisis. American Eagle competes by being boring in a disciplined way, which in retail is a superpower.
Below is how the peer landscape roughly stacks up, in trader-friendly terms.
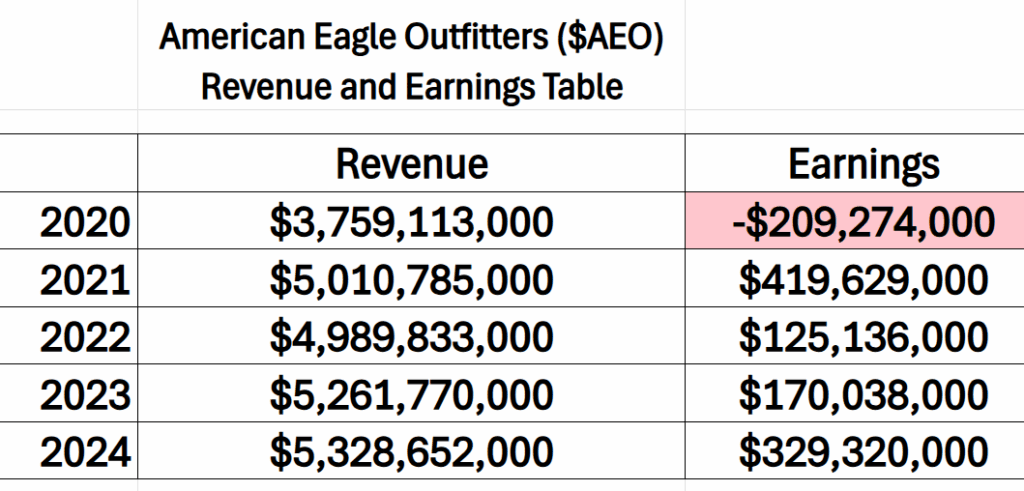
Financially, American Eagle is doing something traders love: it is not embarrassing itself. Revenue has been relatively stable after the post-pandemic retail sugar high wore off. Margins have improved thanks to better inventory management, fewer panic discounts, and a management team that learned the hard way what happens when you over-order hoodies. Cash levels are solid, debt is manageable, and the company doesn’t look like it needs a Fed bailout or a miracle influencer partnership.
Here’s a financial snapshot of the last few fiscal years, rounded for sanity and trader usefulness.
In retail, survival itself is bullish.
The opportunities are straightforward. If Aerie keeps growing mid-to-high single digits or better, it continues to mask stagnation elsewhere. If American Eagle proper stabilizes rather than shrinks, margins improve simply by not screwing up. Digital sales efficiency, store rationalization, and disciplined inventory buys all create operating leverage. None of this is sexy. All of it moves the stock.
International expansion remains optional upside. Management isn’t betting the farm on it, which traders should appreciate. Buybacks and dividends add another layer of support, especially for institutions that like getting paid while they wait. This is not a meme stock. It’s a “your model doesn’t break at 2 a.m.” stock.
Of course, there are risks, because retail is basically weather forecasting with cotton. Fashion cycles change. Teen tastes mutate overnight. Aerie could slow. Promotions could creep back in. Freight costs could rise. A recession could remind consumers that they already own clothes. Fast fashion could undercut pricing until everyone bleeds margins. And if management ever forgets that inventory is radioactive waste, the stock will remind them quickly.
But here’s why traders keep showing up anyway. American Eagle is not trying to be clever. It is trying to be competent. In a sector full of dramatic turnarounds and catastrophic flameouts, competence is tradable. The company has a real growth engine, a survivable legacy business, a balance sheet that doesn’t terrify analysts, and earnings events that reliably move the stock.
This is why AEO continues to rally when conditions line up. It’s not hype. It’s not hope. It’s the market quietly rewarding a retailer that learned how not to trip over its own shoelaces. Traders aren’t marrying this stock. They’re dating it around earnings, riding momentum when margins improve, and stepping aside when fashion headlines get weird.
The final takeaway is simple. American Eagle Outfitters is not the coolest kid in the mall. It’s the kid who figured out how to graduate, get a job, and pay rent on time. For traders, that means cleaner setups, clearer catalysts, and fewer existential surprises. In retail, that’s about as bullish as it gets without involving a celebrity collaboration or a miracle.
In this weekly stock study, we will look at and analyze the following indicators and metrics as are our guidelines which dictate our behavior on $AEO.
- Wall Street Analysts’ Price Forecasts
- 52-week high and low boundaries
- Best Case – Worst Case Analysis
- Vantagepoint A.I. Predictive Blue Line
- Neural Network Forecast
- Daily Range Forecast
- Intermarket Analysis
- Our trading suggestion
While we make our trading decisions based upon the ai forecasts we receive within the VantagePoint A.I. software we do consider the fundamentals to better understand the risk and reward profile of this asset.
Wall Street Analysts Forecasts
If you ever wanted a single picture that explains why traders drink coffee by the gallon, this is it.
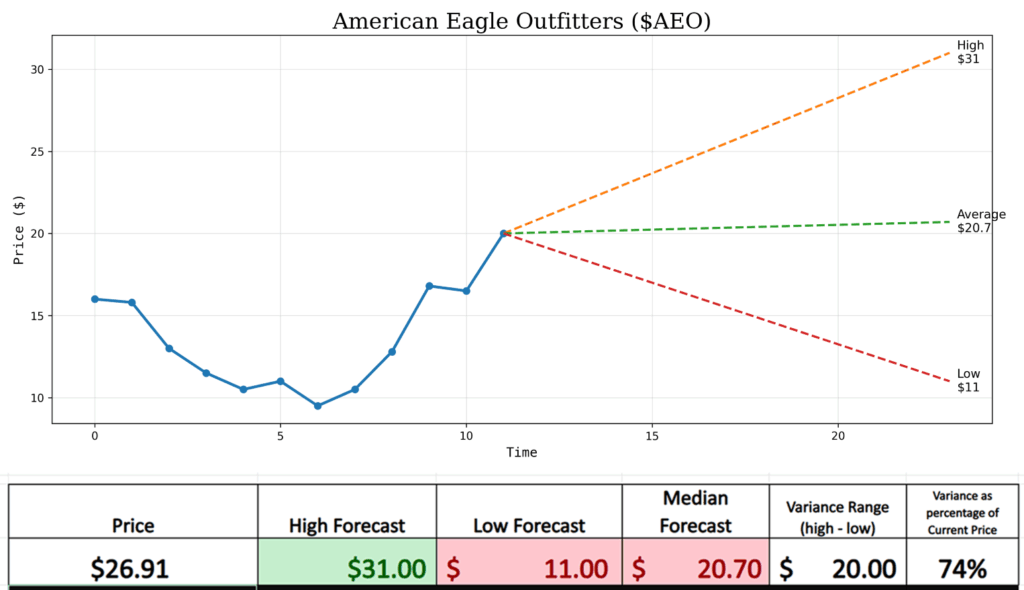
Here we have American Eagle Outfitters sitting around the $27 neighborhood, minding its own business, when Wall Street decides to offer three wildly different opinions about its future, none of which agree, all of which are delivered with absolute confidence.
On one side, the optimists see $31, which implies denim supremacy, operational excellence, and a retail renaissance led by bras and hoodies. On the other side, the pessimists see $11, which assumes consumers suddenly discover they already own clothes and decide to keep them forever. In the middle sits the “reasonable” forecast at $20.70, which is Wall Street’s polite way of saying, “We have no idea, but we brought a calculator.”
That spread — $31 on the high end and $11 on the low end — is not noise. It’s the message. A $20 variance range, representing roughly 74% of the current price, tells you this is not a sleepy utility stock where nothing happens and everyone goes home at 4 p.m. This is a volatility machine disguised as a mall retailer. The market isn’t debating whether American Eagle will move; it’s debating how violently.
What matters here isn’t which forecast wins. It’s the size of the disagreement itself. When analysts can’t even agree on the zip code where the stock might land, that uncertainty becomes fuel. Bulls are betting on margin discipline, Aerie growth, and management competence. Bears are betting on consumer fatigue, promotional pressure, and the eternal retail tradition of stepping on a rake. Both camps are confident. Both camps are wrong at different times. Traders get paid in between.
The chart shows it clearly. Price just made a strong move higher, and instead of forecasts tightening — as they would in a calm, predictable business — they explode outward like a financial weather cone during hurricane season. That widening cone is your volatility signal. It tells you expectations are unstable, emotions are involved, and future price swings are likely to be larger than average.
This is why traders care less about the destination and more about the distance. A $20 gap between best-case and worst-case outcomes means options get interesting, swings get tradeable, and patience becomes optional. You don’t need to know whether the stock goes to $31 or $11. You need to know that plenty of people believe in both, loudly, with money.
In other words, this chart isn’t forecasting certainty. It’s forecasting motion. And for traders, motion is the whole point.
52 Week High and Low Boundaries
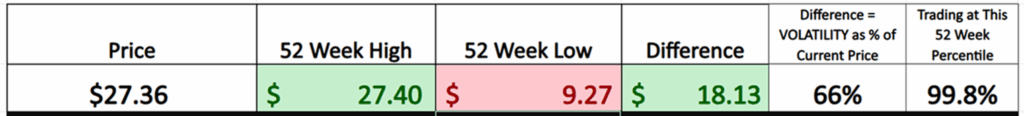
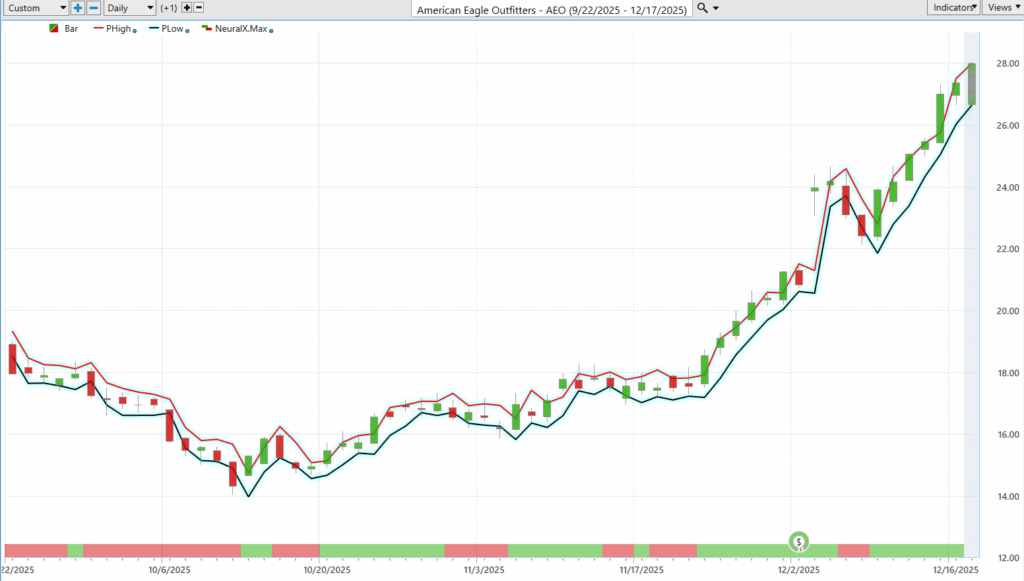
When traders see a stock making new 52-week highs, they don’t think in poetry or nostalgia. They think in probabilities. A 52-week high is the market’s simplest, bluntest signal that demand is overwhelming supply right now — not last quarter, not last year, but today. In the one-year chart, American Eagle Outfitters is doing exactly that. Price has pushed decisively above prior resistance, clearing levels that rejected it multiple times in the past. That matters because new highs force a behavioral reset: sellers who wanted out already sold, short sellers are under pressure, and anyone waiting for a pullback is suddenly negotiating with regret. For traders, this is not about valuation debates or fashion cycles — it’s about momentum, confirmation, and the uncomfortable reality that strength tends to attract more strength.
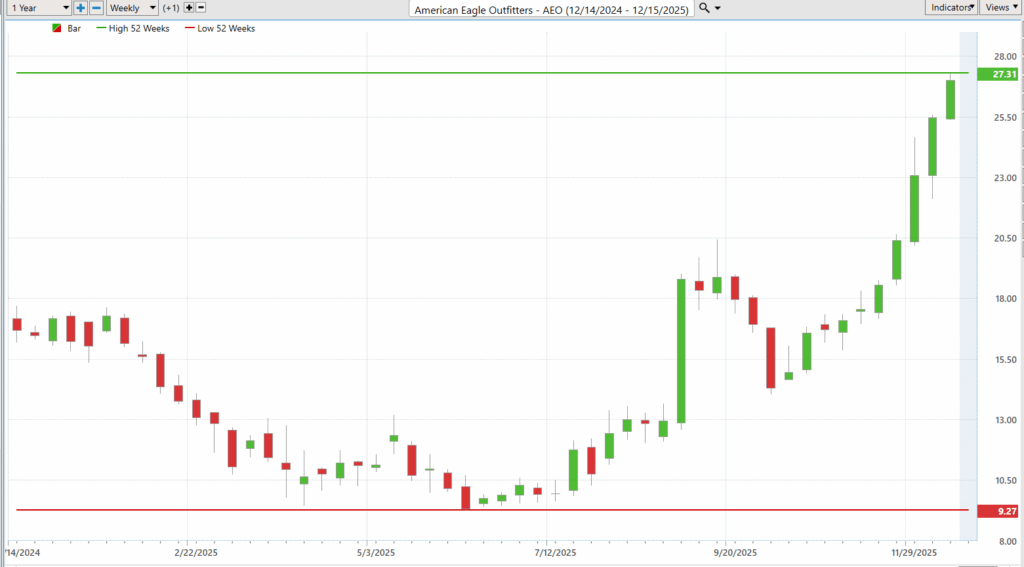
What stands out in the 52-week view is not just the breakout, but the context of it. This move is emerging after a prolonged base near the lows, where pessimism was well-established and expectations were low. That’s often where durable trends begin. When price accelerates out of that zone and makes fresh highs, it tells traders something important: the narrative has shifted, capital is reallocating, and the market is repricing the asset in real time. Whether that repricing is ultimately “right” is irrelevant in the near term. Markets move first. Explanations follow.
Now, zoom out to the 10-year chart, and the story becomes less about a breakout and more about survival, cycles, and trajectory. Over the past decade, American Eagle has lived through multiple retail regimes: mall dominance, e-commerce disruption, pandemic collapse, stimulus-fueled euphoria, and the post-COVID hangover. The long-term chart shows sharp rallies followed by brutal drawdowns, a reminder that this is not a straight-line compounder — it’s a cyclical retail asset that reflects consumer confidence, margins, and execution. But it also shows something else that matters: the stock has recovered repeatedly. Each major decline eventually gave way to a new advance, suggesting the business has been able to adapt rather than disappear.
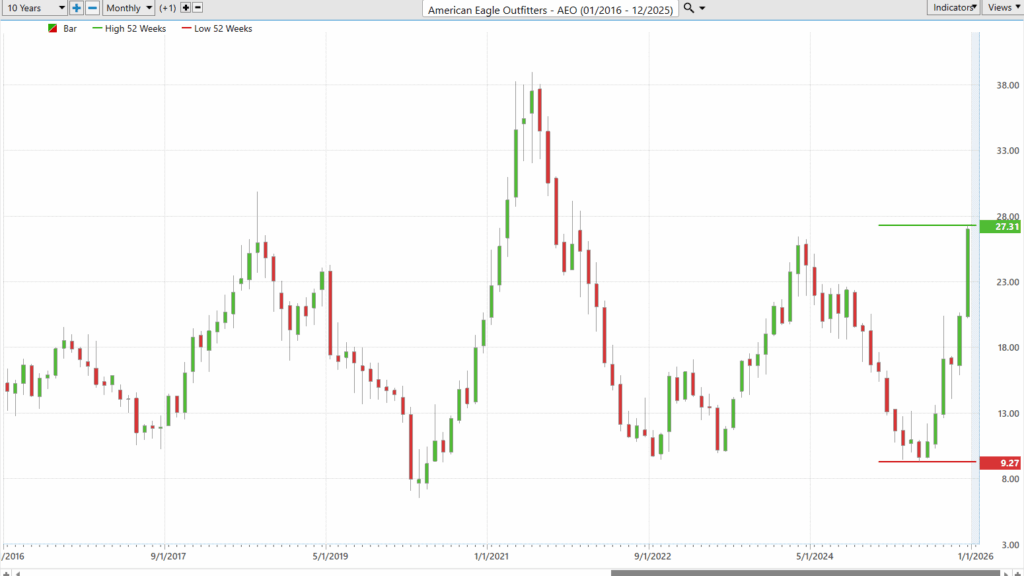
Seen together, the two charts tell a coherent story. The 52-week chart tells traders what is happening now: momentum is real, buyers are in control, and the stock is being treated as a leader, not a laggard. The 10-year chart provides the necessary restraint, reminding investors that this asset has a history of volatility, overshooting in both directions, and demanding respect for risk.
In the language of markets, American Eagle is speaking clearly. In the short term, it is acting like a stock institutions are willing to chase. In the long term, it sits within a broader, cyclical arc that rewards timing, discipline, and an understanding that retail reinventions are rarely permanent — but they can be very profitable while they last. That tension between momentum and memory is exactly where traders operate, and right now, the tape has the louder voice.
Best-Case/Worst-Case Scenario Analysis
Volatility is often treated like a math problem, something to be reduced to a formula, annualized, smoothed, and politely ignored. But markets don’t move like equations. They move like people. And people don’t experience volatility as a standard deviation; they experience it as pain, relief, regret, and opportunity. The two charts in front of us make that point far more clearly than any spreadsheet ever could.
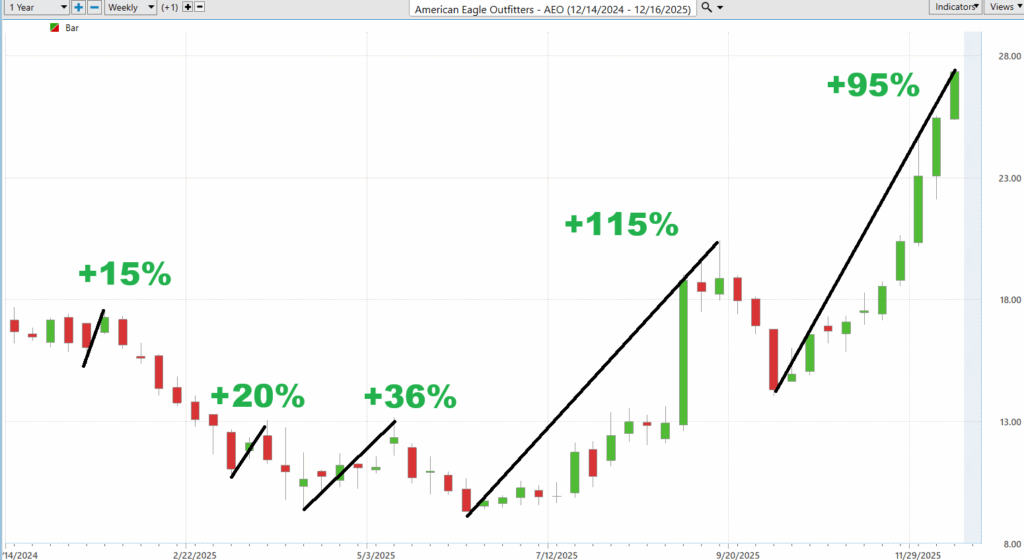
Start with with the best case scenario — the uninterrupted rallies. A 15% advance. Then 20%. Then 36%. Then a 115% surge. And finally, a 95% run higher. These are not theoretical upside scenarios. These are observed behaviors. They tell us how the stock tends to move when momentum takes hold—how far it can travel before pausing, and how quickly pessimism can flip into enthusiasm.
Contrast with the worst-case scenario, the sequence of uninterrupted declines. Here, volatility reveals itself not as noise, but as magnitude. A 45% drawdown. Then another 29%. Then a 31% pullback. These are not intraday wiggles or statistical footnotes. These are real moves that forced decisions. Each decline represents a moment where conviction was tested, stops were hit, and narratives shifted. This is what downside risk looks like in practice: extended, directional moves that persist long enough to matter.
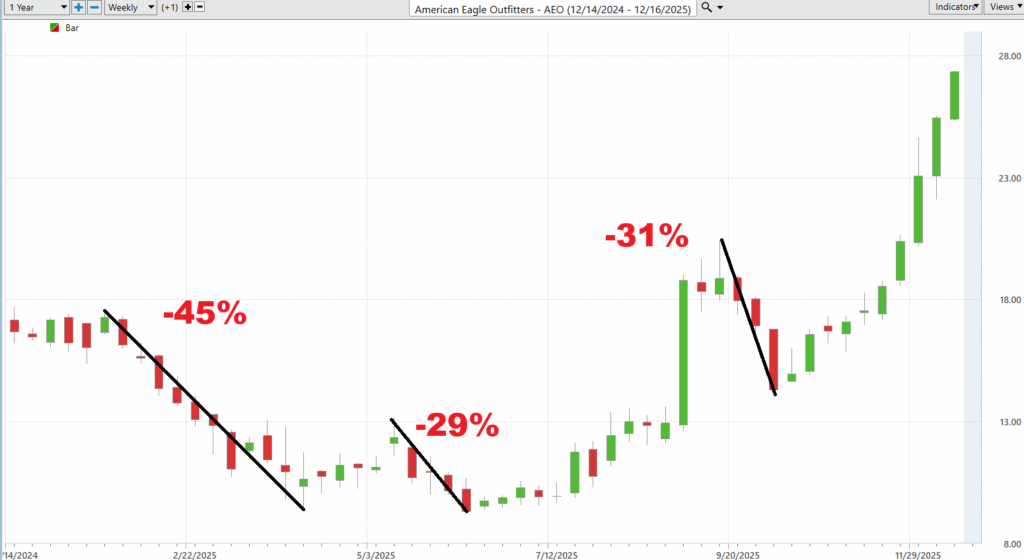
This is the practical way to think about volatility. Not as a single number, but as a range of lived outcomes. By simply measuring the size of consecutive advances and declines, traders build an intuitive risk/reward framework. If the recent past is any guide — and markets are nothing if not habit-forming — then the future is unlikely to be calm, modest, or linear. What just happened is statistically more likely to happen again than something entirely new.
Seen this way, volatility stops being abstract and starts becoming actionable. It tells you what kind of moves you should expect, not just what you should fear. It informs position sizing, time horizon, and emotional preparedness. If a stock regularly swings 30% to 50% in one direction before changing course, then planning for a 5% outcome is not conservative, it’s unrealistic.
The lesson embedded in these charts is subtle but powerful. Volatility is not randomness. It has character. It leaves a footprint. And by studying the magnitude of uninterrupted moves you gain a clearer, more honest sense of what the market can do next. Not because history repeats perfectly, but because behavior, especially in financial markets, has a habit of rhyming.
Next, we compare $AEO to the broader stock market averages:
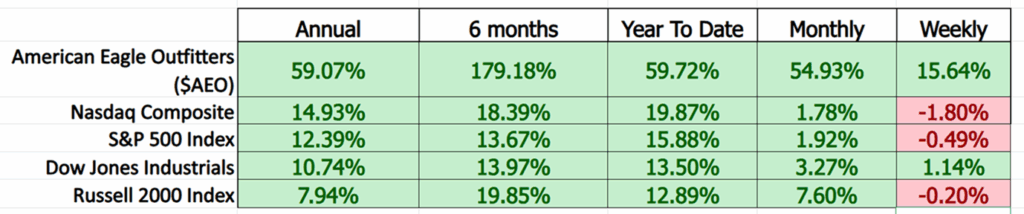
When performance is this consistent, it stops being a coincidence and starts becoming a statement.
No matter how you frame the comparison — annual, six months, year to date, monthly, or weekly — American Eagle Outfitters is doing something unmistakable: it is outperforming. Not by a narrow margin, not by statistical noise, but by multiples. While the major indexes post respectable, workmanlike gains, AEO is compounding at a pace that forces attention. A near 180% move over six months isn’t leadership by accident. It’s leadership by demand.
This matters because markets reward relative strength, not absolute optimism. Capital doesn’t ask whether a stock is good; it asks whether it is better than the alternatives. In every timeframe that traders use to make decisions, AEO answers that question decisively. Against the Nasdaq, the S&P 500, the Dow, and the Russell 2000, it isn’t keeping up — it’s pulling away.
That’s the signal embedded in this table. When a stock outperforms across short, intermediate, and longer horizons simultaneously, it tells you the same buyers keep showing up, regardless of market conditions. That persistence is what turns a trade into a trend — and a trend into something institutions can’t ignore.
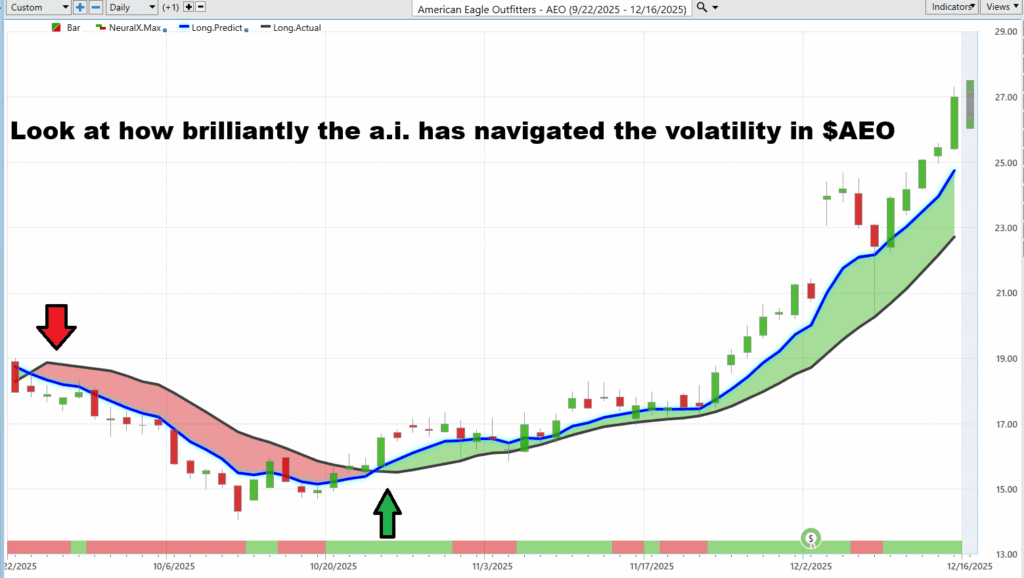
VantagePoint A.I. Predictive Blue Line
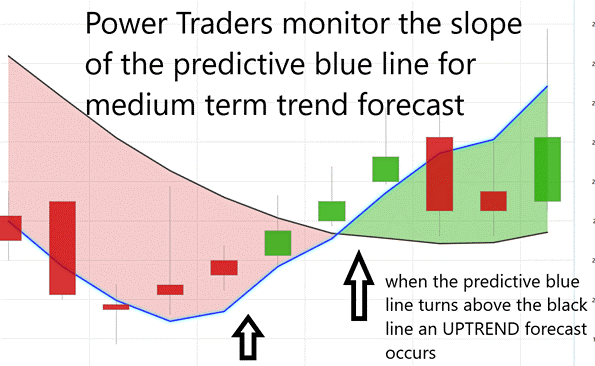
The first rule of the VantagePoint A.I. Predictive Blue Line is brutally simple: direction matters more than opinion. When the blue line is sloping upward, the market is telling you demand is gaining the upper hand. When it slopes downward, the opposite is true. Traders get into trouble when they argue with that slope instead of respecting it. You don’t predict the slope — you follow it. An upward slope is permission to think long. A downward slope is a warning to stand aside or think defensively. Everything else is commentary.
The second rule is confirmation, and it comes from the crossover. When the predictive blue line crosses above the black line, it’s the market saying momentum and trend are now aligned. That’s not noise, that’s a regime change. It’s the moment where probabilities shift in your favor, where pullbacks become opportunities instead of threats. When the blue line crosses below the black line, the message flips just as clearly. Risk is rising. The trend is weakening. Hope becomes expensive.
The final rule is discipline. The strongest trades happen when slope and crossover agree — blue line rising and above the black line. That’s when trends persist and traders get paid for patience. When the slope flattens or the blue line slips back below the black line, the edge erodes, and capital preservation takes precedence. This is not about being right; it’s about being aligned. The predictive blue line doesn’t ask for belief — it demands respect.
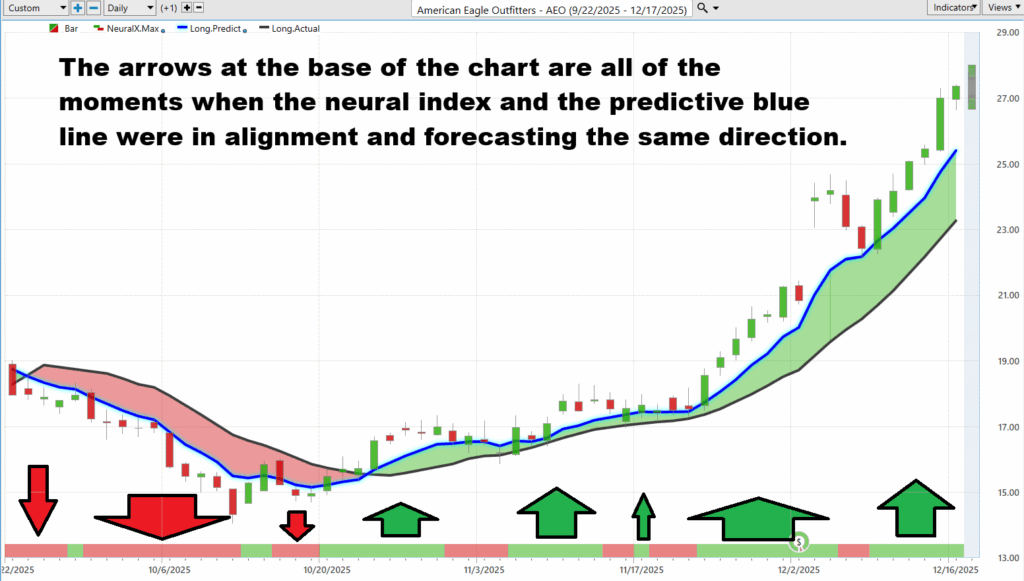
VantagePoint A.I. Neural Index (Machine Learning)
A neural network for trading is not magic, mysticism, or a crystal ball with better branding. It’s a machine that’s been trained to recognize patterns faster, more consistently, and with less emotional baggage than a human ever could. At its core, it takes raw market data — price, volume, volatility, intermarket relationships — and runs it through layers of logic designed to answer one brutal question: what usually happens next when conditions look like this? No opinions. No gut feelings. Just pattern recognition at scale.
Here’s how it’s built, in plain English. First, you feed it mountains of historical market data — the kind no human could mentally track. Then you structure it in layers. The early layers look for simple relationships. The deeper layers look for complex interactions between markets, timing shifts, momentum changes. The network “learns” by making predictions, comparing them to what happened, and adjusting itself. Over time, it stops guessing and starts anticipating. Not perfectly — but better than chance, and far better than emotional decision-making.
The real value of a neural network isn’t prediction. It’s consistency. Traders don’t fail because they don’t know enough; they fail because they break their own rules under pressure. Neural networks don’t panic. They deliver the same assessment every day, regardless of headlines or fear. That gives traders something priceless: an objective framework for risk and opportunity.
And that’s where decision-making improves. Instead of asking, “What do I think?” the trader asks, “What does the data say right now?” Neural networks help traders align with probabilities instead of emotions. They narrow focus, highlight high-odds setups, and filter out noise. In short, they don’t replace the trader, they upgrade the trader.
VantagePoint A.I. Daily Range Forecast
Most traders don’t lose because they’re wrong about direction. They lose because they don’t know where to act.
That’s the quiet power behind these two graphics.
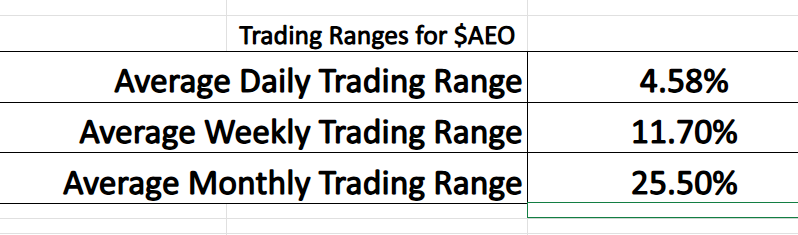
The first graphic adds context, but not confusion. Average daily, weekly, and monthly trading ranges remind us that AEO is an active stock — one that moves enough to reward discipline and punish hesitation. A 4.58% average daily range. Nearly 12% weekly. Over 25% monthly. Those numbers tell you volatility exists. But they don’t tell you how to trade it. They describe the battlefield without showing you where the lines are drawn.
The second chart shows the daily range forecast doing one simple, enormously valuable job: answering the most important question a trader faces each morning, where is the market likely to go today, and where does risk begin and end? By projecting the expected high and low for the session, the daily range forecast turns a vague idea into a concrete plan. It tells you where buyers are likely to show up, where sellers may take control, and where you’re probably wrong.
That’s where the daily range forecast earns its keep. Instead of relying on historical averages, it isolates today’s opportunity. It narrows the chaos. It defines the probable extremes before the opening bell rings. In doing so, it forces clarity: if price is near the projected low, risk is smaller and reward is asymmetric. If price stretches toward the projected high, profits should be protected and expectations adjusted.
This is the distinction most traders miss. Context explains what a stock can do. The daily range forecast tells you what to do about it. One is informational. The other is actionable.
And action is the business traders are in. Knowing the expected daily high and low doesn’t guarantee profits — but it does eliminate guesswork. It replaces hope with structure. It transforms volatility from something to fear into something to exploit.
That’s not an indicator. That’s a decision-making edge.
Intermarket Analysis
Intermarket analysis is the idea that no market moves alone. Stocks, bonds, commodities, currencies, and interest rates are all connected, and what happens in one often affects the others. If oil prices rise, it can change how airlines perform. If interest rates fall, stocks may become more attractive. Intermarket analysis simply means looking at these relationships instead of staring at one chart in isolation.
For a trader, this is useful because it provides context. Rather than guessing why a stock is moving, intermarket analysis asks a smarter question: what else is moving at the same time? When multiple markets point in the same direction, the signal becomes stronger. It’s like checking the weather, traffic, and the clock before leaving the house—you make better decisions when you understand the whole environment, not just one piece of it.
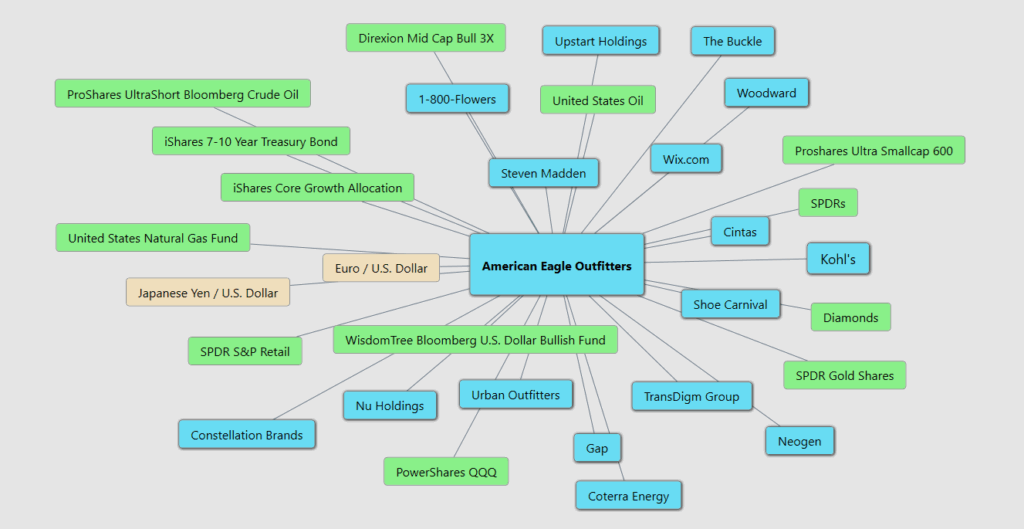
At first glance, this intermarket map looks busy. Step back, and a simpler story emerges: American Eagle Outfitters doesn’t trade in isolation — it trades at the intersection of consumer confidence, capital flows, and macro risk appetite.
On one side of the diagram sit equities tied to discretionary spending and growth — retail peers like Urban Outfitters, Gap, Kohl’s, Shoe Carnival, and Steven Madden, alongside broader vehicles like the S&P Retail ETF and QQQ. When money is flowing into these areas, it tells us something important about the consumer: they are spending, not saving; taking risk, not hiding. AEO benefits directly from that environment. Its price action tends to strengthen when growth-oriented assets and consumer stocks move together, signaling optimism rather than caution.
On the other side are the macro forces that quietly shape those decisions. Currency pairs like the U.S. dollar versus the euro and yen, Treasury bonds, energy markets, and even gold appear because they influence purchasing power, costs, and investor psychology. A stronger dollar, stable rates, and contained energy prices create a backdrop where margins matter less and demand matters more. When risk assets outperform defensive ones, AEO trades less like a clothing company and more like a barometer of economic confidence. In that sense, this chart isn’t about prediction — it’s about alignment. When the macro currents point toward growth, liquidity, and risk-taking, AEO tends to move with them.
Our Suggestion
American Eagle’s last two earnings calls tell a story that’s familiar in retail but still instructive: stumble, adjust, regain footing, and then cautiously move forward. The most recent earnings report, covering the third quarter of fiscal 2025 and released in early December, was clearly the stronger of the two. Revenue came in around the mid-$1.3 billion range, up modestly from a year earlier, and earnings beat Wall Street expectations. That matters because expectations in retail are often low for a reason. The real standout was Aerie and its OFFLINE brand, which continued to post double-digit comparable sales growth. Management sounded encouraged, pointing to solid demand heading into the holidays and early signs that their merchandising and marketing adjustments were working.
The prior earnings call, earlier in the year, had a very different tone. That quarter exposed some weak spots: softer sales in parts of the core American Eagle brand, inventory issues, and the kind of execution problems that force management to lower guidance and swallow some humble pie. Rather than deny it, leadership leaned into the fixes. They talked openly about tightening inventory, sharpening product assortments, and leaning harder into the brands that were clearly resonating with customers. By the time of the most recent call, those corrective steps appeared to be bearing fruit, which is why the narrative shifted from defense to cautious optimism.
Management does sound confident but not reckless. There’s no victory lap language here. Instead, the tone is steady and pragmatic. They’ve highlighted momentum where it exists, especially at Aerie, while acknowledging that the broader consumer remains selective and price-sensitive. In other words, they’re pleased with progress but fully aware that retail can turn on a dime. That balance tends to resonate with markets, because it suggests realism rather than hype.
As for whether they’re hitting their goals, the answer is mostly yes, at least on earnings execution. Recent quarters have beaten expectations, and revenue growth has stabilized after earlier softness. The company has shown it can adjust when something isn’t working, which is often more important than getting everything right the first time. Still, the year hasn’t been perfectly smooth, and management has made it clear that discipline — not expansion at any cost — is the priority.
The biggest barriers to continued success are also clearly laid out. Consumer spending remains uneven, with shoppers more cautious than they were a few years ago. Inventory management is always a risk in apparel, and past missteps are a reminder of how quickly margins can erode. Add in cost pressures — from sourcing, logistics, or tariffs — and it’s easy to see why management keeps its optimism measured. None of these are unique to American Eagle, but they’re real and persistent.
Looking ahead, the next earnings call is expected in early March 2026, when the company reports fourth-quarter and full-year results. That will be an important checkpoint, especially after the holiday season. Analysts currently expect modest improvement going forward: slightly higher earnings and incremental revenue growth, not a breakout year but a continuation of steady progress. In plain English, Wall Street isn’t expecting miracles — but it is expecting competence.
Taken together, the last two earnings calls suggest a company that has steadied itself. American Eagle isn’t promising the moon. It’s promising to execute better than it did before, lean into what works, and avoid the mistakes that hurt it earlier in the year. For a retailer in this environment, that alone is enough to keep investors — and traders — paying attention.
Put $AEO on your watchlist and leave it there — because this stock isn’t done giving traders opportunities, it’s just getting warmed up. The kind of volatility you’re seeing now is the market ringing the cash register, not once, but repeatedly for anyone paying attention.
But here’s the part that separates professionals from gamblers: money management. $AEO moves fast and it moves far, which means position sizing isn’t optional — it’s survival. Trade it too big and one bad swing will knock you out. Trade it correctly and the same volatility becomes your edge. Respect the range, size the position, and let the stock do what it’s already proven it loves to do: move.
$AEO has been winning against all of its competitors, we anticipate that trend will continue.
It’s not magic.
It’s machine learning.
Disclaimer: THERE IS A HIGH DEGREE OF RISK INVOLVED IN TRADING. IT IS NOT PRUDENT OR ADVISABLE TO MAKE TRADING DECISIONS THAT ARE BEYOND YOUR FINANCIAL MEANS OR INVOLVE TRADING CAPITAL THAT YOU ARE NOT WILLING AND CAPABLE OF LOSING.
VANTAGEPOINT’S MARKETING CAMPAIGNS, OF ANY KIND, DO NOT CONSTITUTE TRADING ADVICE OR AN ENDORSEMENT OR RECOMMENDATION BY VANTAGEPOINT AI OR ANY ASSOCIATED AFFILIATES OF ANY TRADING METHODS, PROGRAMS, SYSTEMS OR ROUTINES. VANTAGEPOINT’S PERSONNEL ARE NOT LICENSED BROKERS OR ADVISORS AND DO NOT OFFER TRADING ADVICE.


