


This week’s ai stock spotlight is J.P. Morgan Chase and Co. ($JPM)
JPMorgan Chase & Co. ($JPM) is the largest, loudest, and most systemically important bank in the United States, which is a polite way of saying that if it sneezes, the entire financial system reaches for a tissue. This is the house that Jamie Dimon built, or at least reinforced with steel, concrete, and a thick binder labeled “lessons from 2008.”
JPMorgan Chase traces its roots back over 200 years, which in banking years means it has survived wars, panics, depressions, and more regulatory paperwork than the Library of Congress. The modern JPM is headquartered in New York City, employs roughly 310,000 people globally, and is run by CEO Dimon, who has been in charge since 2006 and has the unique distinction of being quoted approvingly by both hedge fund managers and grandmothers who still balance checkbooks.
This bank does everything. Consumer banking. Corporate lending. Investment banking. Trading. Asset and wealth management. Credit cards. Custody services. If money exists, JPM wants a small toll booth next to it.
The business model is straightforward in theory and diabolically complex in practice. JPM gathers deposits from consumers and businesses, pays them very little for the privilege, and then lends that money out or invests it at higher rates. That spread is the bread and butter. Layered on top are fee-based businesses like advisory work, underwriting, trading commissions, and asset management fees. This matters because fees don’t care as much about interest rates, which gives JPM balance when the rate cycle turns.
Unlike some banks that rely heavily on flashy branded products or risky niche strategies, JPM runs a diversified empire. Chase is the consumer-facing brand. JPMorgan is the buttoned-up institutional brand. Same balance sheet, different neckties. This dual personality allows the company to make money from everyday Americans swiping credit cards while also advising multinational corporations on billion-dollar mergers.
Competitors exist, of course, but most are specialists pretending to be generalists or generalists pretending to be disciplined. JPM is both big and boring, which in banking is the highest compliment.
Here’s how JPM stacks up against its peers:
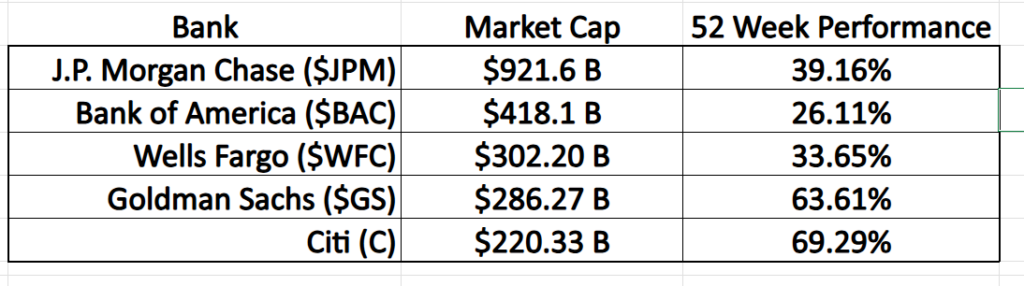
JPM’s advantage is not that it wins in every category. It’s that it doesn’t lose badly in any of them. When dealmaking slows, trading picks up. When trading slows, consumer banking carries the load. When consumers tighten belts, institutional clients start hedging and restructuring. It’s financial whack-a-mole, except JPM owns all the mallets.
The takeaway here is stability. Traders may not get fireworks every quarter, but they get predictability, which institutions love. And when institutions love something, price trends tend to persist longer than logic would suggest.
So why does this stock keep rallying?
First, trust. $JPM is viewed as the safest place to park money in a storm. When regional banks wobble, deposits often flow into $JPM like nervous swimmers grabbing the biggest raft. Second, execution. Management consistently hits or beats expectations, not with gimmicks but with competence. Third, optionality. $JPM has the balance sheet and technology budget to invest aggressively in A.I., payments, and fintech defenses without betting the farm.
Opportunities remain plentiful. If the economy slows but avoids a deep recession, $JPM benefits from steady credit quality and ongoing capital markets activity. If rates come down gradually, loan demand may pick up. Continued share buybacks provide downside support. International expansion and digital banking investments could open new revenue streams, particularly as $JPM pushes further into payments and treasury services.
Here is what the financials look like over the last 5 years.
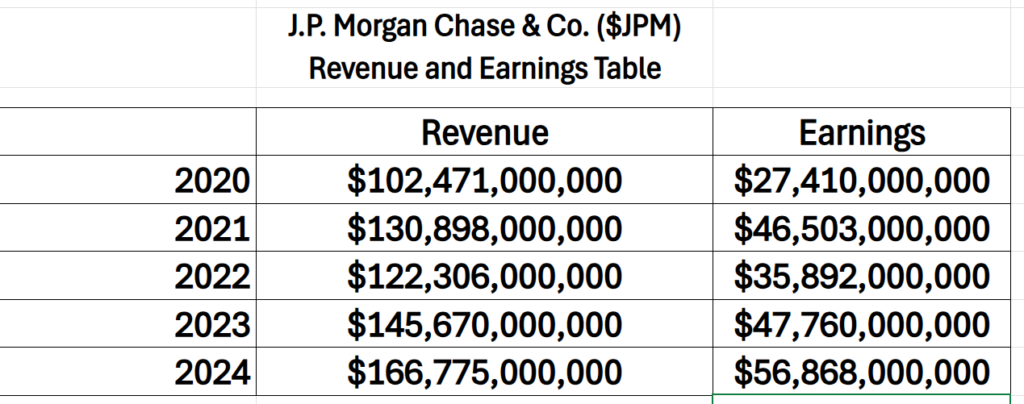
The table tells a quiet but persuasive story of scale, resilience, and compounding execution. From 2020 through 2024, JPMorgan Chase steadily expanded both revenue and earnings, not in a straight line, but in a way that reflects how large financial institutions operate through cycles.
Revenue climbed from roughly $102 billion in 2020 to nearly $167 billion in 2024, while earnings more than doubled over the same period, rising from $27 billion to almost $57 billion. The dip in 2022 stands out not as a failure, but as a reminder of how rate volatility, reserve builds, and market slowdowns temporarily pressure results — only to be followed by a sharp rebound as conditions normalize. What’s most striking is not just growth, but operating leverage: earnings accelerated faster than revenue, signaling improved margins, disciplined cost control, and the benefit of scale in a higher-rate environment. For investors, the message embedded in the numbers is straightforward — this is a bank that doesn’t merely survive disruption, it monetizes it, and over time, that consistency becomes its most valuable asset.
But here’s the uncomfortable truth for bears: JPM is not priced like a speculative tech stock. It trades like a cornerstone. That limits upside explosions, but it also limits catastrophic downside unless the entire financial system is in trouble. And if that happens, your portfolio has bigger problems than one bank stock.
Of course, nothing is bulletproof. Credit losses could rise if unemployment spikes. Regulatory pressure is a constant headache, especially for banks labeled “too big to fail,” which is Washington’s way of saying “we will supervise you forever.” Political risks loom, because banks make excellent villains during election years. And if Jamie Dimon ever seriously hints at retirement, expect a brief existential crisis on Wall Street.
JPMorgan Chase wasn’t built in calm waters. It was assembled the hard way through mergers, crises, and moments when others faltered. From the union of J.P. Morgan & Co. and Chase Manhattan, to the acquisition of Bank One that ushered Jamie Dimon into leadership, the bank evolved into a financial institution designed not just to compete, but to endure. When the financial system cracked, JPMorgan didn’t hide it expanded, absorbed risk others couldn’t, and positioned itself as the institution regulators and clients alike assumed had to keep standing.
That reputation didn’t come from slogans or quarterly beats. It came from discipline: diversified revenue streams, conservative capital management, and relentless investment in technology and infrastructure. JPMorgan learned early that banking is no longer just about money, it’s about systems, scale, and trust. When markets freeze, clients don’t look for the cheapest provider; they look for the one that will still answer the phone tomorrow. JPMorgan has made a business out of being that phone call.
Looking forward, the playbook remains consistent. Rate dynamics will shape margins, dealmaking cycles will determine upside in markets revenue, and credit quality will test underwriting discipline. Overlay all of it with regulatory pressure and the eventual leadership transition, and the question isn’t whether JPMorgan will face challenges, it’s whether those challenges will strengthen its competitive edge. History suggests they will. Institutions built to survive stress don’t just last longer. They quietly take market share while everyone else is busy reacting.
The final verdict for traders is simple and slightly boring, which is exactly why it works. JPM is not a lottery ticket. It’s a trend stock powered by institutional confidence, steady earnings, and a management team that treats risk like a live grenade rather than a party favor. It rallies because money flows toward competence in uncertain times, and uncertainty has become the permanent backdrop.
In trader terms, JPM keeps winning not because it’s exciting, but because it refuses to do anything stupid. And on Wall Street, avoiding stupidity is the most underrated edge of all.
In this weekly stock study, we will look at and analyze the following indicators and metrics as are our guidelines which dictate our behavior on a particular stock.
- Wall Street Analysts’ Price Forecasts
- 52-week high and low boundaries
- Best Case – Worst Case Analysis
- Vantagepoint A.I. Predictive Blue Line
- Neural Network Forecast
- Daily Range Forecast
- Intermarket Analysis
- Our trading suggestion
Wall Street Analysts Price Forecasts
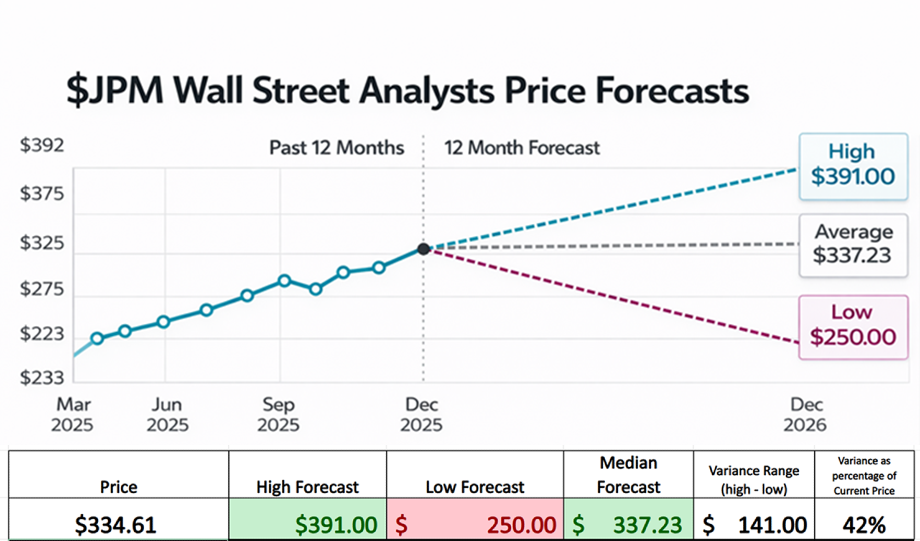
Whenever Wall Street puts out forecasts like this, the only numbers that matter are the most bullish and the most bearish. Everything else is wallpaper. Analysts love to hide behind the “average,” because averages sound responsible and safe, like beige paint in a dentist’s office. But traders don’t get paid on averages. Traders get paid on extremes. This image lays it bare: the bulls see $391.00, the bears see $250.00, and the market sits in the middle pretending it knows which one is right.
Now here’s the part most people miss — and it’s the only part that matters. The spread between those two forecasts is $141.00. When you measure that variance against the most recent closing price of $334.61, you’re staring at a projected volatility range of 42%. Forty-two percent. That’s Wall Street quietly admitting it has no consensus and fully expects big movement. Direction is debatable. Magnitude is not. This is the market telling you, in plain numbers, “Don’t get comfortable.”
And this is why professionals always ask the same question before they ever ask “up or down”: how wide is the range? Because wide ranges mean opportunity and danger for anyone who doesn’t respect volatility. A 42% expected swing means positions need room, patience, and discipline. It means options pricing isn’t random, stops can’t be lazy, and conviction without risk management is financial suicide. The chart is defining the playing field. And once you see that, you stop arguing with forecasts and start preparing for movement — which is where the real money is made.
52 Week High and Low Boundaries
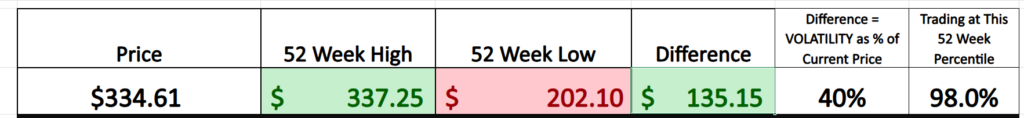
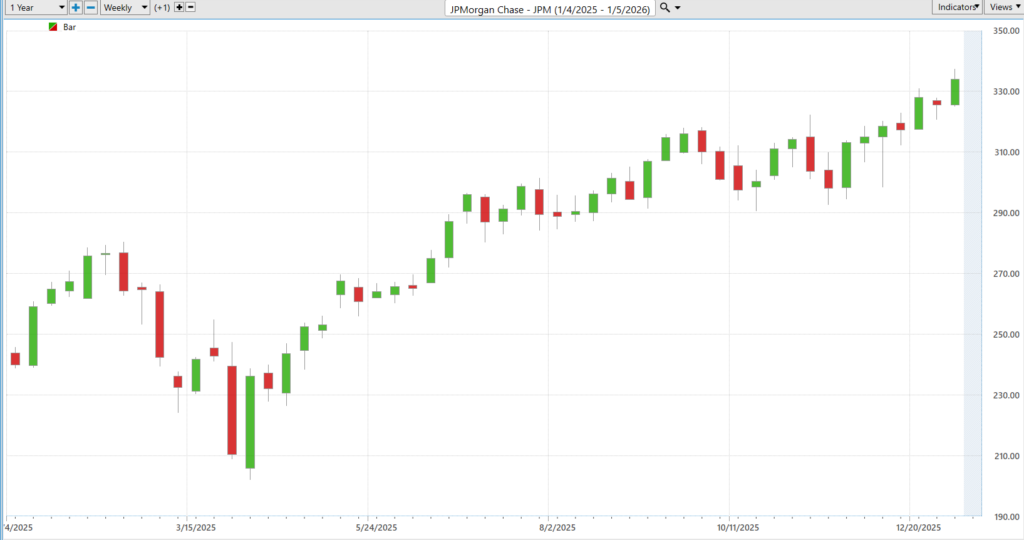
JPMorgan Chase & Co.’s price action and the surrounding forecasts are telling a remarkably consistent story, even if they arrive there from different angles. The weekly chart shows a stock that spent the past year grinding higher, absorbing pullbacks, and ultimately pushing into the upper end of its range near $334.61, within striking distance of its 52-week high of $337.25. That places the shares in the 98th percentile of their annual range, a position that typically reflects strong institutional demand rather than retail enthusiasm. But elevated prices rarely mean reduced risk, often they mean the opposite.
Wall Street’s own forecasts reinforce that point. Analyst projections span from a bullish $391 on the upside to a bearish $250 on the downside, producing a $141 range that equates to roughly 42% of the current share price. That is not a trivial spread; it is an admission of uncertainty at scale. When the difference between best-case and worst-case scenarios approaches half the stock’s value, analysts are effectively signaling that direction is debatable, but volatility is not. The market is being priced for movement, not for calm.
History agrees. The stock’s actual 52-week trading range runs from $202.10 to $337.25, a difference of $135.15, or about 40% of today’s price. Strip away narratives, forecasts, and sentiment, and the math is stubbornly consistent. Both realized volatility and expected volatility converge on the same conclusion: JPMorgan is unlikely to trade quietly. However 2026 unfolds — higher rates, lower rates, political risk, or economic resilience, the numbers suggest wide swings are not an anomaly but the baseline.
The stock continues to make new 52-week highs, while simultaneously also making new all time highs. This has proven to be a very dynamic and powerful setup.
Best-Case/Worst-Case Scenario Analysis
Volatility doesn’t have to be some abstract Greek letter whispered about on financial television. You don’t need formulas, forecasts, or a PhD in theoretical math to understand it. You can see volatility with your own eyes if you simply measure how far prices move. These two charts do exactly that. They strip the concept down to its most honest form: how big were the rallies, how deep were the declines, and how often did both show up over the last year.
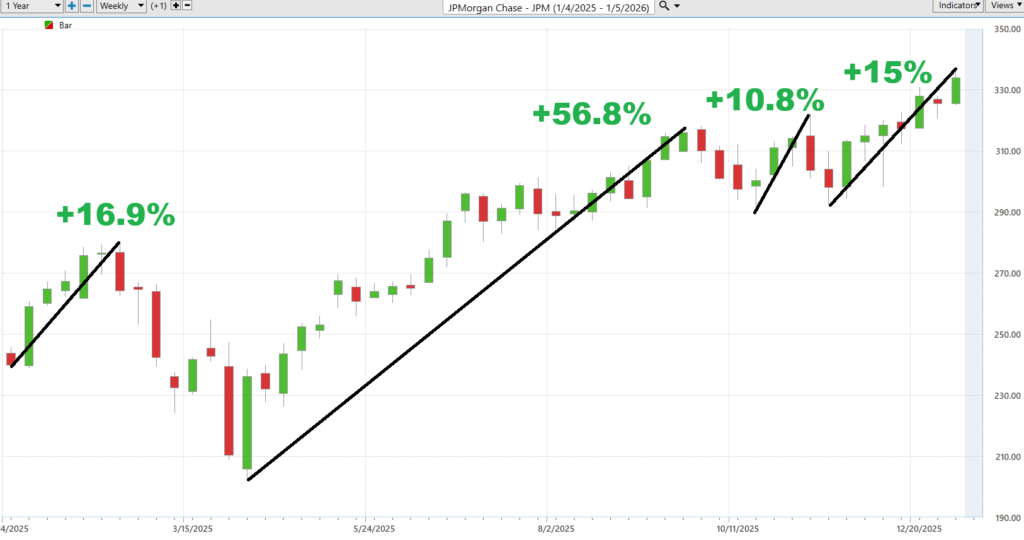
The first chart shows the best-case reality. This is what happens when JPM gets everything right for stretches of time — strong trends, shallow pullbacks, and sustained momentum. You see advances of +16.9%, +56.8%, +10.8%, and +15%, not as theoretical upside targets but as real, tradable moves that occurred. This is risk working in your favor. It’s the reward side of the equation, measured in dollars and percentages instead of hope and headlines.
The second chart shows the other side of the same coin, and it’s the side traders ignore at their own expense. Here you see the declines: -28.3%, -8.44%, -9.1%, and -6.7%. These are normal corrections inside a broader trend. But they are large enough to hurt anyone who pretends volatility doesn’t exist. This is what risk looks like when you stop romanticizing markets and start measuring them honestly.
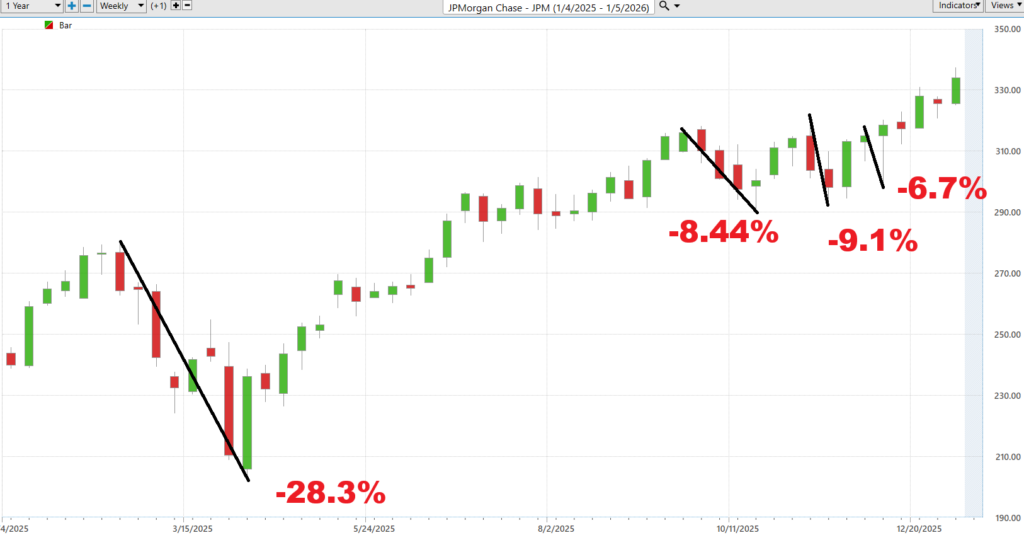
Together, these charts do something refreshingly practical. They quantify reality. Risk and reward are not opinions here. If you know how far a stock has rallied and how far it has fallen, you stop being surprised by movement and start preparing for it. And that, more than any forecast, is how grown-ups trade.
Next, we compare the performance of $JPM to the broader stock market indexes.
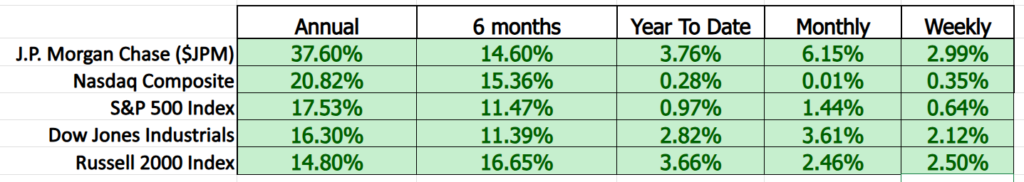
The table offers a rare moment of clarity in a market often dominated by narrative. When JPM’s returns are placed alongside the major indexes, the distinction is not subtle. Over the past year, the stock is up 37.6%, more than doubling the gains of the S&P 500 and comfortably outpacing the Nasdaq and Dow. That outperformance is not confined to a single time frame, either. Whether measured over six months, one month, or one week, JPM consistently sits at or near the top of the list. This is not an argument built on storytelling; it is an argument built on arithmetic.
What’s notable is how this kind of comparison strips away the distractions that typically cloud decision-making. Headlines oscillate daily between optimism and alarm, often anchored to macro speculation rather than price behavior. But when returns are measured across consistent time horizons, emotion fades and leadership becomes obvious. JPM’s ability to outperform across multiple windows suggests sustained institutional demand rather than a fleeting trade or reaction to a single catalyst.
For traders, the implication is straightforward. Outperformance is not something to be debated or hoped for — it is something to be measured. Relative performance tables like this serve as a reality check, grounding decisions in data rather than commentary. In a market saturated with opinions, the discipline of tracking performance remains one of the few reliable ways to distinguish leadership from noise.
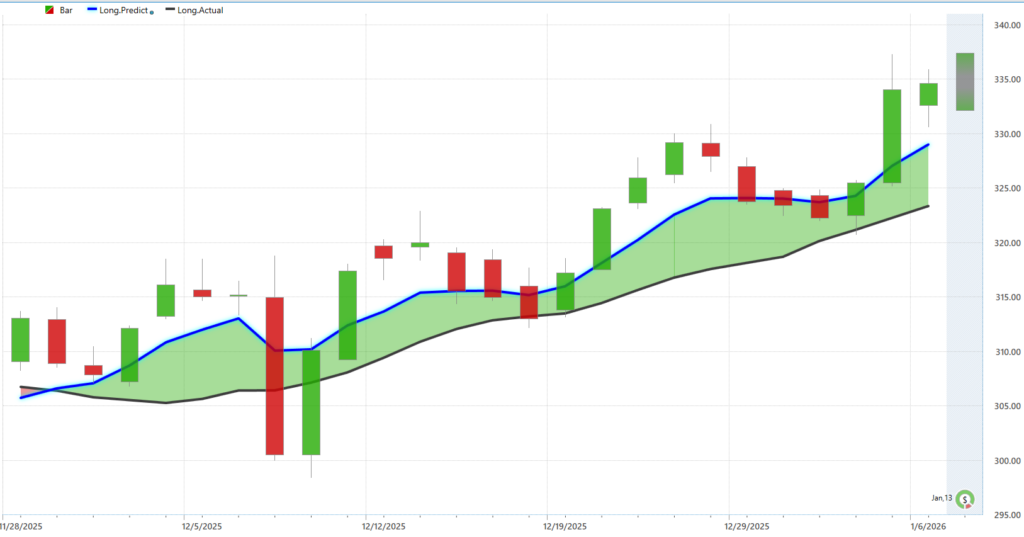
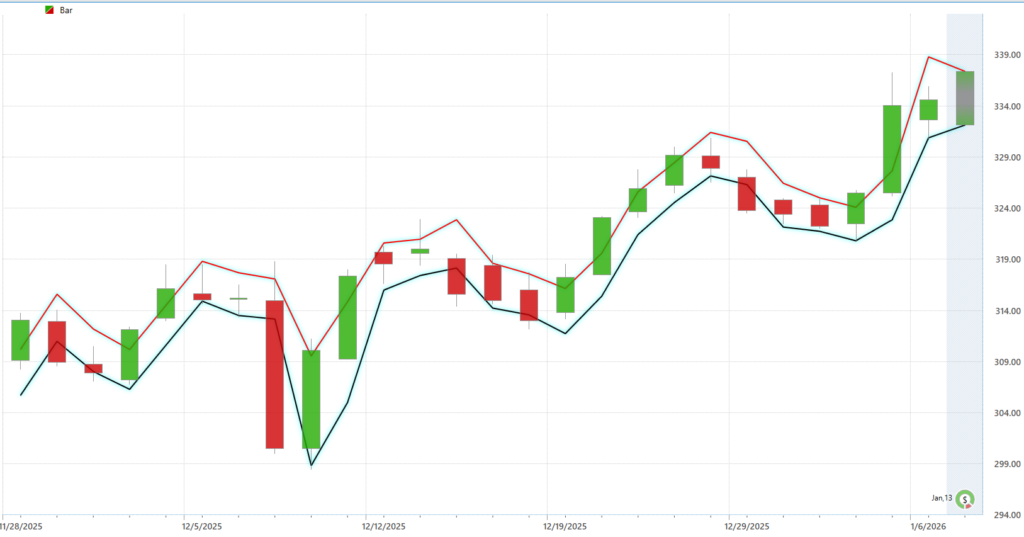
VantagePoint A.I. Predictive Blue Line
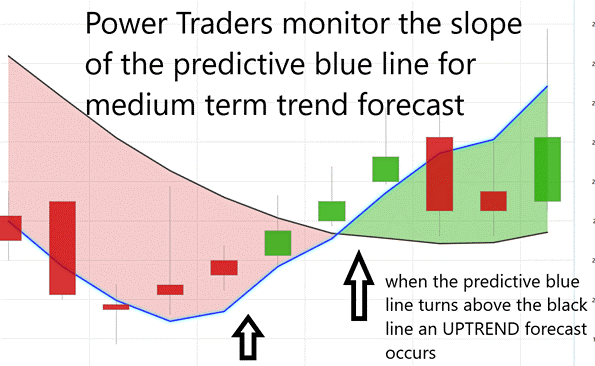
This chart is a masterclass in discipline, not prediction. The predictive blue line isn’t there to guess tomorrow’s headline or argue with your opinions, it’s there to tell you one simple thing: which side of the market deserves your money right now. When price is above the blue line and that line is rising, the market gives you permission to stay long. Not because it feels good. Not because someone on TV sounds convincing. But because the trend is aligned and momentum is working in your favor.
The rules are brutally simple, which is why most people ignore them. You don’t chase green candles when price is stretched far above the blue line, and you don’t panic on red candles as long as price respects it. Pullbacks into the predictive blue line are opportunities, not threats. They’re the market’s way of shaking out weak hands before resuming the move. Notice how the worst-looking red bars in this chart fail to break the structure.
Where traders lose money is when they abandon the rules mid-trade. They start “thinking” instead of following the signal. The predictive blue line keeps you from overtrading, from revenge trading, and from arguing with momentum. Stay with the trend while it’s intact. Step aside when it breaks. That’s it. You don’t need a forecast. You need obedience. And when you trade with the blue line instead of your emotions, the market stops feeling random and starts paying you for patience.
VantagePoint A.I. Neural Index (Machine Learning)
A neural network for trading is like a very fast, very disciplined pattern-recognizer that never gets tired, never gets emotional, and never cares about headlines. It studies mountains of historical price data, learns how markets behaved before big moves, and then applies that experience to what’s happening right now. Where humans see noise, the neural network sees probabilities. Where humans argue about opinions, it quietly measures cause and effect.
What makes this useful for traders is not prediction in the Hollywood sense, but alignment. A neural network doesn’t ask whether a stock “should” go higher. It asks whether the conditions that previously led to higher prices are present today. When they are, it signals accordingly. When they’re not, it steps aside. This helps traders avoid the most expensive mistake in the business: fighting the trend because a headline, a forecast, or a gut feeling says otherwise. The machine has no ego, and that alone gives it an edge.
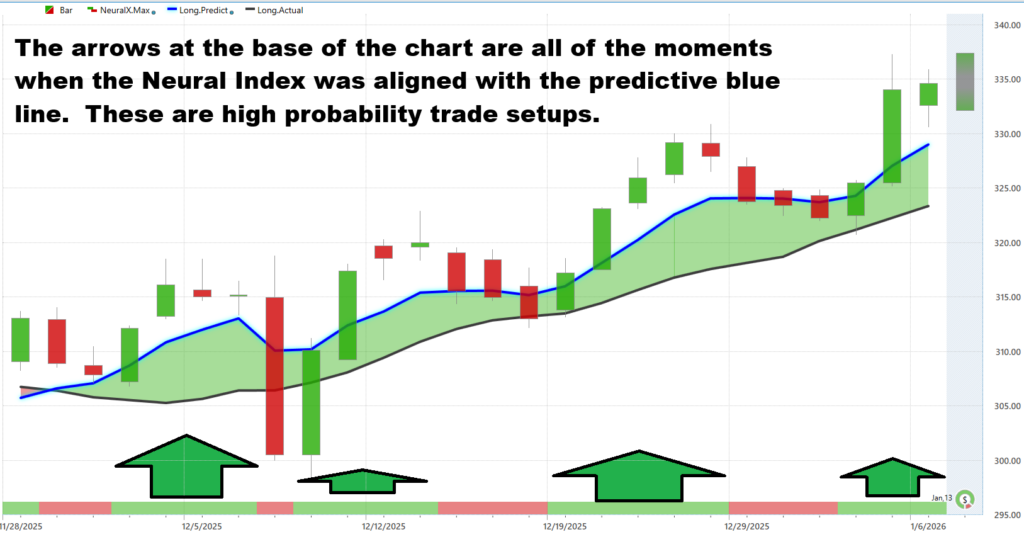
The real improvement comes in consistency. Most traders don’t fail because they lack intelligence; they fail because they lack discipline. A neural network enforces rules. It keeps traders focused on what is working now, not what worked last quarter or what sounds convincing on television. Used properly, it doesn’t replace human judgment — it sharpens it. It turns trading from a guessing game into a process, and in markets, process is what keeps you solvent long enough to win.
VantagePoint A.I. Daily Range Forecast
These next two graphics together describe a stock that looks calm only if you ignore the math. On the surface, JPM’s recent price action appears orderly — higher highs, shallow pullbacks, and a steady march toward the upper end of its range. But beneath that visual smoothness sits a trading rhythm that is anything but sedate. An average daily range of just over 2%, a weekly range near 5%, and a monthly range north of 10% tell you this is a stock that moves meaningfully and often. That combination — strong trend with persistent movement — is precisely what attracts institutional capital while quietly punishing anyone who mistakes “uptrend” for “low risk.”
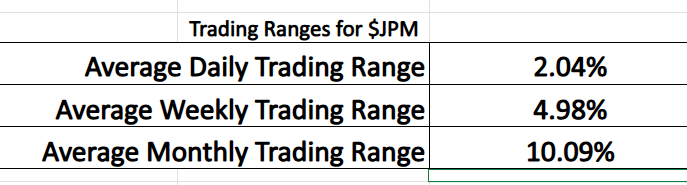
The second chart makes the point more granular. Even over a short window, $JPM routinely swings multiple dollars inside a single session, with weekly candles encompassing ranges that would have qualified as full-month moves a decade ago. The red and black guidelines reinforce the idea that price rarely travels in a straight line; it surges, retraces, resets, and then advances again. This is not erratic behavior, it’s structured volatility. The stock advances by forcing weak positioning out of the trade, repeatedly, before resuming its trend. For traders, that means timing and position sizing matter far more than conviction.
The Vantage Point A.I. Daily Range Forecast delivers guidance every day clarly defining the expectations for the following trading day.
aken together, the metrics and the price action converge on the same conclusion. JPM is trending higher, but it is doing so through constant motion. A 10% average monthly range layered on top of a bullish structure means opportunity and risk are inseparable. The stock is offering movement as the price of admission. In practical terms, this is not a chart that rewards complacency or narrow stops.
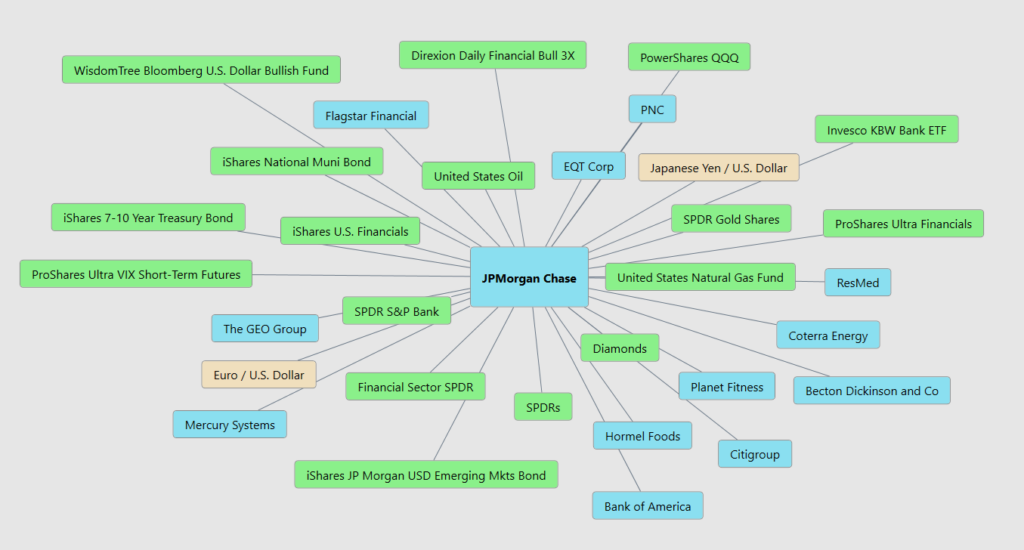
Intermarket Analysis
Here’s the simple, no-nonsense graphic to understand the 31 key drivers of $JPM price action.
Interest rates are like the volume knob on $JPM’s profits. When the Federal Reserve raises rates, $JPM makes more money because it earns more on loans than it pays on deposits. That usually helps the stock go up. When rates are cut, that spread shrinks, profits get squeezed, and the stock can wobble. That’s why every time the Fed talks, bank stocks move. It’s not magic, it’s math.
The economy matters just as much. When people have jobs and businesses are growing, they borrow more money, and $JPM gets paid. When the economy slows, people miss payments, loans go bad, and the stock takes a hit. Add inflation, government rules, and global drama into the mix, and you get volatility. Bottom line: $JPM moves based on rates, growth, and risk. Track those, and the stock stops being mysterious.
$JPM does not trade in isolation. It sits at the center of a living, breathing ecosystem where interest rates, currencies, commodities, volatility, bonds, and equities all tug on the same rope. When the Federal Reserve turns the rate dial, that signal ripples outward — through the U.S. dollar, Treasury bonds, financial ETFs, and ultimately right back into $JPM’s price. This isn’t theory. It’s plumbing. Banks live on the spread between what money costs and what money earns, and every green and blue box connected to $JPM represents a force that either widens that spread or squeezes it.
Look closely and you see why headlines are such terrible guides. A stronger dollar, shifts in the yen or euro, moves in oil and natural gas, changes in bond yields, spikes in volatility — all of them feed into $JPM’s environment before the stock ever reacts. That’s why $JPM often moves before the news makes sense. By the time commentators start debating whether banks are “good” or “bad,” the intermarket signals — financial ETFs, bond funds, currency pairs, sector SPDRs — have already voted. The stock is simply responding to conditions that were visible all along to anyone watching the relationships.
Rising rates don’t just help JPM in the abstract, they show up simultaneously in the dollar, bond funds, financial-sector ETFs, and volatility products tied directly to this network. Economic growth strengthens lending, but stress shows up just as quickly in credit-sensitive instruments and defensive assets. The lesson embedded in this graphic is simple and powerful: JPM’s price is the result, not the cause. If traders want clarity instead of confusion, they stop reacting to headlines and start tracking the relationships. When you do that, $JPM stops being mysterious and starts behaving exactly the way the data says it should.
Our Suggestion
If you strip away the cautious language and fine print, the message from the last two earnings calls is unmistakable: management is confident because the machine is working. Not euphoric. Not promotional. Confident in the way people sound when results keep showing up on schedule. They acknowledge uncertainty around rates, labor, and the macro — but they don’t sound reactive. They sound prepared. When executives are willing to put forward preliminary guidance for next year while openly stating the assumptions behind it, that’s not guesswork. That’s control.
Are they hitting their goals? Yes — especially the ones that matter. Credit quality is behaving within expectations. Consumers are still paying their bills. Fee businesses like Markets, Payments, and Investment Banking are carrying more weight, exactly as designed. Deposit share remains dominant. These aren’t flashy wins; they’re structural wins. The bank is doing what it said it would do: protect the balance sheet, grow diversified earnings, and avoid betting the franchise on a single rate outcome. That’s execution, not optimism.
The broader objective is simple and relentlessly consistent: build a bank that makes money in more than one environment. That means growing fee income so rate cuts don’t cripple earnings. It means investing in technology and scale so costs stay defensible even as expenses rise. It means holding capital strong enough to keep regulators calm and buybacks alive. Everything management talks about guidance, expense discipline, feeds into that one goal: durability.
For investors, the watchlist is equally clear. Watch net interest income as rates evolve. Watch expenses, because management is quietly signaling that consensus estimates may be too optimistic. Watch credit trends in cards and consumer lending, because that’s the early-warning system. And watch capital levels, because they determine how much cash comes back to shareholders. Do that, and you won’t need to interpret tone or speculate on headlines. The story will tell itself right there in the numbers.
Place $JPM on your trading radar. It could create numerous trading opportunities in the coming months.
Practice great money management on all your trades.
$JPM is breaking to new 52-week highs and new all-time highs.
Stocks that do that are always worth watching.
It’s not magic.
It’s machine learning.
Disclaimer: THERE IS A HIGH DEGREE OF RISK INVOLVED IN TRADING. IT IS NOT PRUDENT OR ADVISABLE TO MAKE TRADING DECISIONS THAT ARE BEYOND YOUR FINANCIAL MEANS OR INVOLVE TRADING CAPITAL THAT YOU ARE NOT WILLING AND CAPABLE OF LOSING.
VANTAGEPOINT’S MARKETING CAMPAIGNS, OF ANY KIND, DO NOT CONSTITUTE TRADING ADVICE OR AN ENDORSEMENT OR RECOMMENDATION BY VANTAGEPOINT AI OR ANY ASSOCIATED AFFILIATES OF ANY TRADING METHODS, PROGRAMS, SYSTEMS OR ROUTINES. VANTAGEPOINT’S PERSONNEL ARE NOT LICENSED BROKERS OR ADVISORS AND DO NOT OFFER TRADING ADVICE.


