


This week’s ai asset spotlight is the iShares Silver Trust ($SLV)
On December 3, 2025, we put $SLV front and center as our Asset of the Week and made one thing crystal clear: silver was no longer optional, it was leading. We told traders to forget opinions and focus on what can pay the bills: momentum, demand, and price behavior, all of which were screaming strength. At $53 an ounce, silver wasn’t “expensive” — it was breaking through 45-year highs, and when a market smashes a ceiling that’s held for half a century, that’s not noise… that’s a signal you ignore at your own risk. Since we published the Asset study $SLV is up 47% in the last 27 trading sessions. You can read the analysis here.
Silver didn’t wake up one morning and decide to run. It’s been pushed there — slowly, relentlessly by math. Demand keeps climbing while supply stubbornly refuses to cooperate. Industrial users are taking more ounces every year, and they’re not doing it for jewelry boxes or vaults. They’re doing it because silver is an input, not an opinion. Electronics, electrification, power systems. Silver gets consumed, not admired.
The industrial side of the ledger is the quiet giant. Solar panels alone pull hundreds of millions of ounces, and that number doesn’t politely step backward when prices rise. Add data centers, advanced electronics, and the wiring behind the A.I. buildout, and you get demand that behaves more like oxygen than a luxury. Industry doesn’t wait for pullbacks.
Meanwhile, supply limps along. Most silver isn’t mined because someone wants silver, it shows up as a side effect of digging for other metals. That means higher silver prices don’t magically create more silver. Miners don’t flip a switch. They wait on copper projects, zinc economics, and capital cycles measured in years, not quarters.
The result is a market that keeps running deficits. Not once. Not occasionally. Repeatedly. Year after year, more silver leaves the system than enters it. Inventories shrink, buffers thin, and eventually the market realizes it’s been living on leftovers. That’s not bullish rhetoric, it’s arithmetic.
When a commodity lives in deficit long enough, price stops behaving politely. Small changes in demand create big moves. New buyers don’t need to overwhelm the market; they just need to arrive when there’s no slack. That’s when silver stops grinding and starts jumping.
There’s also a persistent message being delivered to investors: silver is both an industrial metal and a monetary one. That combination matters. Industrial demand provides a floor, while monetary demand provides torque. When capital looks for something tangible, something that can’t be printed; silver gets noticed very quickly.
Another consistent theme is that silver rarely reprices smoothly. It spends long stretches doing nothing useful, frustrating everyone involved. Then, when the physical reality asserts itself, it moves fast and without apology. These aren’t emotional markets; they’re delayed reactions to pressure that’s been building quietly.
Price discovery plays a role too. When physical tightness increases, paper markets can pretend everything is fine, until they can’t. Eventually, deliveries matter. Availability matters. At that point, price adjusts not because sentiment changed, but because inventory did.
Momentum becomes the accelerant. Once silver clears key levels, technical buyers pile in, trend followers wake up, and suddenly everyone discovers the same story at the same time. That’s when headlines say silver “exploded,” even though the fuse was lit years earlier.
The takeaway is simple and deeply inconvenient: silver isn’t moving because of hype. It’s moving because demand is persistent, supply is constrained, and deficits don’t resolve themselves politely. When the market finally reconciles those facts, it doesn’t whisper. It shouts.
For years, silver occupied an awkward place in the financial imagination, often labeled “poor man’s gold,” a volatile understudy that moved only when gold gave it permission. That framing no longer fits the facts. In January 2026, the market crossed a psychological
threshold when a single one-ounce American Silver Eagle sold for more than $100 at retail, a level that would have sounded unserious not long ago. What looked like a niche anomaly now reads more like a signal.
The price action has been difficult to ignore. Silver has climbed nearly 200% over the past 12 months, rising from roughly $30 in early 2025 to more than $88 per ounce on the spot market. The move has not been subtle, nor has it been confined to futures charts followed only by specialists.
Exchange-traded exposure has followed. The iShares Silver Trust (NYSE: SLV) is up 43% in the past month alone, while silver-focused miners such as First Majestic Silver Corp. (NYSE: AG) and Pan American Silver Corp. (NYSE: PAAS) have surged alongside it. Equity investors, often late to commodity cycles, appear to be catching up quickly.
Part of the explanation lives in what some are calling Silver Squeeze 2.0. Retail investors — coordinating across platforms like X and Reddit — have once again targeted physical silver. This time, however, the effort looks materially different from the short-lived 2021 episode. Inventories are being drained.
The critical distinction is delivery. Investors are no longer content with paper exposure; they are demanding metal in hand. Dealers report rising premiums and persistent restocking challenges, suggesting that physical tightness — not online enthusiasm — is doing the heavy lifting.
At the same time, silver’s industrial relevance has quietly become impossible to dismiss. The metal is the most conductive element known, which makes it indispensable to two of the most capital-intensive growth themes in the global economy.
Artificial intelligence is one of them. Every A.I. server, high-speed chip, and data-center rack relies on silver’s conductivity and reliability. As large technology companies scale A.I. infrastructure, silver demand scales with it — mechanically, not rhetorically.
Solar technology is the other. Photovoltaic demand has reached record levels as governments and corporations push toward 2030 clean-energy targets. Solar panels consume silver in quantities that don’t flex easily with price, reinforcing demand even during volatility.
Overlay those forces with supply, and the picture tightens further. The world has entered what the Silver Institute describes as its sixth consecutive year of structural supply
deficit. Add new export restrictions from China, and silver begins to look less like a niche commodity and more like a strategic input.
The old narrative framed silver as a derivative trade. The emerging reality frames it as a bottleneck — industrial, monetary, and increasingly political. Markets tend to adjust slowly to those kinds of redefinitions, and then all at once.
In this asset study, we are not here to cheer for a ticker or chase whatever the market happens to be flashing today. We are here for one reason only, to find out what is driving the move and whether it is strong enough to keep paying you after the excitement wears off. Every chart tells a story, but only the numbers tell the truth, and our job is to decide quickly and unemotionally whether this asset earns a place in your portfolio or gets discarded without regret.
That means no guesswork, no superstition, and no emotional attachment. The tools we are using are built on years of market data, repeatable behavior patterns, and predictive intelligence designed to do the heavy lifting for you. Because the goal is not to feel smart, it is to put yourself on the right side of a move while the market does what it always does, reward discipline and punish hope.
We will analyze the following indicators in this asset study:
· 52 Week High and Low Boundaries
· Best-Case / Worst-Case Scenario Analysis
· VantagePoint A.I. Predictive Blue Line
· Neural Network Forecast (Machine Learning)
· VantagePoint A.I. Daily Range Forecast
· Intermarket Analysis
· Our Suggestion
Artificial intelligence may provide the forecast, but it works best when it is aligned with the reality of the asset itself. For $SLV, understanding the underlying fundamentals, risk environment, and broader market context explains why the model is leaning bullish and whether the next move is a high-conviction trend or noise best avoided.
52 Week High and Low Boundaries
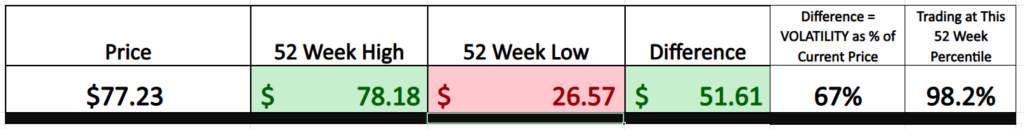
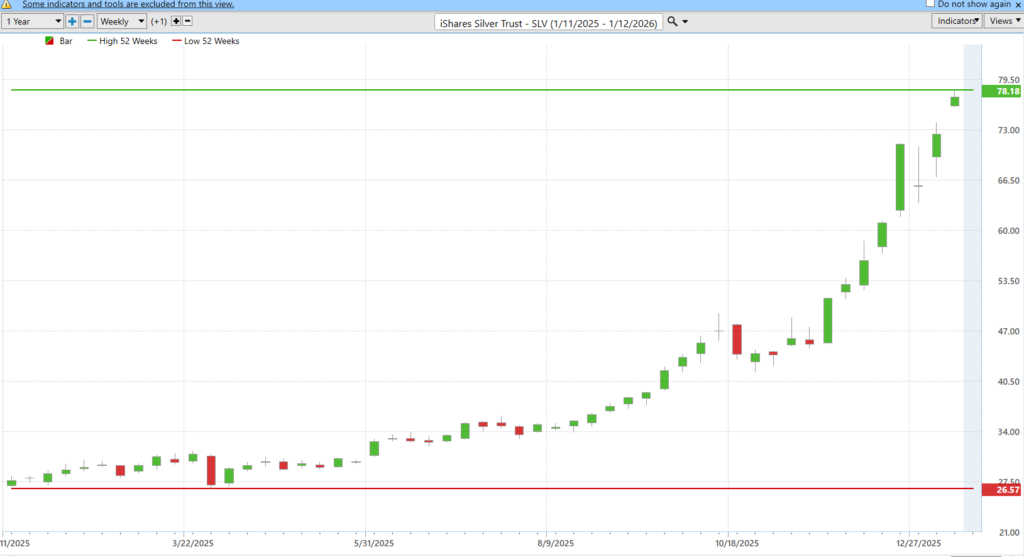
Silver, it turns out, has no interest in modesty. The charts show $SLV repeatedly doing what polite markets are not supposed to do, making new all-time highs and then acting as if that were simply the next item on the agenda. That alone is noteworthy, because markets that keep printing highs are telling you something important. They are not debating value, they are discovering it. Even more revealing is the steadily expanding annual trading range, which is the market’s way of announcing that calm certainty has left the building and both volatility and opportunity have taken up residence.
When you zoom out and compare that annual range to today’s price, the message becomes even louder. A historic volatility reading of 67% is not a warning label, it is a description of the terrain. If the future behaves anything like the recent past, it would be perfectly normal for $SLV to trade roughly 67% higher or lower than where it sits today. That does not mean it will do all of that, but it does mean traders should stop thinking in neat, tidy increments and start respecting the fact that this market has plenty of room to roam, and little interest in staying where it is for long.
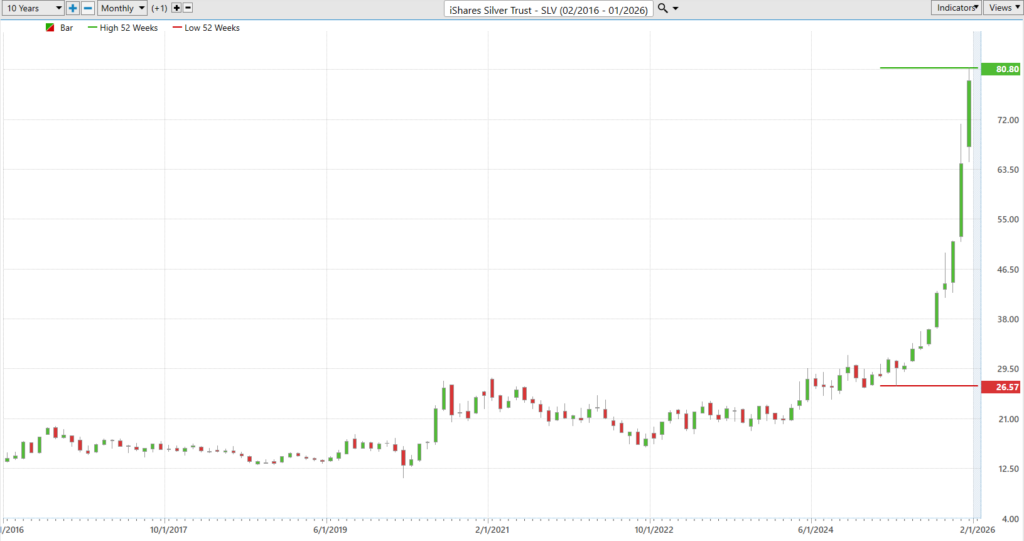
This 10-year monthly chart of $SLV reads less like a price series and more like a long meeting the market kept postponing. For nearly a decade, silver moved sideways, flirted with
breakouts, and repeatedly failed to convince investors that anything had really changed. Then, quietly at first and unmistakably after, the consolidation ended. When an asset breaks out of a structure that long, it is the market’s way of tapping you on the shoulder and saying, pay attention. When it follows that breakout by printing new all-time highs, the message gets louder. Something material is happening.
The move through prior ceilings is not just technical housekeeping. It represents a shift in behavior, psychology, and capital allocation that only shows up after years of digestion. The market spent a decade absorbing supply, testing patience, and shaking out conviction. Now price is doing the one thing it could not do before, move freely. That is not coincidence. Markets do not wander into all-time highs by accident after ten years of confinement. They arrive there because conditions underneath have changed in ways price can no longer hide.
The structure matters here. A long consolidation compresses expectations and dulls attention. Breakouts release both at once. The widening range, the accelerating slope, and the absence of nearby resistance all point to a market that has stopped arguing with itself. In that sense, the chart is not predicting anything. It is reporting a verdict.
This is why traders pay attention to moments like this. Not because they are comfortable or orderly, but because they are rare. Volatility expands, opportunity expands with it, and price becomes the most honest narrator in the room. Silver is no longer sending subtle signals. It is doing what markets do when something significant has shifted. It is making an announcement.
Best-Case/Worst-Case Scenario Analysis
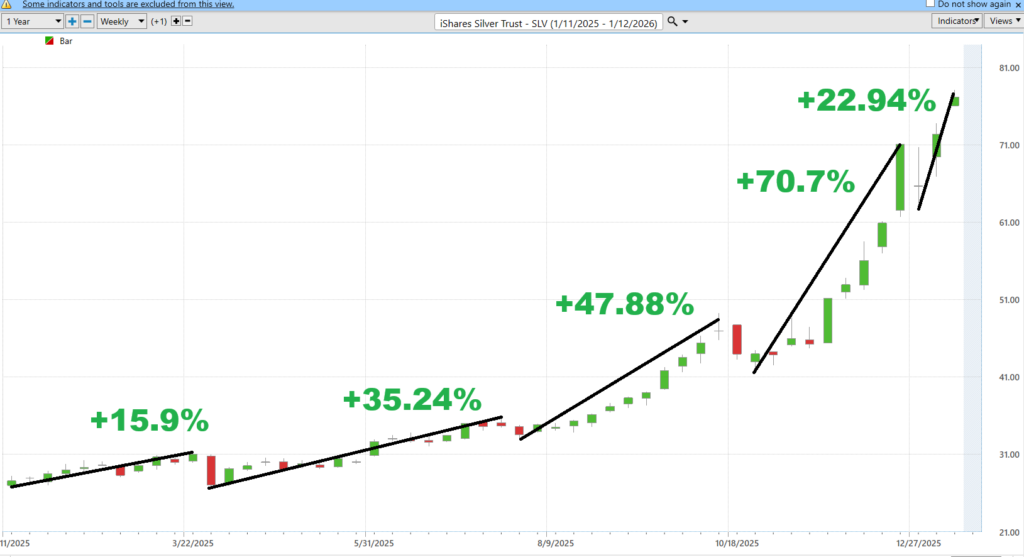
If you want to understand volatility, forget the textbook definitions and start with what the market gives you when you get it right. In $SLV, the upside is not theoretical. It is visible, repeatable, and fast. The rallies in the first graphic tell that story clearly: +16%, +35%, +48%, +70%, and another +20%+ on the most recent surge. These are not outliers. They are how silver behaves once momentum takes hold. When $SLV runs, it does not wander. It accelerates. This is the kind of movement that pays for mistakes, offsets losers, and makes patience worthwhile, provided you are positioned to benefit from it.
But markets never give without taking, and that is where the second chart earns its keep. Flip the lens and the downside comes into focus just as sharply. Declines of 8%, 10%, 14%, even 15% appear with uncomfortable regularity, and they tend to arrive quickly. These are not polite pullbacks. They are stress tests. If your position size cannot withstand that kind of hit, the market will remove you from the trade before the next advance ever begins.
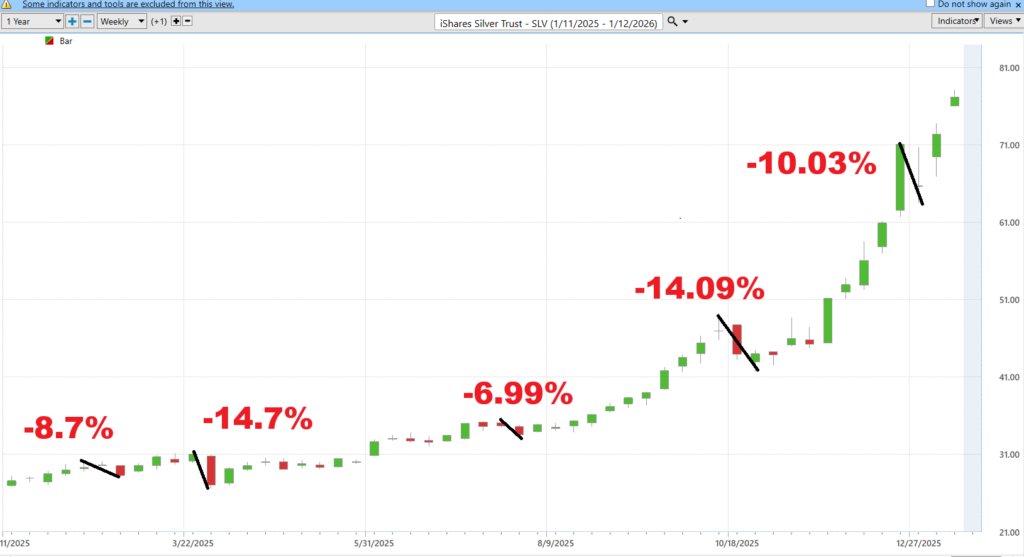
Put the two sides together and the personality of $SLV becomes unmistakable. This is a market built on big swings and compressed timelines. It rewards preparation and punishes carelessness. Professionals obsess over this comparison for a reason. Knowing that the downside routinely lives in the 10 – 15% range allows you to size a position so the pain is survivable. Knowing that the upside frequently stretches 30–50% or more ensures the wins matter.
This is what tradable volatility looks like in the real world. Defined advances. Violent corrections. Clear opportunity on both sides of the equation. $SLV does not whisper these lessons or hide them behind complexity. It shows you exactly how far it can move, how fast it can do it, and what it demands in return. Once you start measuring the size of those swings instead of reacting to every blip, volatility stops being something to fear and becomes something you can use.
Next, we compare $SLV to the broader stock market averages to compare performance and volatility across different time frames.
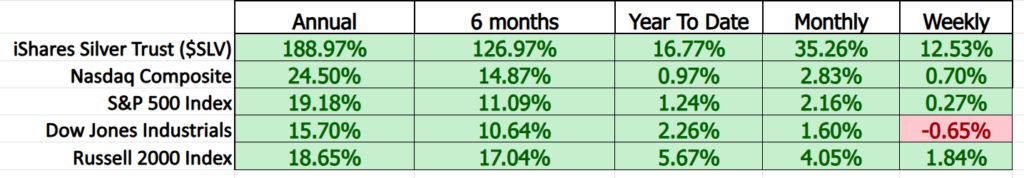
Look at the table and try not to blink. $SLV is up nearly 189% over the past year and 127% in just six months, while the major stock indexes are jogging along in the teens and single digits, stopping occasionally to check their shoelaces. This is not a close race. Silver is not outperforming by a little, it is running laps around the alternatives. When one asset is compounding triple-digit gains while the S&P 500, Nasdaq, and Dow are still arguing about direction, the market is telling you that something very different is driving this move.
That forces the only question that matters: why silver? The answer is not a mystery, and it is not a slogan. Silver sits at a rare intersection. It is an industrial metal that gets consumed in technology, energy, and infrastructure, and at the same time it is a monetary metal that attracts capital when trust in paper promises starts to wobble. Most assets get one tailwind or the other. Silver gets both. And when an asset is pulled by two powerful forces at once, it does not walk with the market. It separates from it.
VantagePoint A.I. Predictive Blue Line
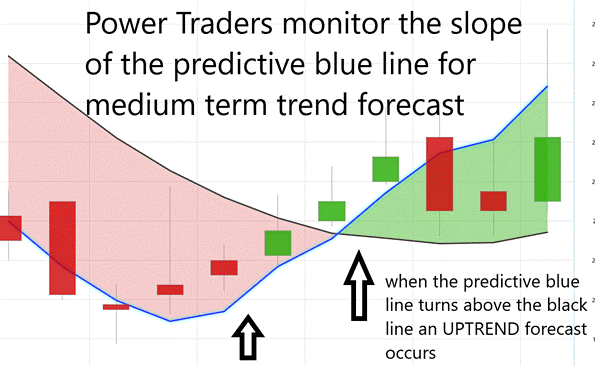
The graphic distills the logic behind the VantagePoint A.I. predictive blue line into a simple rule set that is deliberately hard to overthink. Traders are not asked to predict tops, bottoms, or headlines. They are asked to observe slope and relationship. When the predictive blue line is falling and below the black line, the model is signaling downside pressure and caution. When that blue line turns higher and crosses above the black line, the forecast shifts to an uptrend. That crossover is not a suggestion, it is a change in the statistical outlook. The discipline is in following the signal, not arguing with it. The slope tells you where price pressure is heading, the crossover tells you when the market’s posture has changed, and the trade is managed by staying aligned with that forecast until the VantagePoint A.I. says otherwise.
On November 6, the VantagePoint A.I. did something unfashionable in modern markets. It picked a side and stuck with it. The predictive blue line turned higher, crossed where it needed to cross, and calmly announced an upside forecast while most humans were still arguing with their screens. Since then, $SLV has gone on to rise roughly 71%, which is the market’s way of rewarding people who listened to math instead of opinions. This was not a one-day wonder or a blink-and-you-miss-it event. It was a trend that unfolded in plain sight, week after week, for anyone willing to pay attention and resist the urge to overcomplicate things.
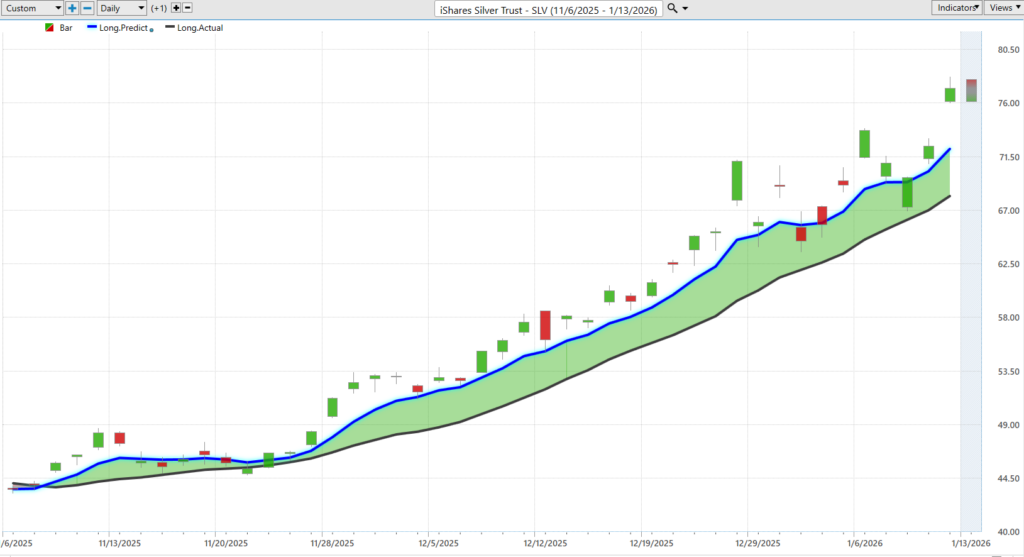
What makes the move almost unfair is how many polite invitations the market handed out along the way. The rule was simple. If you were a VantagePoint A.I. family member, you were looking to position LONG at or below the predictive blue line, not chase candles that looked exciting on social media. And the market obliged repeatedly. Over the past ten weeks, pullbacks and pauses brought price back toward that blue line again and again, offering entry points that did not require heroics, clairvoyance, or caffeine-fueled bravery. The lesson here is not that silver went up. The lesson is that trends, when identified early, tend to be generous to those who follow rules instead of headlines.
VantagePoint A.I. Neural Index (Machine Learning)
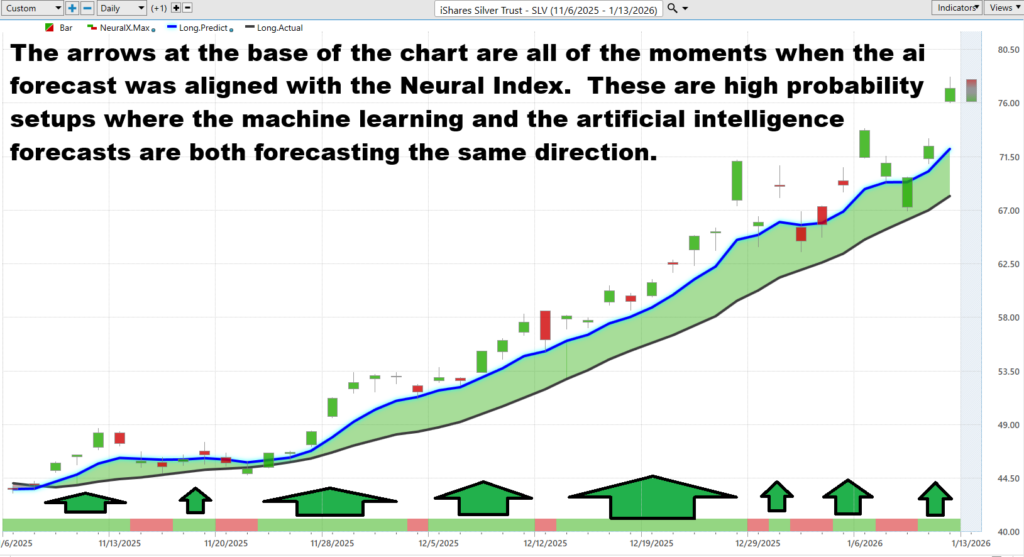
This chart is what it looks like when probability lines up instead of arguing with itself. The arrows at the bottom are not decoration. They mark the moments when the A.I. forecast and the Neural Index were pointing in the same direction, which is trader shorthand for the market clearing its throat before making a move. When machine learning and artificial intelligence agree, the signal gets louder, not noisier. You are not guessing what might happen. You are observing what the data says is most likely to happen next.
What follows is exactly what you would expect when the odds tilt this heavily. Price respects the predictive blue line, trends persist, and pullbacks become opportunities instead of panic events. Each arrow represents a moment where risk was defined, direction was clear, and patience was rewarded. This is not about catching tops or bottoms. It is about recognizing when the market is aligned, stepping in when probability is on your side, and letting the trend do the work. When forecasts agree, markets tend to behave. And when markets behave, traders get paid.
VantagePoint A.I. Daily Range Forecast

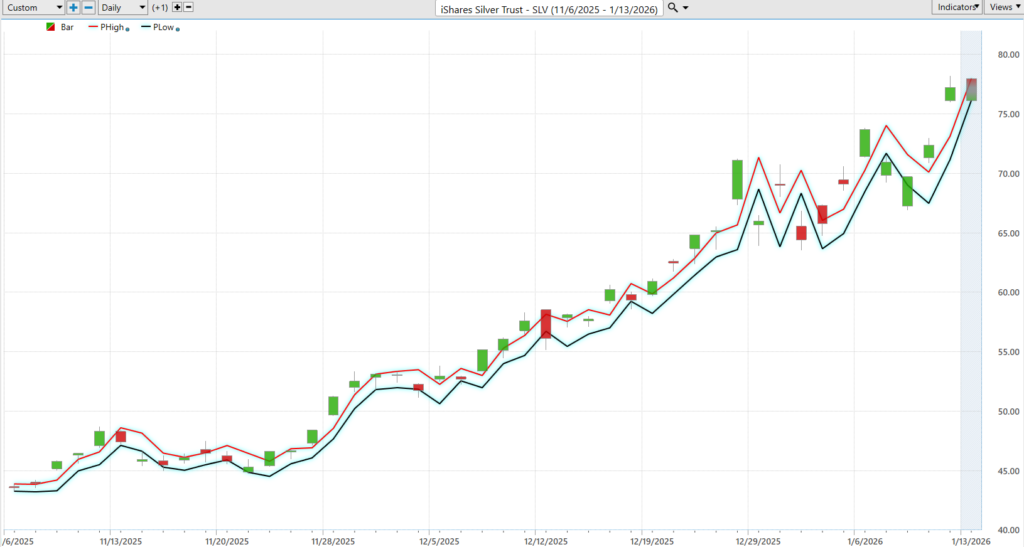
In a market like $SLV, where price does not stroll so much as sprint, knowing the terrain matters. The trading range table tells you exactly what kind of environment you are dealing with. An average daily range of 1.85%, a weekly range north of 5%, and a monthly swing approaching 14% is not background noise. That is the market’s natural breathing pattern. Volatility here is not an event. It is the baseline. And when volatility is the default setting, precision stops being a luxury and starts becoming survival gear.
This is where the VantagePoint A.I. Daily Range Forecast earns its keep. The chart shows how price consistently interacts with the projected high and low boundaries, respecting them far more often than random chance would allow. That matters because most traders do not lose by being wrong about direction. They lose by being wrong about timing. Chasing price near projected highs, panicking near projected lows, or entering trades without understanding how much room the market typically needs to move is how discipline quietly leaks out of an account. The daily range forecast gives context to the moment. It tells you when price is stretched, when it is compressed, and when risk is asymmetric in your favor.
This tool is not about trading faster or louder. It is about trading with awareness. In a market like $SLV, where daily movement can undo sloppy decisions in hours, knowing the most probable boundaries of price action changes how you behave. You stop reacting and start planning. You stop guessing and start measuring. Advantage in markets like this does not come from confidence or courage. It comes from preparation. And when volatility shows up every day, preparation is the edge that keeps you in the game while everyone else is still reacting to the last candle.
Intermarket Analysis
Intermarket analysis is a fancy Wall Street phrase for a very simple idea: nothing in the market moves alone. Stocks, bonds, currencies, commodities, and sectors all talk to each other, whether they mean to or not. Traders who practice intermarket analysis are basically eavesdropping. Instead of staring at one chart and hoping for the best, they look around to see what related markets are doing first, because price often moves there before it shows up here.
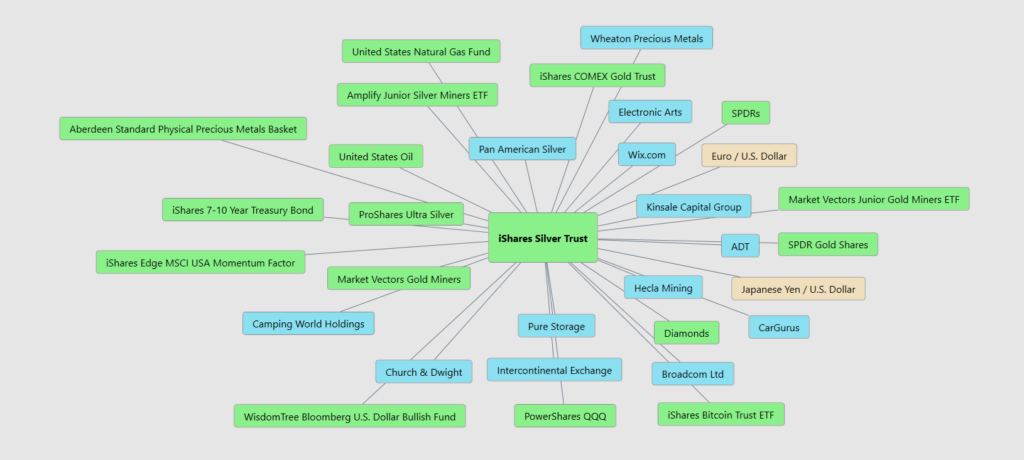
Now look at this graphic and notice what it is quietly shouting. $SLV is sitting in the middle like the hub of a very busy airport, with dozens of other markets flying in and out. Gold, silver miners, junior miners, oil, natural gas, the dollar, foreign currencies, bonds, momentum stocks, Bitcoin, and even tech names all connect back to silver. This tells you something important. Silver is not just reacting to one thing. It is being pushed and pulled by money flows, inflation fears, industrial demand, currency moves, and investor psychology all at the same time.
When that many roads lead to the same place, price tends to move with purpose. If gold is strong, miners usually follow. If the dollar weakens, silver often catches a bid. If inflation expectations rise, money looks for hard assets. If risk appetite increases, miners and leveraged silver products get attention. This web of relationships explains why silver can suddenly take off when it looks quiet on the surface. Traders who understand intermarket analysis are not surprised by these moves. They see the pressure building before the breakout.
The big lesson here is simple and very unglamorous. $SLV is not a coin flip. It is the result of many markets leaning in the same direction at once. Intermarket analysis helps traders stop guessing and start listening. And when enough markets start telling the same story, silver does not whisper. It moves.
Our Suggestion
Whether you cheer for silver or roll your eyes every time it trends on social media is completely irrelevant. The metal is leading, full stop. Markets do not reward opinions, they reward momentum, demand, and behavior. Right now, silver is doing all three at once. What once sounded “expensive” at $53 an ounce now looks laughably cheap in hindsight, because markets breaking through multi-decade ceilings are not negotiating. When price tears through barriers that held for nearly half a century, that is not excitement. That is information.
And the information today is clearer than it has ever been. Silver is no longer just a hedge or a historical curiosity, it is infrastructure. Leading analysts have been blunt about this shift. Artificial intelligence data centers require massive amounts of silver for conductivity, reliability, and heat efficiency. Solar energy has turned silver into a consumable, not a collectible, with record volumes being locked into panels every year. This is industrial demand that does not care about headlines or pullbacks. At the same time, silver still carries its monetary DNA, attracting capital whenever confidence in paper systems wobbles. Few assets on Earth get pulled by both forces at once. Silver does.
That dual role is why ignoring this market would be a mistake. You do not need to worship silver, trade it every day, or build a shrine out of bullion. But you do need to watch it. The best traders learn by observing leadership in real time, not by arguing with it after the fact. Markets that rewrite history tend to keep teaching lessons long after the headlines move on, and silver is currently teaching one of the clearest classes in market behavior you will ever see.
Yes, silver is volatile. It always has been. That volatility scares people who want tidy charts and predictable moves. But volatility is not a flaw here, it is a feature. It is what happens when industrial users, governments, and investors all reach for the same finite supply at the same time. There is no hidden warehouse of spare silver waiting to calm things down. When demand surges, price does not tiptoe. It lunges.
And this is not new behavior. Silver has been money, power, and leverage for thousands of years. Empires measured themselves by it. Wars were funded with it. Trade routes were built around it. Long before algorithms, apps, or central banks, silver already knew how humans behave when trust gets thin. So, when silver starts acting like it matters again, it is not reinventing itself. It is remembering who it has always been.
The takeaway is simple and uncomfortable. Silver is not whispering. It is making announcements. We expect $SLV to offer numerous trading opportunities in the weeks and months ahead. Manage risk intelligently. Respect volatility. Use tools like the VantagePoint A.I. Daily Range Forecast to identify high-probability entries and exits.
It is not magic.
It is machine learning.
Disclaimer: THERE IS A HIGH DEGREE OF RISK INVOLVED IN TRADING. IT IS NOT PRUDENT OR ADVISABLE TO MAKE TRADING DECISIONS THAT ARE BEYOND YOUR FINANCIAL MEANS OR INVOLVE TRADING CAPITAL THAT YOU ARE NOT WILLING AND CAPABLE OF LOSING.
VANTAGEPOINT’S MARKETING CAMPAIGNS, OF ANY KIND, DO NOT CONSTITUTE TRADING ADVICE OR AN ENDORSEMENT OR RECOMMENDATION BY VANTAGEPOINT AI OR ANY ASSOCIATED AFFILIATES OF ANY TRADING METHODS, PROGRAMS, SYSTEMS OR ROUTINES. VANTAGEPOINT’S PERSONNEL ARE NOT LICENSED BROKERS OR ADVISORS AND DO NOT OFFER TRADING ADVICE.


