Hot Stock Snapshot was created for one purpose: to help traders quickly understand why a stock from our Hot Stocks Outlook is moving, what themes are driving it, and whether the trend deserves attention. In just a few charts and a few minutes, we isolate the essential story behind the price action. Not the noise. Not the endless opinions. Just the facts, the momentum, the capital flows, and the catalysts that matter. Every Snapshot is designed to answer the most important question in speculation: Who is winning, and why? Because in markets, opportunity rarely arrives with a formal invitation. It reveals itself first in performance.
Advanced Micro Devices ($AMD) is not some sleepy old chip company trying to survive in the shadow of Silicon Valley giants. This is one of the most important semiconductor companies on the planet right now. Advanced Micro Devices designs the high-performance chips powering artificial intelligence servers, gaming systems, cloud computing infrastructure, data centers, and advanced computing systems used by corporations and governments around the world. AMD operates inside the semiconductor sector, but that description barely captures what is happening here. Semiconductors have become the digital oil fields of the modern economy. Every AI model, every autonomous system, every advanced military platform, every hyperscale cloud network depends on computing power. And Wall Street knows it.
That is why this stock has been on fire.
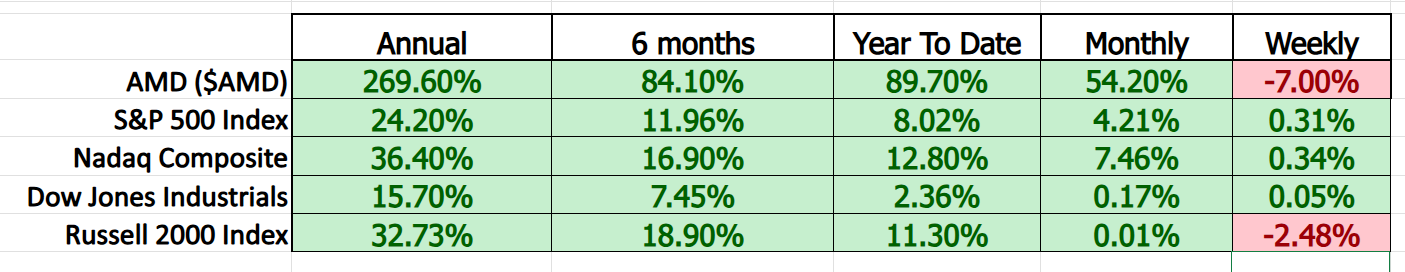
Over the last several months AMD has transformed from a strong stock into what traders would call a momentum monster. The market is aggressively rewarding companies connected to artificial intelligence infrastructure, and AMD sits directly in the center of that spending boom. Institutions are not buying these names because of headlines. They are buying because governments, corporations, and technology firms are racing to secure computing power for the next decade.
And when institutional money starts flowing into a stock like this, trends can move far further than most traders believe possible.
That becomes obvious when you study the Best Case Scenario analysis chart.
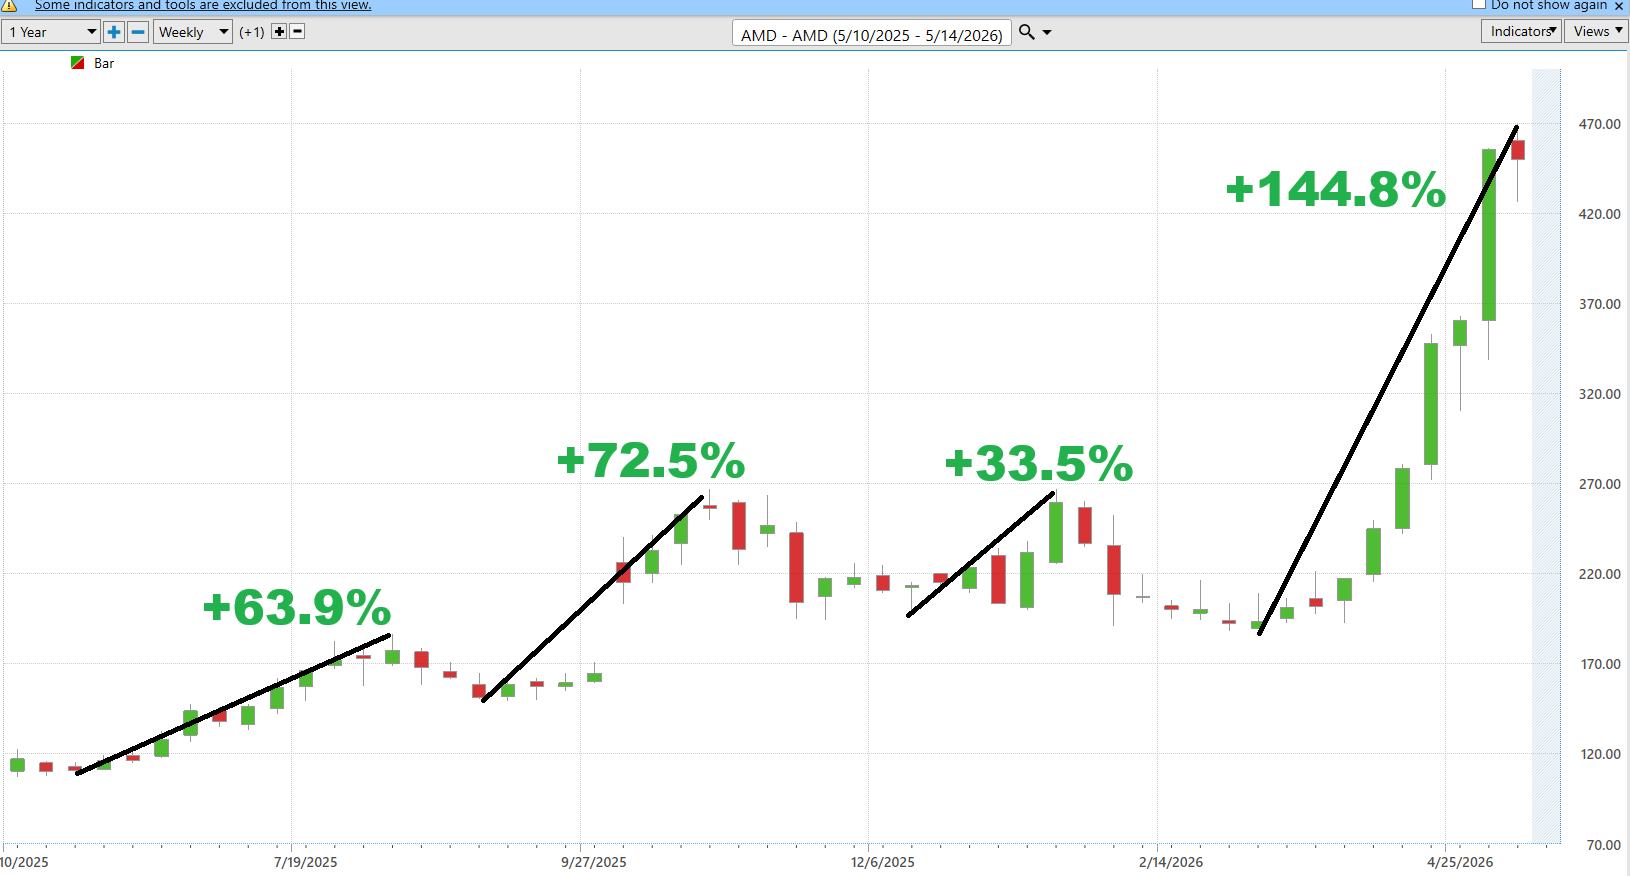
The largest uninterrupted rallies in AMD over the past year were +63.9%, +72.5%, +33.5%, and most recently an astonishing +144.8% advance. Think about that for a moment. Traders spend enormous amounts of time trying to predict what “should” happen. But markets do not care about opinions. They care about money flow. This chart shows something extremely important. When AMD enters sustained momentum phases, the advances become explosive. That does not mean the stock moves straight up forever. It means that strength in AMD has historically shown an ability to compound once momentum and institutional participation align together.
But the other side of the equation matters just as much.
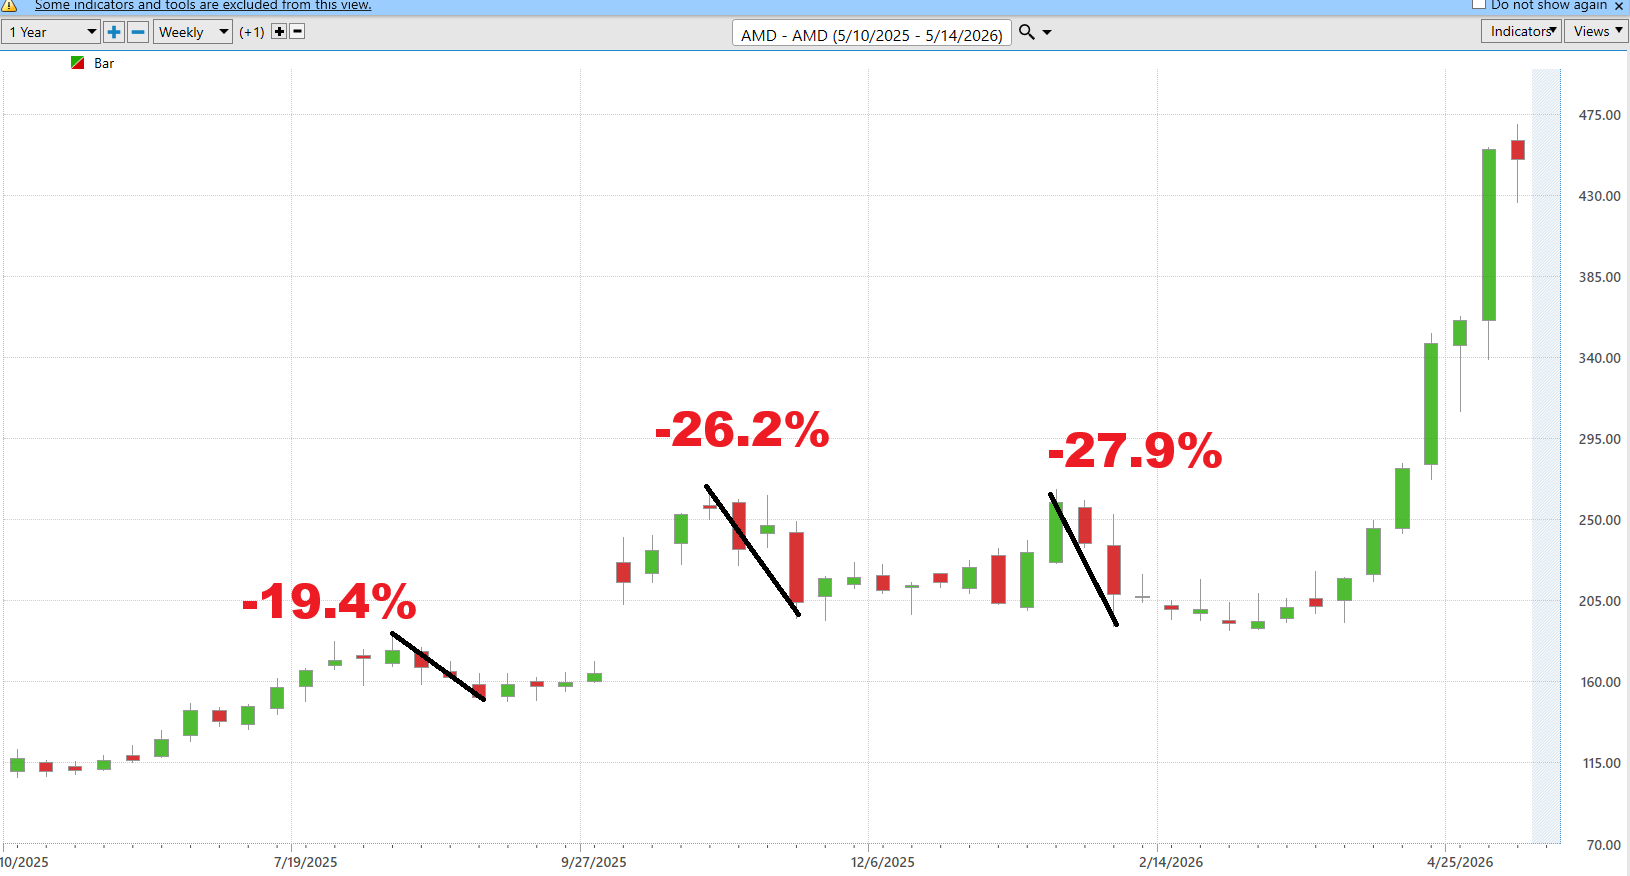
The Worst Case Scenario chart reminds traders that volatility cuts both ways. AMD also experienced declines of -19.4%, -26.2%, and -27.9% during the same period. This is critical because it teaches traders how to think properly about risk. Good traders do not obsess over predicting every move. They prepare themselves emotionally and financially for volatility before the trade ever happens. The biggest mistake inexperienced traders make is believing great companies only move upward. Reality is different. Strong stocks experience violent pullbacks all the time. Understanding the size of those pullbacks is what allows traders to properly manage position size and expectations.
Now look at the Predictive Blue Line chart.
This is where things become extremely interesting.
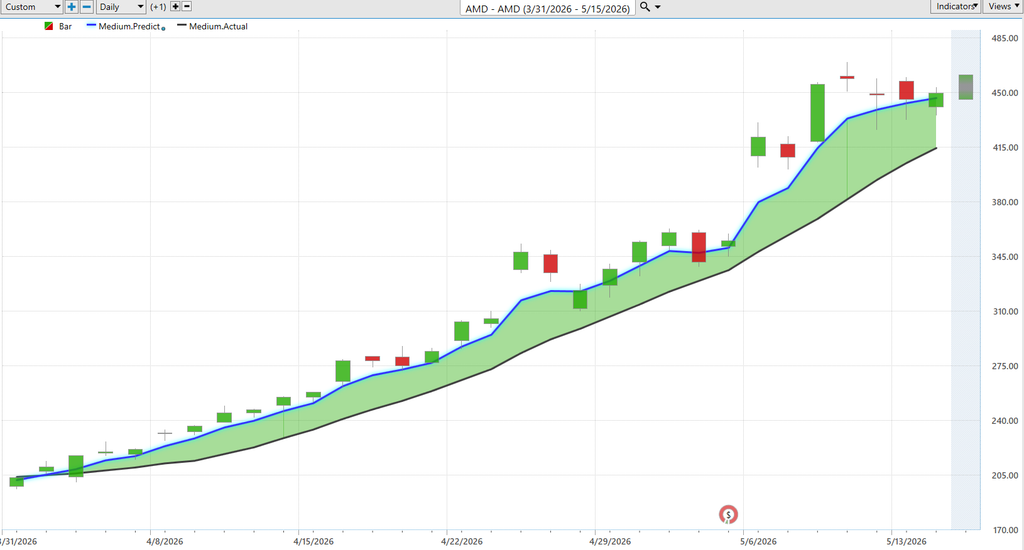
The blue predictive line remains above the black 10 day simple moving average, and the slope continues pointing higher. That matters because trends tend to remain in motion far longer than logic would suggest. Instead of guessing where AMD might go next, traders can focus on what the market is actually doing right now. The predictive trend remains upward. Pullbacks toward the predictive line have repeatedly acted as launching pads for the next advance. In strong momentum environments, this becomes one of the clearest ways to identify whether institutional buying pressure remains intact.
Then comes the Neural Index.
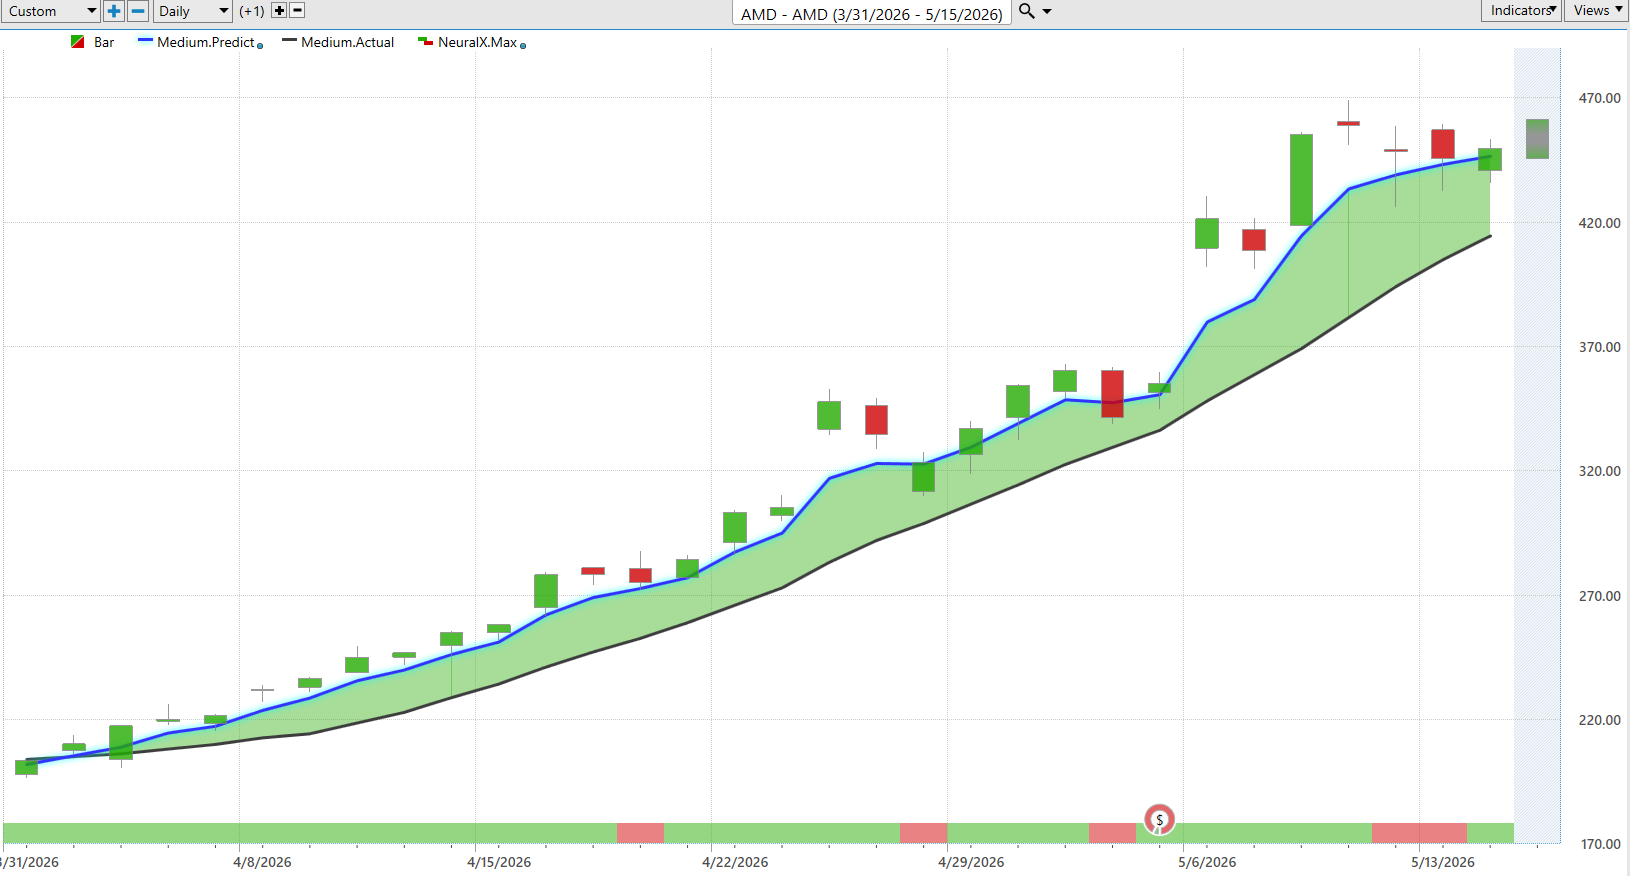
This indicator acts like an early warning system for short-term strength and weakness over the next 48 to 72 hours. What stands out immediately is how consistently the Neural Index has stayed green throughout most of AMD’s recent advance. That tells traders something important. Momentum has not simply been random. The market has remained internally supportive of higher prices. Yes, there were brief moments of weakness shown by the red signals, but each time buyers stepped back in aggressively. That pattern often appears in the strongest trends because institutions rarely buy all at once. They accumulate over time.
Finally, the Daily Range Forecast chart shows where risk and opportunity may live each trading day.
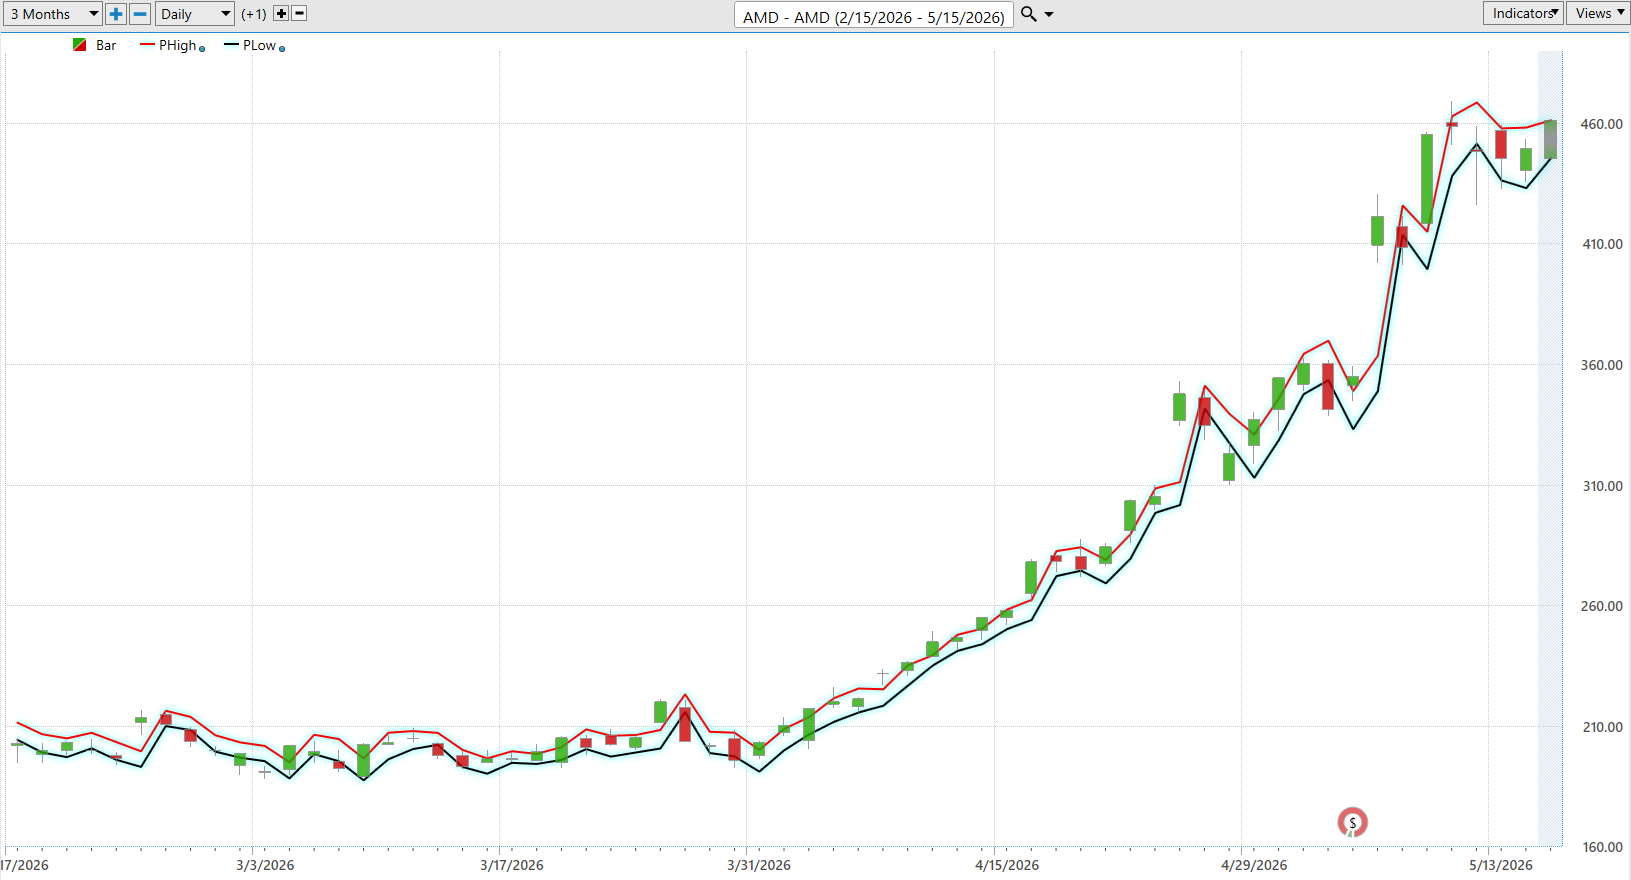
Every trader understands volatility. What traders really want to know is where the battlefield exists before the opening bell rings. AMD’s forecast ranges have continued expanding higher as price climbs. That reflects increasing momentum and increasing participation. In plain English, the stock is moving with force. For traders, that information becomes incredibly valuable because it helps frame realistic expectations for daily movement rather than relying on emotion or hope.
The bigger message across all these charts is simple.
AMD is not behaving like a weak stock fighting for survival. It is behaving like a leadership stock attracting institutional capital in one of the strongest sectors in the world.
And leadership matters.
Pay attention. Our suggestion is to watch $AMD closely and put it on your watchlist.
Ready to learn more about forecasting stocks and options days before anyone else with up to 87.4% proven accuracy? Attend a FREE LIVE CLASS.
Let’s Be Careful Out There.
It’s not magic.
It’s machine learning.
THERE IS A SUBSTANTIAL RISK OF LOSS ASSOCIATED WITH TRADING. ONLY RISK CAPITAL SHOULD BE USED TO TRADE. TRADING STOCKS, FUTURES, OPTIONS, FOREX, AND ETFs IS NOT SUITABLE FOR EVERYONE.IMPORTANT NOTICE!
DISCLAIMER: STOCKS, FUTURES, OPTIONS, ETFs AND CURRENCY TRADING ALL HAVE LARGE POTENTIAL REWARDS, BUT THEY ALSO HAVE LARGE POTENTIAL RISK. YOU MUST BE AWARE OF THE RISKS AND BE WILLING TO ACCEPT THEM IN ORDER TO INVEST IN THESE MARKETS. DON’T TRADE WITH MONEY YOU CAN’T AFFORD TO LOSE. THIS ARTICLE AND WEBSITE IS NEITHER A SOLICITATION NOR AN OFFER TO BUY/SELL FUTURES, OPTIONS, STOCKS, OR CURRENCIES. NO REPRESENTATION IS BEING MADE THAT ANY ACCOUNT WILL OR IS LIKELY TO ACHIEVE PROFITS OR LOSSES SIMILAR TO THOSE DISCUSSED ON THIS ARTICLE OR WEBSITE. THE PAST PERFORMANCE OF ANY TRADING SYSTEM OR METHODOLOGY IS NOT NECESSARILY INDICATIVE OF FUTURE RESULTS. CFTC RULE 4.41 – HYPOTHETICAL OR SIMULATED PERFORMANCE RESULTS HAVE CERTAIN LIMITATIONS. UNLIKE AN ACTUAL PERFORMANCE RECORD, SIMULATED RESULTS DO NOT REPRESENT ACTUAL TRADING. ALSO, SINCE THE TRADES HAVE NOT BEEN EXECUTED, THE RESULTS MAY HAVE UNDER-OR-OVER COMPENSATED FOR THE IMPACT, IF ANY, OF CERTAIN MARKET FACTORS, SUCH AS LACK OF LIQUIDITY. SIMULATED TRADING PROGRAMS IN GENERAL ARE ALSO SUBJECT TO THE FACT THAT THEY ARE DESIGNED WITH THE BENEFIT OF HINDSIGHT. NO REPRESENTATION IS BEING MADE THAT ANY ACCOUNT WILL OR IS LIKELY TO ACHIEVE PROFIT OR LOSSES SIMILAR TO THOSE SHOWN.