


This week’s ai stock spotlight is Bloom Energy ($BE)
Back in late August, we were excited to feature Bloom Energy ($BE) in our VantagePoint A.I. Stock of the Week series — and we’ll admit, we’re even more excited to revisit it now. We already alerted you, our readers, to it, and we remain quietly impressed by the way it kept pushing higher while most of Wall Street was too busy chasing shinier objects.
Well, we’re back at it again this week, because Bloom Energy ($BE) isn’t just holding its ground, it’s rewriting the playbook. The company’s story, its technology, and its timing have all collided with one of the biggest forces shaping the markets today: the artificial intelligence infrastructure boom. And somehow, in this whirlwind of algorithms and server farms, Bloom has managed to make power generation — honest-to-goodness electricity — feel like the most exciting thing in tech.
Bloom Energy has found itself in the right place at the right time. The prevalence of artificial intelligence has turned a once-niche fuel-cell maker into a frontline supplier for the digital age. The math is simple: data centers are multiplying and all that computing horsepower needs electricity — not tomorrow, but yesterday. The grid can’t keep up, making Bloom’s self-contained, on-site power systems look less like an alternative and more like a necessity. They don’t just sell energy; they sell independence. For a data-center operator, that’s not a luxury — it’s an insurance policy against blackouts, brownouts, and bureaucratic delays.
Yeah, you heard that right — Bloom Energy just became an A.I. company. Not the kind that builds chatbots, but the kind that keeps them alive when the grid gives out. The headline says it all: Brookfield + Bloom = Better Together. In the first phase — and you can bet there’ll be more — Brookfield is investing $5 billion to roll out Bloom’s fuel-cell boxes powering the next generation of AI data centers across the U.S., Europe, and eventually the world.
Here’s the punchline: Bloom’s not selling hype. It sells the juice, the kind that keeps the lights on while A.I. devours the world’s electricity. CEO K.R. Sridhar put it plainly: “A.I. factories demand massive power, rapid deployment, and real-time responsiveness that legacy grids can’t deliver.” The grid is too slow, too fragile, and too outdated to feed this beast. Bloom’s off-grid power units are the fix — fast, scalable, and built for a world where “always on” is the new survival strategy.
As Sridhar sees it, Bloom has become one of the biggest beneficiaries of the A.I. infrastructure boom — a transformation he calls “secular” and long-term. This isn’t a fad; it’s a structural shift in how the world powers the machines of the future. The numbers are staggering: the U.S. will need an additional 100 gigawatts of firm, reliable power by 2030, and the aging grid can’t deliver it. That’s where Bloom steps in. Its solid-oxide fuel cells provide clean, on-site electricity at industrial scale, giving A.I. data centers the one thing they can’t function without — dependable power, fast.
Bloom’s recent deal with Oracle, promising on-site power within 90 days of signing, proves it can deliver at “A.I. speed.” Sridhar insists Bloom isn’t chasing hype; it’s filling a void the grid can’t close. The company plans to double manufacturing capacity to 2 GW by 2026, doing so deliberately and only after confirming demand. With technology 75% more efficient than traditional turbines, Bloom is positioning itself not as a speculative play, but as a cornerstone of America’s next energy revolution — powering the digital age with reliability the grid can no longer guarantee.
This isn’t a pivot; it’s a transformation. Bloom isn’t just playing in the energy game anymore — it’s building the power plants for the machines that run the future.
Over the past several weeks, Bloom has delivered the kind of headlines traders crave. The $5 billion Brookfield deal reads like the offspring of Silicon Valley ambition and Wall Street muscle — an audacious plan to build the energy backbone of the A.I. revolution. Brookfield isn’t just funding it; it’s strapping in as Bloom’s co-pilot, bringing capital, infrastructure, and reach to turn a great idea into a power network for the machines that now think for us. Bloom’s fuel cells, once dismissed as futuristic curiosities, now stand at the center of this new ecosystem, offering clean, reliable, and scalable power in a world running short of both. A $5 billion bet from a heavyweight like Brookfield isn’t a headline — it’s a verdict. A.I.’s hunger for energy is real, and Bloom just positioned itself as the company feeding it.
CEO K.R. Sridhar’s team has shown the agility of a start-up and the discipline of a veteran — trimming costs, doubling capacity, and tightening deployment timelines from months to
weeks. That mix of speed and precision is rare in clean tech, a sector usually better at PowerPoint than power generation.
This isn’t a one-off rally. It’s a reflection of a broader market shift as investors seek companies building the infrastructure that makes AI possible. Bloom isn’t on the sidelines; it’s at the center of the story — the energy provider for a generation of data centers that can’t afford downtime.
Sure, skepticism remains. Some analysts warn of dot-com déjà vu — soaring valuations, euphoric sentiment, and long-term uncertainty. But for now, the momentum is unmistakable. The move in Bloom Energy isn’t just about one stock; it’s a signal that capital is flowing toward the firms powering the next wave of technological expansion. In the race to fuel A.I., Bloom has become a name investors can’t ignore.
Wall Street has noticed. Analysts are raising targets as the stock races ahead more than 300% this year. Skeptics still grumble about valuation and supply-chain risk, but they’re being drowned out by the sound of capital rushing into anything tied to A.I.. Every new partnership reinforces the same story: Bloom isn’t the dreamer it once was; it’s a serious player in the energy infrastructure race, with a product that works and customers who pay.
Volatility still rules — one rough quarter could humble even this rally — but for now, Bloom’s story is humming, literally, inside those gleaming Energy Servers outside data centers across America. The company has turned reliability into growth and made electricity exciting again. In a world overflowing with hype, Bloom Energy might just be one of the few companies delivering on it.
Bloom Energy isn’t just forecasting growth for 2025 — it’s practically daring Wall Street to keep up. The company’s projecting revenue between $1.65 billion and $1.85 billion, a sharp climb from last year’s totals and a signal that it’s no longer playing in the minor leagues. They’re calling for a non-GAAP gross margin near 29%, and operating income between $135 million and $165 million — numbers that might not sound sexy until you realize how far this company’s come from its days of red ink and “potential.”
What makes this interesting isn’t just the math; it’s the message. Bloom is telling investors that profitability isn’t a someday story anymore — it’s part of the plan. They’re scaling up production, locking in high-profile A.I. partnerships, and trimming costs like a startup that finally found its product-market fit. In a world obsessed with flashy tech and vaporware valuations, Bloom’s doing the unglamorous work of building actual infrastructure, the stuff that keeps the lights on while everyone else talks about “the future.”
And that’s the real story. The future everyone’s chasing — the A.I. factories, the smart cities, the endless cloud — all need one thing: power. Bloom’s betting big that it’ll be the company delivering it. If they hit these targets, 2025 won’t just be another year of progress — it’ll be the year Bloom proves that real growth stories still exist in a market addicted to hype.
In this stock study, we’ll analyze the key indicators and metrics that guide our decisions on whether to buy, sell, or stand aside on a particular stock. These inputs serve as both our framework and behavioral compass, rooted in data and powered by predictive intelligence.
· Wall Street Analysts Ratings and Forecasts
· 52 Week High and Low Boundaries
· Best-Case / Worst-Case Scenario Analysis
· VantagePoint A.I. Predictive Blue Line
· Neural Network Forecast (Machine Learning)
· VantagePoint A.I. Daily Range Forecast
· Intermarket Analysis
· Our Suggestion
While our decisions are ultimately anchored in artificial intelligence forecasts, we briefly review the company’s fundamentals to better understand the financial environment it operates in. For $BE this context helps us assess the quality of the A.I. signal within a broader economic and industry backdrop.
Wall Street Analysts Forecast
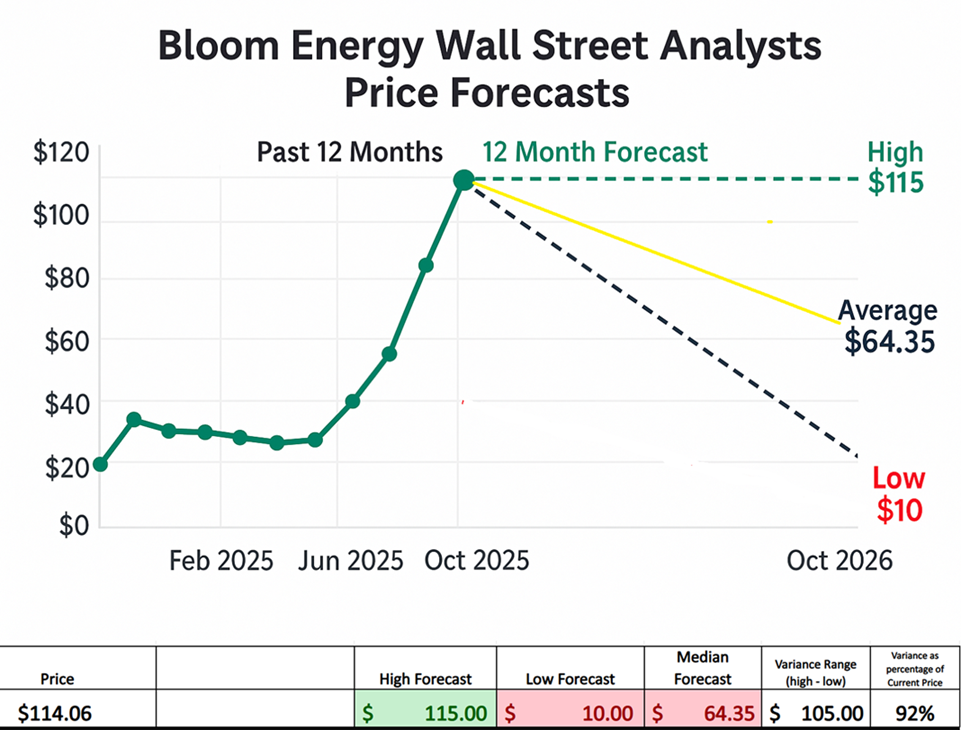
Look at that chart. Eighteen analysts, each paid to see the future, and they can’t even agree on which direction the rocket’s pointing. The average target for Bloom Energy sits at $64.35, a number that looks calm and sensible until you peek under the hood. The bulls are screaming $115, while the bears are whispering $10, and that $105 gap between them isn’t a typo — it’s a confession. It says loud and clear: volatility is the name of the game.
When analysts are this far apart, it’s not about disagreement, it’s about uncertainty wrapped in opportunity. The bullish camp sees Bloom as a front-row ticket to the A.I.-energy revolution, powering the next generation of data centers like a Silicon Valley utility on steroids. The pessimists? They think the hype’s overcooked, the execution too risky, the margins too thin. Both sides could be right, but only one will get paid.
And that’s the beauty of this setup. The variance tells you everything about where we are in the story. Bloom Energy isn’t some sleepy utility stock—it’s a battleground. The kind of stock where conviction pays and hesitation costs. The analysts might not agree, but one thing’s certain: nobody’s betting on boredom.
52 Week High and Low Boundaries
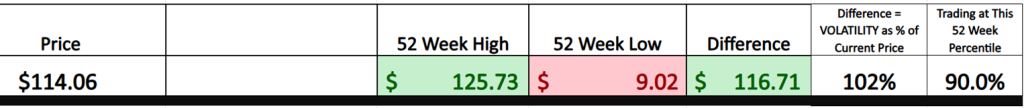
There’s a moment in every bull run when the numbers stop whispering and start shouting — and right now, Bloom Energy ($BE) is doing just that. The stock is trading near $114, brushing up against its 52-week high of $125.73, more than ten times its low of $9.02. That’s not just volatility — that’s a story written in green candles and disbelief. The spread between those two numbers, over 100% of the current price, tells you everything you need to know about how quickly sentiment has shifted. This isn’t quiet accumulation. This is a market repricing a company that’s gone from the sidelines of clean energy to the front row of the A.I. infrastructure boom.
One of the most powerful setups in trading is finding stocks making new 52-week and 10-year highs at the same time. That’s where strength stops being coincidence and starts becoming confirmation. Look closer at Bloom’s long-term chart, and you’ll see exactly that dynamic unfolding. For four months straight, the stock hasn’t just been rising; it’s been breaking out, climbing step by step into price territory it hasn’t seen in a decade. Those moves don’t happen in isolation — they happen when Wall Street wakes up to a new narrative, one that suddenly feels urgent.
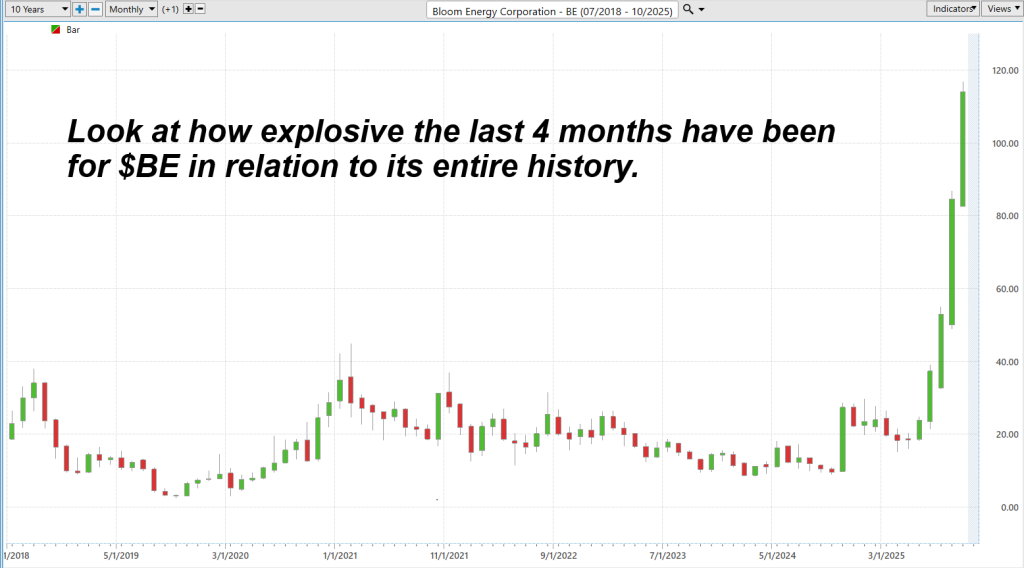
And make no mistake, Wall Street’s paying attention. The A.I. energy story has cracked open a new frontier, and Bloom’s fuel-cell technology is now being talked about in the same breath as data centers, power reliability, and the future of digital infrastructure. When a company becomes essential to the backbone of A.I. itself, price charts like this stop being accidents — they become signals. Bloom’s breakout isn’t hype; it’s the market’s way of saying this stock just earned a permanent spot on the radar.
Best-Case/Worst-Case Scenario Analysis
If you really want to understand volatility, don’t start with theories or formulas — start with the chart. Markets speak in movement, not in models. The cleanest, most practical way to grasp volatility is to measure it directly from price action: the size of the biggest rallies and the depth of the sharpest declines over the last 52 weeks. This is reality, painted in green and red. When you quantify how much a stock can move in both directions, you stop guessing about risk and start respecting it. It’s a discipline that forces traders to see what volatility looks like — not as fear, but as information.
We start with the best-case analysis first:
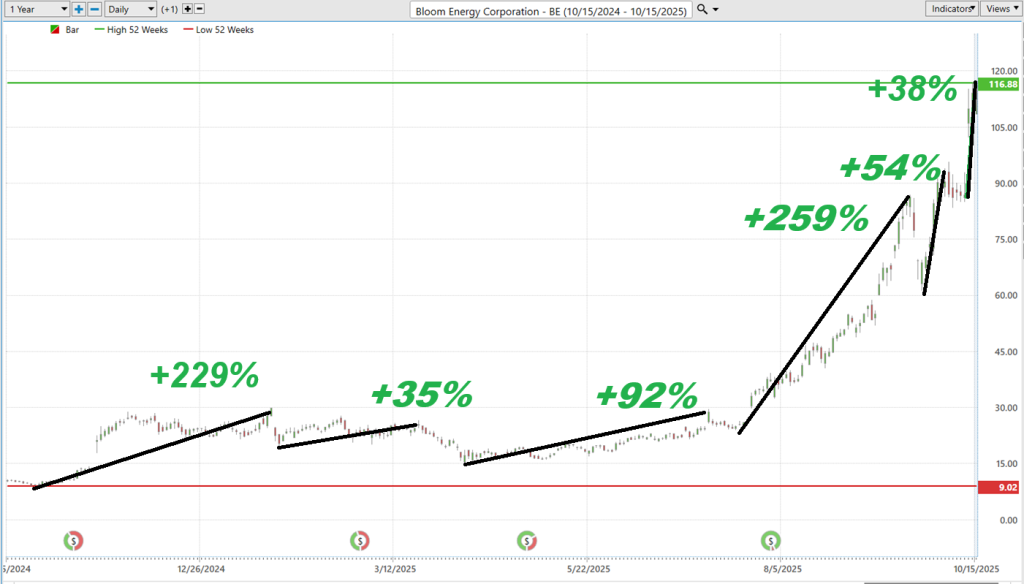
Now, take a look at Bloom Energy ($BE). The first chart tells a story of explosive rallies — gains of +229%, +35%, +92%, +259%, +54%, and +38% — each surge marking a new wave of momentum, each one bigger than the last. It’s the portrait of a stock under accumulation,
where optimism compounds and trends feed on conviction. These are not incremental moves; they are breakouts, the kind that redefine what’s possible when a company captures Wall Street’s imagination.
But the second chart — the red side of the ledger — is the necessary counterpart. Pullbacks of -33%, -25%, -39%, -14%, -28.7%, and -11.5% remind us that even the strongest trends breathe in volatility. For traders, these declines aren’t just setbacks; they’re the calibration points of risk. They reveal the emotional amplitude of the market — how far investors stretch between greed and fear. Together, these two charts form the full anatomy of a high-performance stock: bursts of upside momentum punctuated by sharp, often uncomfortable corrections.
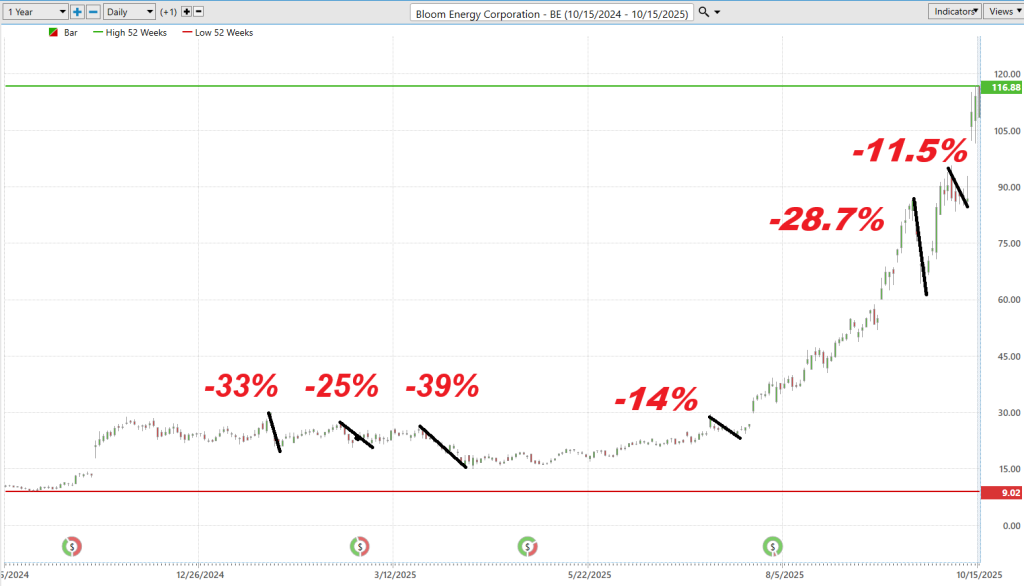
In Bloom’s case, that rhythm has defined the last year — relentless rallies followed by manageable resets. It’s a visual lesson in how volatility becomes the cost of admission to growth. Understanding that balance — the magnitude of reward against the magnitude of risk — is what separates professionals from participants. Traders who study both sides of the chart aren’t just watching price; they’re learning how to dance with it.
Next, we compare $BE to the broader stock market averages to better understand volatility with assets which most traders are immediately familiar with.
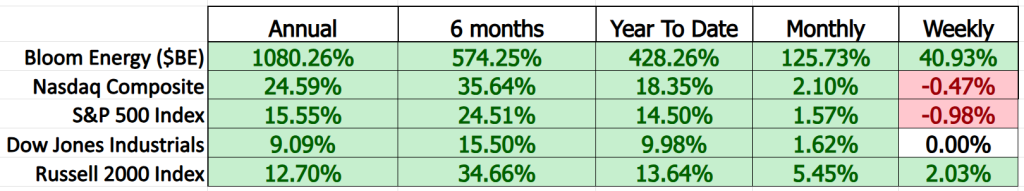
No matter how you slice the data, Bloom Energy ($BE) is leaving the broader market in the dust. The numbers are staggering — up 1,080% over the past year, 574% in the last six months, and 428% year-to-date — performance that makes the Nasdaq’s 24.6% look quaint by comparison. Even on a shorter horizon, Bloom is in a league of its own, rising 125.7% this month and 40.9% just this week, while the S&P 500 and Nasdaq actually slipped into negative territory. It’s rare to see a stock dominate this decisively across every timeframe — weekly, monthly, and annually — but Bloom’s ascent is a clear reflection of how the market is rewarding companies at the center of the A.I. energy revolution. While indexes grind along, Bloom is rewriting what outperformance looks like in real time.
Vantagepoint A.I. Predictive Blue Line
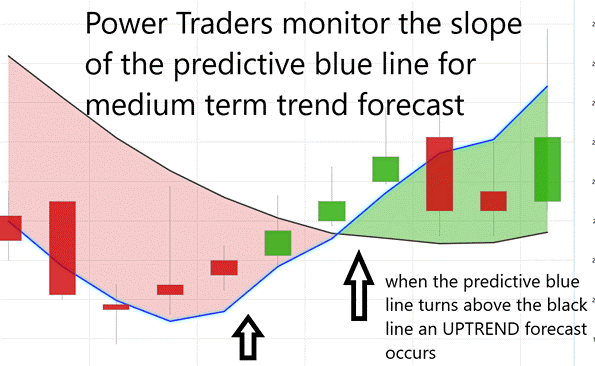
The VantagePoint A.I. Predictive Blue Line is one of the most powerful yet elegantly simple tools in a trader’s arsenal. It’s not guessing — it’s forecasting. Built on neural network analysis of intermarket data, it anticipates where price is most likely to move next. When that blue line crosses above the black line, it signals that momentum is shifting upward — that buyers are taking control. When it dips below, it warns that the trend is turning bearish. But it’s not just about direction; it’s about timing. The slope of the line tells you the strength of that trend — the steeper the angle, the more powerful the move. It’s like seeing tomorrow’s weather before anyone else opens the blinds.
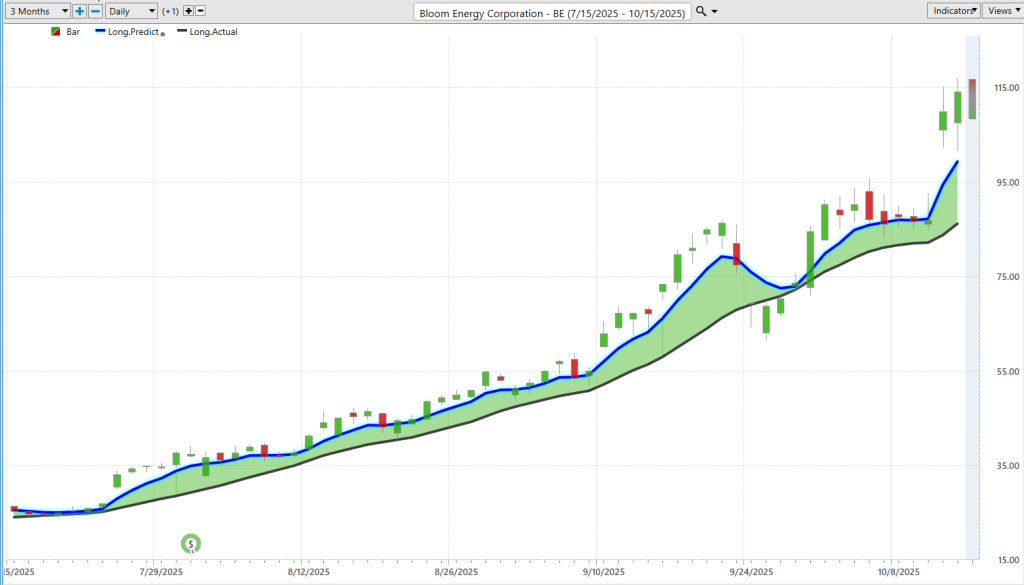
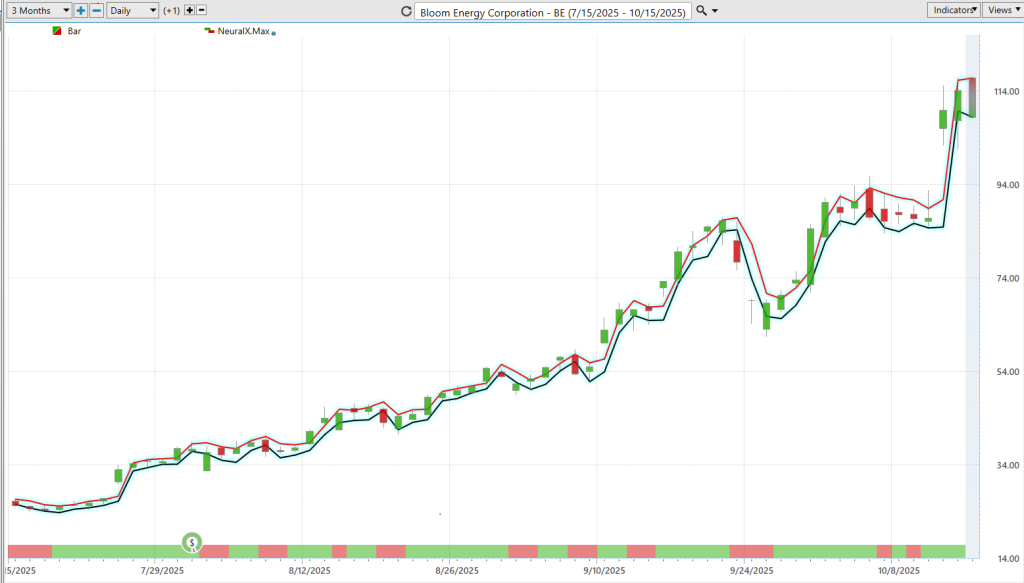
Now, look closely at this chart of Bloom Energy ($BE). The Predictive Blue Line has been climbing steadily since mid-July, hugging the price action like a trusted co-pilot — guiding traders through every surge, pullback, and breakout. Notice how each time the blue line turned upward, price followed with conviction. This isn’t luck; it’s probability in action. Traders who aligned with that predictive signal caught a series of sustained moves that multiplied their capital while others were still reacting to yesterday’s headlines.
In a market where emotion ruins more accounts than bad stocks, this chart is a quiet revolution. It proves that discipline and data beat hunches and hope every single time. The Predictive Blue Line doesn’t just show where the trend is — it helps traders anticipate where it’s going. And in the case of $BE, it’s been right again and again, carving a roadmap through volatility and lighting the path for those wise enough to follow.
Neural Network Forecast (Machine Learning)
In the world of modern finance, where algorithms often move faster than human thought, the neural network has become the quiet backbone of quantitative trading. At its core, a neural network is modeled after the human brain — not in biology, but in function. It’s a system of interconnected “neurons” organized in layers, each processing inputs, recognizing relationships, and sending refined information forward. In trading, those inputs might include historical prices, volume, volatility, interest rates, commodity correlations, or even currency flows. The network trains itself on these data sets, adjusting its internal “weights” — the equivalent of learning from experience — until it can detect patterns that consistently precede certain market outcomes. Over time, it becomes an adaptive engine: one that doesn’t just analyze what has happened, but anticipates what is likely to happen next.
For traders, this kind of artificial intelligence isn’t about replacing intuition — it’s about sharpening it. The markets generate oceans of data every second, far too vast for even the sharpest mind to absorb. Neural networks take that chaos and turn it into clarity, filtering millions of data points into actionable probabilities. They pick up on relationships hidden beneath the surface — subtle correlations between asset classes, recurring momentum shifts, or changes in market sentiment that few humans would ever detect. What the trader
gets is not noise, but signals, a distilled reflection of market behavior that enhances decision-making with statistical precision rather than emotional reaction.
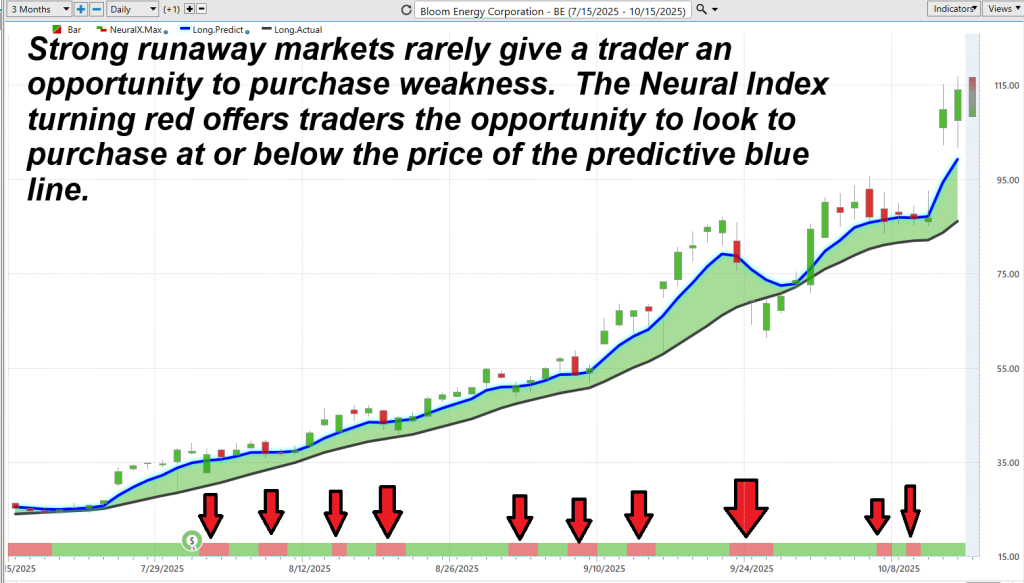
Within this framework sits the Neural Index, one of the more practical tools for short-term forecasting. It’s a simple, visual cue — when it turns green, the system is projecting higher prices over the next 48 to 72 hours; when it turns red, it signals potential weakness ahead. Behind that simplicity, however, lies a vast computational process — hundreds of intermarket relationships being modeled and re-weighted in real time. Traders use it as a compass, aligning their positions with the prevailing probabilities. In a marketplace defined by speed, volatility, and noise, the Neural Index doesn’t just help traders keep up — it helps them stay ahead, making decisions grounded in data that most others never even think to compute.
VantagePoint A.I. Daily Range Forecast
What you’re looking at here isn’t just another price chart — it’s a visual snapshot of predictive precision in motion. The Bloom Energy ($BE) chart shows how the VantagePoint A.I. Daily Range Forecast turns volatility into structure. Each day, the system calculates the most probable high and low boundaries for the next trading session — a kind of digital weather report for price action. The shaded zones and the shifting red and green signals don’t just react to what’s already happened; they anticipate what’s likely to unfold over the next 24 hours.
In practice, this means traders can plan their entries and exits with a degree of foresight that traditional tools simply can’t match. Notice how $BE has respected those forecasted boundaries again and again — rallying toward the upper range when momentum built, retreating toward the lower when short-term pressure appeared. This consistency isn’t coincidence. It’s the output of neural networks analyzing thousands of intermarket relationships — energy prices, currency movements, even interest rate trends — and distilling them into actionable daily probabilities.
For a stock like Bloom Energy, which has surged amid the A.I. infrastructure boom, that level of predictive guidance is invaluable. In a market where speed and timing separate the professionals from the hopefuls, the A.I. range forecast gives traders a critical edge. It’s not just about knowing the direction of the trend — it’s about understanding the boundaries of opportunity. And lately, Bloom Energy has been pushing those boundaries to new heights.
Intermarket Analysis
Markets rarely move in isolation — and Bloom Energy ($BE) is a perfect example of how intermarket forces shape a company’s trajectory. What once began as a niche player in the alternative energy sector has evolved into a major participant in the global energy transformation, driven not just by innovation, but by the broader macroeconomic environment surrounding it. When energy prices surge, when the dollar fluctuates, when capital rotates toward technology or clean energy funds — all these shifts ripple through to Bloom Energy’s valuation and investor sentiment.
At the top level, macroeconomic drivers such as energy security, infrastructure spending, and A.I.-driven data center expansion are fueling a renaissance in power efficiency. The world’s power grid wasn’t designed for today’s data-hungry reality — every new server farm, EV charging network, and AI compute cluster adds strain to an already overextended infrastructure. Bloom Energy’s solid oxide fuel cell technology has quietly transitioned from
a green curiosity to a practical grid solution. It offers scalable, cleaner on-site generation — exactly what a world chasing both sustainability and reliability demands. This pivot has repositioned Bloom not as an “alternative” energy company, but as an infrastructure enabler for the digital economy.
Now, the attached intermarket analysis graphic paints a broader picture of how Bloom Energy sits at the intersection of multiple financial ecosystems. Connected to ETFs like ARK Innovation, Invesco Solar, and First Trust Clean Edge Green Energy, it rides the same capital flows that power the clean-tech movement. Its correlations with U.S. Dollar, Gold, Natural Gas, and even Treasury Bonds reveal how sensitive the company can be to shifts in inflation, interest rates, and commodity cycles. Notice also the ties to BYD, XPeng, and Intercontinental Exchange — seemingly distant names that hint at the global web of supply, demand, and investment sentiment influencing Bloom’s price action.
Here are the 31 key drivers of $BE price action:
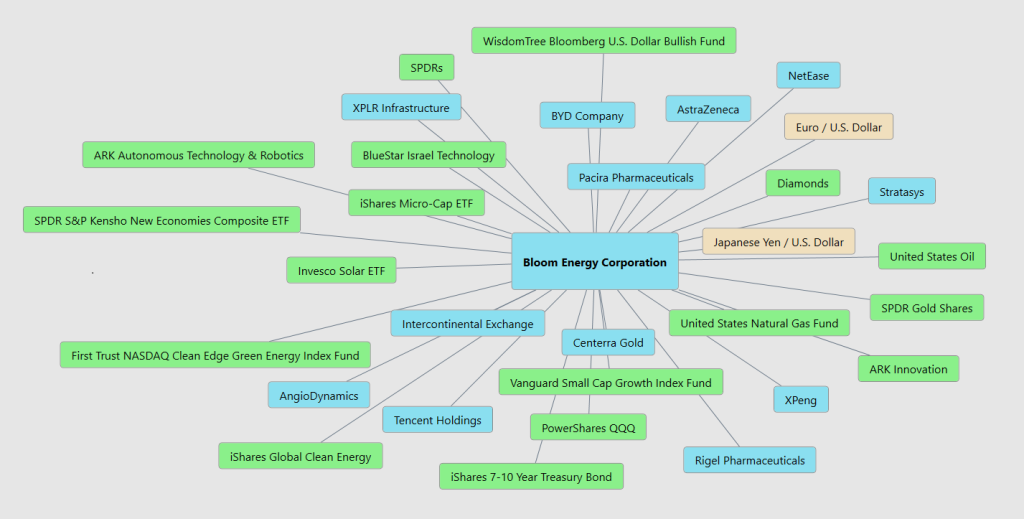
This is where intermarket analysis shines: not as prediction, but as revelation. It shows the hidden forces moving beneath the surface — the quiet tug-of-war between currency trends, commodity flows, and sector momentum. For traders and investors, these networks can reveal hidden gems — those subtle relationships that explain why a stock moves when it does. And in the case of Bloom Energy, they tell the story of a company that has broken out of its old category and found its place at the crossroads of technology, energy, and macro transformation.
Our Suggestion
Let’s cut through the polite Wall Street chatter and call it like it is: Bloom Energy’s management finally sounds like they know they’ve got the tiger by the tail.
The last two earnings calls weren’t filled with the usual corporate tap dance — no “we’re cautiously optimistic” spin. Instead, they came out swinging with numbers that shut up the skeptics. Q1? Revenue up 39% year-over-year to $326 million, and for the first time, they actually turned a profit — a clean, no-hype, positive non-GAAP EPS of $0.03. Then Q2 rolled in with $401 million in revenue, another double-digit gain, and a fat 28% gross margin. You can almost hear it in their voices — this isn’t some moonshot science project anymore. This is a business that’s scaling, tightening, and hitting stride.
The tone? Calm. Controlled. Confident. Not hype, just conviction. They’ve kept 2025 guidance steady — $1.65 to $1.85 billion in revenue, 29% gross margins, $135–$165 million operating income — because they don’t need to talk it up. They’re walking it up. And they’re doing it while every A.I. data-center headline plays right into their hands.
Bloom’s management finally sounds like they’re done trying to convince anyone. They’re past the “maybe someday” phase and deep into the “watch this” phase. They’ve got the numbers, the timing, and the story — and if you’ve been sleeping on them, you’re about to find out what it looks like when a company that’s been quietly grinding suddenly steps into the spotlight.
If you didn’t already when we first told you about it, place $BE on your watchlist. The volatility is huge here but so is the opportunity for traders who have learned how to trade with artificial intelligence.
Position sizing is paramount.
Practice great money management on all your trades.
It’s not magic.
It’s machine learning.
Disclaimer: THERE IS A HIGH DEGREE OF RISK INVOLVED IN TRADING. IT IS NOT PRUDENT OR ADVISABLE TO MAKE TRADING DECISIONS THAT ARE BEYOND YOUR FINANCIAL MEANS OR INVOLVE TRADING CAPITAL THAT YOU ARE NOT WILLING AND CAPABLE OF LOSING.
VANTAGEPOINT’S MARKETING CAMPAIGNS, OF ANY KIND, DO NOT CONSTITUTE TRADING ADVICE OR AN ENDORSEMENT OR RECOMMENDATION BY VANTAGEPOINT AI OR ANY ASSOCIATED AFFILIATES OF ANY TRADING METHODS, PROGRAMS, SYSTEMS OR ROUTINES. VANTAGEPOINT’S PERSONNEL ARE NOT LICENSED BROKERS OR ADVISORS AND DO NOT OFFER TRADING ADVICE.


