


The A.I. stock spotlight this week is Caterpillar ($CAT)
Caterpillar was born in 1925, back when men looked at mud and decided machines should win. It started as a practical solution to a dirty problem and evolved into the global symbol of heavy industry. Its mission never changed. Build machines that work when everything else fails. It survived the Great Depression, powered wars, mechanized continents, and outlived every prediction that industry was dead. Today it operates everywhere that dirt is moved for money, employing more than one hundred thousand people. It still matters because when Caterpillar is busy, the real economy is not pretending. It is spending.
Now let us strip away the marketing varnish and talk about what Caterpillar actually does. It makes big yellow machines that dig, lift, haul, crush, and power the physical world. Roads, mines, bridges, ports, pipelines, power plants. If something enormous is being built or torn apart, Caterpillar equipment is probably there, getting scratched and paid for.
The business runs through three engines. Construction Industries sells machines to contractors and governments building infrastructure. Resource Industries sells even larger machines to miners, oil sands operators, and anyone who thinks in cubic miles. Energy and Transportation sells engines and turbines that power ships, locomotives, data centers, and power grids. This third segment is quieter but critical. It prints steadier money than traders expect.
The revenue drivers are obvious once you stop overthinking it. Excavators. Bulldozers. Mining trucks. Diesel engines. These are high-ticket purchases with long replacement cycles. Customers do not impulse-buy a haul truck. They plan it, finance it, and expect it to work for decades.
The customer list reads like a roll call of people who write very large checks. Governments, miners, energy producers, and global contractors. Caterpillar is headquartered in Texas, run by Jim Umpleby, and supported by a dealer network that is arguably more valuable than the factories themselves. When a machine breaks in the middle of nowhere, speed of service decides brand loyalty.
Competition exists, but Caterpillar owns the psychological high ground. Komatsu and Volvo make excellent machines. Caterpillar makes the machine buyers default to when failure is not an option. Scale, parts availability, and resale value are its moat.
This is not a tech company. There is no hype loop. There is steel, fuel, and consequences.
Financially, Caterpillar behaves exactly like a well-run cyclical industrial, which is why traders often misunderstand it. Revenue has climbed thanks to infrastructure spending, mining investment, and pricing power. Margins improved not through wizardry, but by charging more, managing costs, and growing parts and services. When you sell the razor blades after selling the razor, life gets better.
The revenue and earnings table is included below:
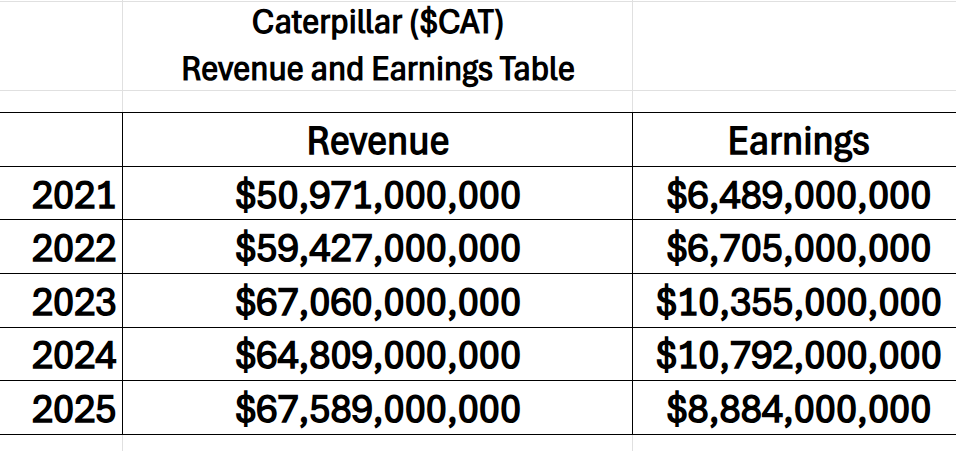
Cash flow is strong in good times and carefully managed in slower ones. Debt exists because factories and machines cost money, but it is structured, serviceable, and backed by real assets. Capital intensity is high, but it always has been. That is the price of playing in the real economy.
What traders miss is expecting Caterpillar to look conservative at the top of a cycle. That is not how cyclicals work. The real test is survival when demand cools. History says Caterpillar passes that test more often than not.
Right now, traders are asking five simple questions. Is infrastructure spending real or political theater? The order book suggests it is real enough. Is mining demand peaking or accelerating? Copper and iron say digging continues. How exposed is Caterpillar to China? Less than it used to be and less than headlines imply. Will higher rates choke financing? They slow decisions, not necessities. Is the stock too expensive for a cyclical? Only if the cycle ends tomorrow.
Recent news has been refreshingly boring. Earnings confirmed strong demand, solid pricing, and disciplined execution. Management talked about backlog, margins, and services growth. The real news was not demand. It was durability. What is priced in is strength in North America and mining. What Wall Street may be missing is how much recurring revenue now cushions the cycle. Expectations could be wrong if traders assume demand falls off a cliff. It usually slides down a hill.
The stock is up over the past year because earnings beat expectations and margins refused to collapse. Year to date strength comes from the same truth. This company can make money even when macro narratives change weekly. Infrastructure spending, commodities, and inflation protection helped the story. Pricing power and cash flow carried it.
Analysts mostly agree Caterpillar is executing well. Where they fail is assuming cycles end politely. They do not. They end fast and without apology. Anyone projecting smooth curves should be required to operate heavy machinery during a downturn.
Opportunity exists if infrastructure spending accelerates, mining investment expands, and services keep growing. Risk appears if a global slowdown delays purchases, China weakens sharply, or financing tightens suddenly. The biggest upside surprise would be services becoming a dominant profit driver. The biggest blind spot is assuming demand evaporates overnight.
Catalysts matter. Earnings confirm reality. Infrastructure funding updates signal real spending. Commodity prices guide mining demand. Interest rate shifts affect buyer confidence. Dealer inventory levels quietly reveal the truth before headlines do.
Here is the trader’s takeaway, plain and unromantic. Caterpillar is for trend followers and swing traders who respect cycles and ignore noise. The trend continues as long as demand, pricing discipline, and dealer health hold. Trouble shows up early in swelling inventories, shrinking margins, and management suddenly sounding nervous.
Caterpillar keeps rallying for one simple reason. The world is still building, still digging, and still paying for machines that work. Bet against that, and history suggests you will be the one getting buried.
In this weekly stock study, we will look at an analysis of the following indicators and metrics which are our guidelines which dictate our behavior in deciding whether to buy, sell or stand aside on a particular stock.
- Wall Street Analysts Ratings and Forecasts
- 52 Week High and Low Boundaries
- Best-Case/Worst-Case Analysis
- Vantagepoint A.I. Predictive Blue Line
- Neural Network Forecast (Machine Learning)
- VantagePoint A.I. Daily Range Forecast
- Intermarket Analysis
- VantagePoint A.I. Seasonal Analysis
- Our Suggestion
While our decisions are ultimately guided by artificial intelligence forecasts, we still take a brief look at the fundamentals to understand the financial landscape in which $CAT is operating under.
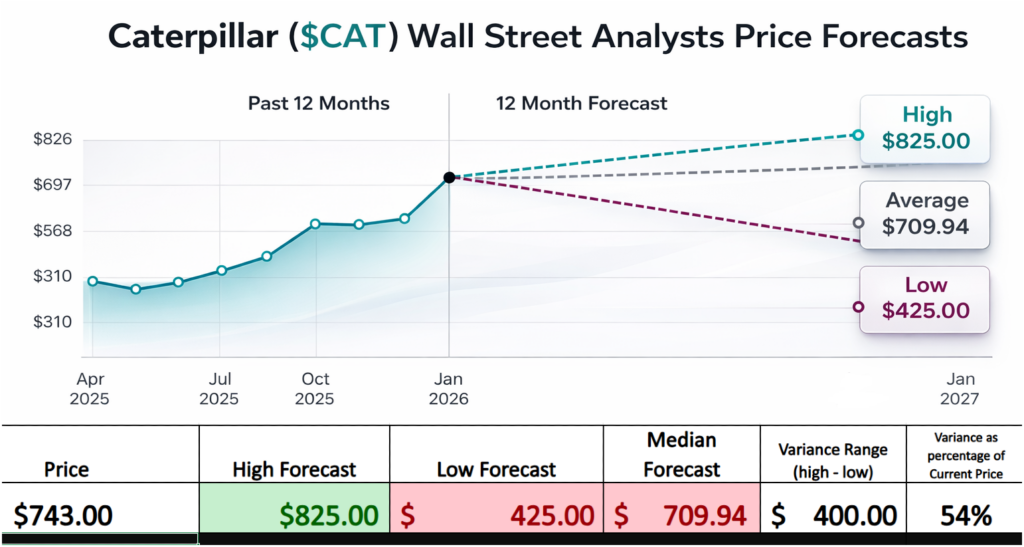
Wall Street Analysts Price Forecasts
Traders like to pretend they are monks. Calm. Disciplined. Zen-like. That is nonsense. Traders do not get paid for calm. They get paid for motion. No motion, no money. A stock that sits still is not an investment, it is furniture.
That is why this chart matters.
Caterpillar is not whispering. It is shouting. And Wall Street cannot agree on what it is saying.
On one end of the table, you have the optimists. The folks who see bulldozers roaring, infrastructure humming, and demand rolling in like wet concrete. Their view pushes the stock up toward $825. On the other end you have the pessimists. The recession-watchers, margin worriers, and cycle skeptics. They are staring down at $425. Same company. Same earnings calls. Same balance sheet. Wildly different conclusions.
That spread is the story.
When you take the most bullish forecast and put it next to the most bearish forecast, you get something traders care about far more than opinions. You get expected motion. In this case, the distance between hope and fear is $400, or roughly 54% of the current price. That is not a rounding error. That is a battlefield.
This is where opportunity lives. It is also where risk sleeps with one eye open.
High disagreement among analysts is not a warning sign. It is a spotlight. These are people who watch this stock all day, every day, with spreadsheets, models, and caffeine drips. When they cannot agree, it means the next chapter has not been written yet. And unfinished stories tend to move.
Volatility is not the enemy. Boredom is. Traders do not need certainty. They need range. They need disagreement. They need prices that can go somewhere.
The chart shows that Caterpillar has room to move, in both directions, and plenty of it. That is why we pay attention. Not because we know what will happen, but because something almost certainly will.
And in markets, motion is the admission price.
52 Week High and Low Boundaries
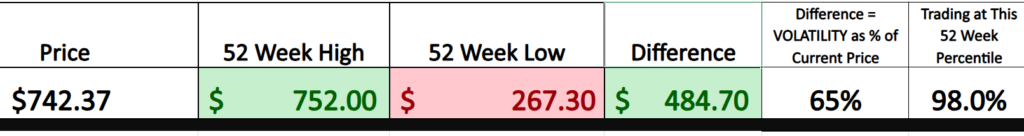
Caterpillar’s annual trading range now spans roughly 65% of its current price, a statistic that deserves more attention than it typically receives. That figure, derived from the distance between the 52-week high of $752 and the 52-week low of $267.30, is not just a historical footnote. It is a measurement of realized volatility. It tells us how far this stock has been willing to travel in the past year. When we place that beside Wall Street’s forward projections, which imply a slightly narrower but still substantial range, a clear message emerges. Both history and consensus expectation suggest that CAT is not a sleepy industrial name. It is a stock defined by movement.
The implication is straightforward but consequential. When the historic range approaches two thirds of the current price and analysts continue to model wide dispersion in outcomes, the stock becomes a vehicle for both significant opportunity and significant risk. Volatility is neither inherently good nor bad, but it is revealing. It signals disagreement, cyclical exposure, and sensitivity to macro forces. In CAT’s case, the engineers may design heavy machinery, but the equity trades like a macro instrument, reacting to infrastructure spending, commodity cycles, global growth, and investor appetite for industrial leverage.
What is striking, however, is not just the magnitude of the swings but the direction of travel. Over the past year, CAT has methodically climbed to new 52-week highs and, more broadly, new 10-year highs. On the long-term chart, each breakout has marked the stock’s ability to clear prior ceilings that once defined its limits. Markets are not sentimental. When a stock repeatedly makes new highs, it is effectively voting to reprice the company’s prospects upward. It suggests that prior concerns, whether cyclical slowdowns or margin compression, have been absorbed and overcome.
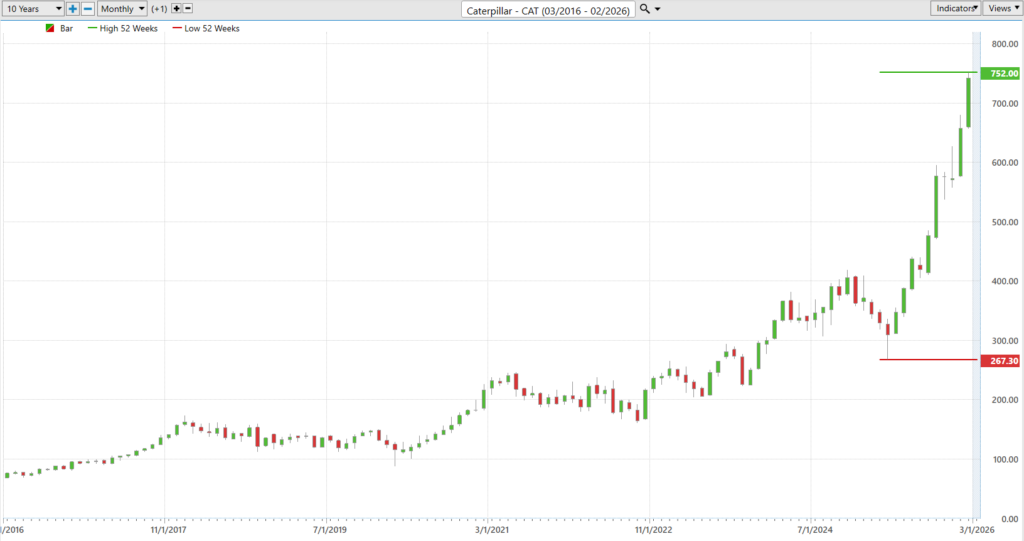
There is a subtle but powerful message embedded in that pattern. A stock printing fresh decade highs is not simply participating in the market. It is asserting leadership. It is telling investors that capital is willing to pay increasingly higher prices for the same enterprise because the future looks stronger than the past. Yet the very volatility that enabled those advances remains present. For traders and long term investors alike, CAT represents a paradox that defines many cyclical leaders: the same force that creates outsized upside also carries the potential for sharp reversals. In that tension between momentum and risk lies the real story of Caterpillar today.
Best-Case/Worst-Case Scenario Analysis
Volatility is one of those Wall Street words that sounds like it requires a PhD, a chalkboard, and a Greek alphabet. The textbooks will happily bury you in standard deviations, variance equations, and other statistical gymnastics that make you nostalgic for high school algebra. But volatility is not complicated. It is not mystical. It is simply how far and how fast a stock is willing to move before it changes its mind. And if you want to understand it, you do not need a formula. You need a chart and a ruler.
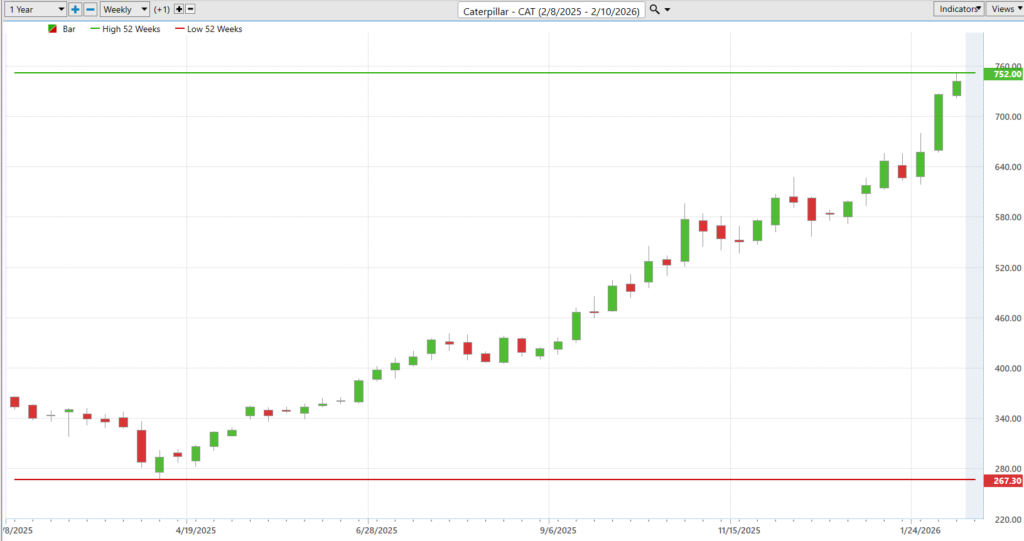
Look at the strongest uninterrupted rallies and the sharpest uninterrupted declines over the past year. That is volatility in plain English.
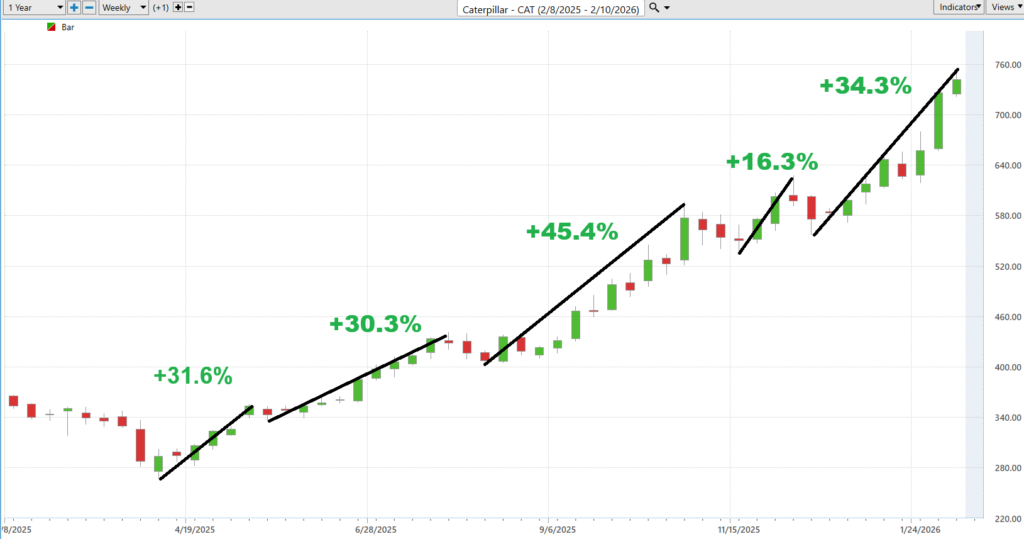
In CAT’s case, the rallies have been muscular. Thirty percent bursts. Forty five percent surges. 34% climbs that look like they were drawn with a ruler and a strong cup of coffee. But then there are the declines. Down 25%. Down 10%. Down 8%. These are not rounding errors. They are reminders. This exercise is brutally simple and wonderfully practical. Measure the biggest up moves. Measure the biggest down moves. That spread is your real world risk reward profile. No Greek letters required.
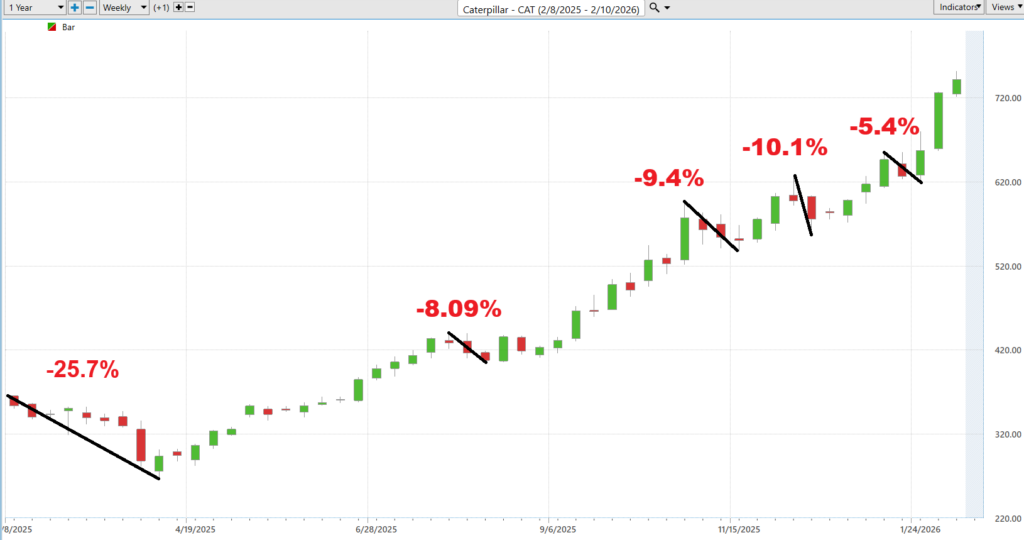
Yes, CAT has had a clear upward bias. The trend has leaned north with admirable determination. But markets have a habit of lulling us into romance. We fall in love with the slope of the line and forget the potholes along the way. An uptrend does not cancel volatility. It contains it. If you only admire the rallies and ignore the drawdowns, you are not trading. You are daydreaming. The chart tells you the truth in bold percentages bewnchmarked against the S&P 500 Index. Opportunity is large. So is risk. And the only way to respect both is to study how far this thing has already proven it can run and how hard it has already shown it can fall.
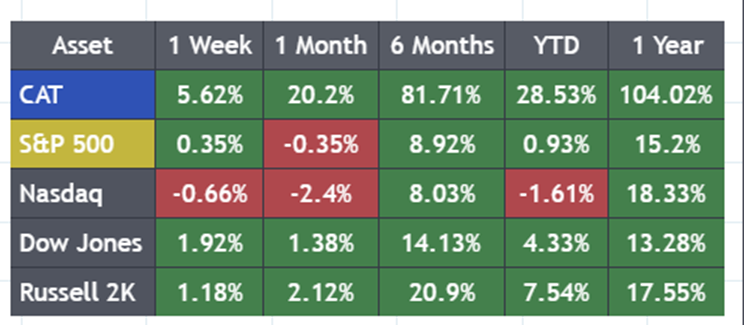
Leadership does not send you a calendar invite. It leaves footprints. But you must be sharp enough to notice them. Most traders stare at headlines. Pros stare at performance.
Because numbers do not lie. They whisper. And if you are paying attention, they are screaming.
Outperformance like this is not an accident. It is institutional money voting with size. When a stock doubles while the broad market crawls, it tells you capital is flowing there for a reason. This is what leadership looks like in cold, hard percentages. CAT is not hiding in the pack. It is dragging the pack. And when you see that kind of relative strength across multiple timeframes, you do not ignore it. You respect it. Because the market always rewards the leaders first and punishes the laggards later. The only question is whether you are disciplined enough to follow the clues.
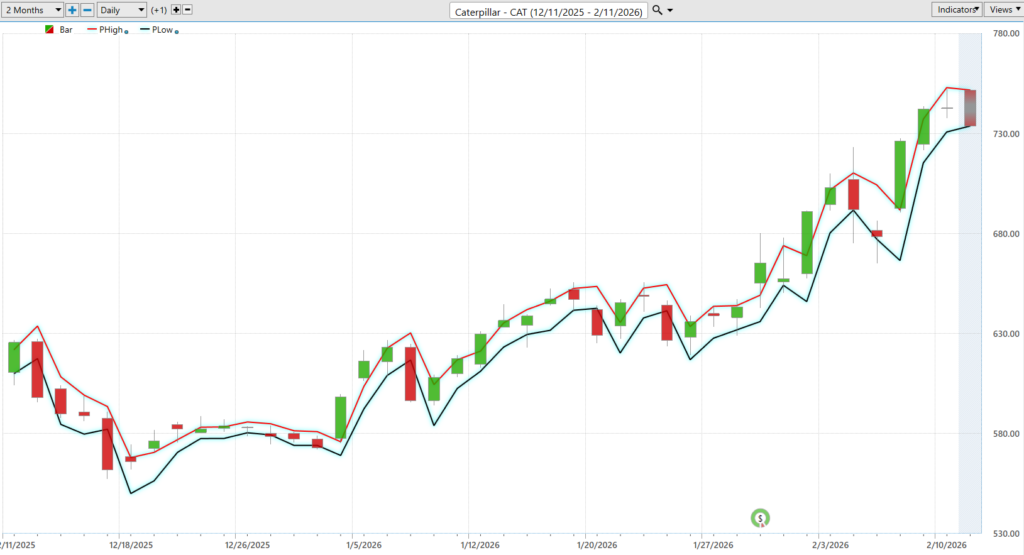
Vantagepoint A.I. Predictive Blue Line
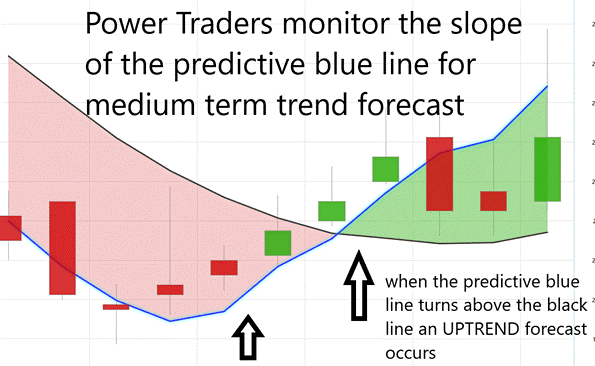
The chart presents a familiar tension between past and future, between what has happened and what may come next. The black line, a simple 10 day moving average, serves as a historical anchor. It tells us where the market has been, smoothing out the noise and distilling recent price action into a clean trajectory. It is backward looking by design, a reflection of consensus over the prior two weeks. For many traders, that line alone defines trend. But it is, at its core, descriptive rather than predictive.
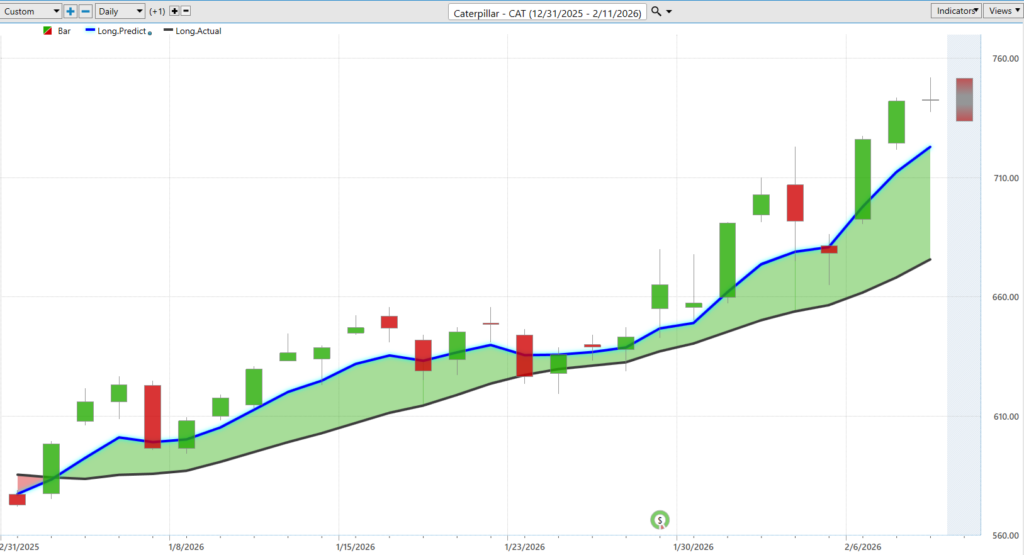
Overlaying that foundation is the blue line, the VantagePoint A.I. predictive indicator, which attempts to always look around the corner. Traders focus not just on its level but on its slope and direction, and, critically, its position relative to the black moving average. When the blue line turns higher and holds above the black, it signals that projected strength is exceeding recent reality. The widening spread between the two lines often corresponds with increasing momentum. In this case, the steady upward slope of the blue line and its consistent positioning above the 10-day average point to both direction and magnitude, suggesting not just an uptrend, but an accelerating one.
Since the most recent Up forecast on January 2, 2026, the results have been difficult to ignore. The stock has rallied more than 25%, a move that underscores how quickly momentum can compound when trend signals align. The blue line turned higher early, maintained its advantage over the black average, and the price followed. For traders, the message is not about any single candle or daily fluctuation. It is about the structure of the move. When predictive momentum leads and the market confirms, the outcome can be powerful.
VantagePoint A.I. Neural Index (Machine Learning)
Let’s slow this down and make it simple.
At the bottom of this chart is the Neural Index. That little red and green strip is not decoration. It is a short-term forecast engine. When it flips green, it is forecasting strength over the next 48 to 72 hours. When it turns red, it is forecasting short term weakness. Not six months. Not a year. The next two to three trading days. That is its job.
Now what is a neural network?
A neural network is a type of artificial intelligence modeled after how the human brain works. It processes massive amounts of intermarket data, looks for patterns that humans cannot easily see, and produces a directional bias. It does not guess. It calculates probabilities based on relationships between markets, sectors, currencies, rates, and commodities. Traders use it because markets are not isolated ecosystems. They are interconnected systems. The neural network sees those connections in real time.
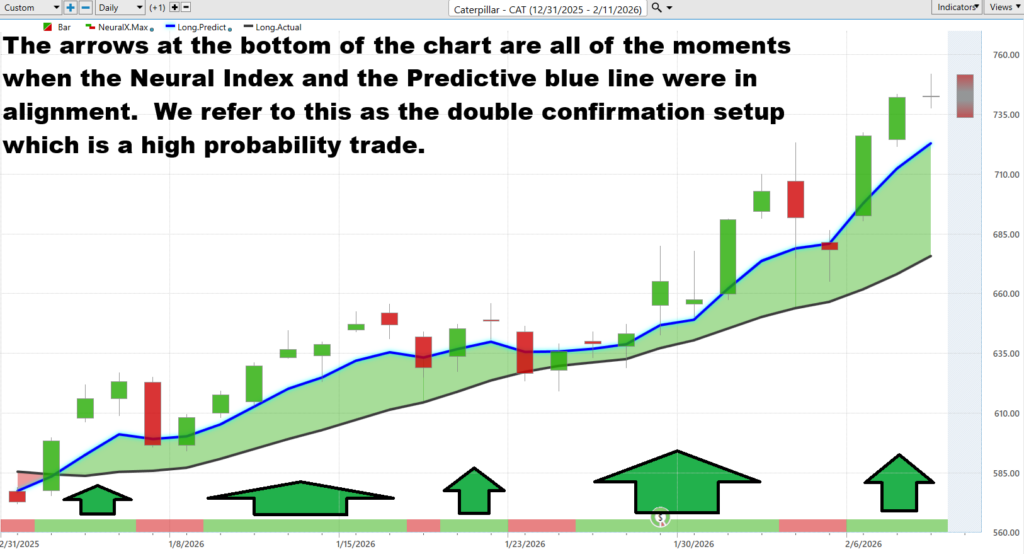
In this chart, when the Neural Index flips green and aligns with the predictive blue line, that is what we call double confirmation. The blue line is forecasting the broader trend direction. The Neural Index is forecasting short-term momentum. When both are green, you have trend and short-term momentum moving in the same direction. That is when probability increases. That is when the market often accelerates.
Notice what happens when the Neural Index turns red. You get short pauses. Pullbacks. Brief weakness. It does not necessarily mean the entire trend is over. It means short-term pressure is expected. Think of it as weather inside the climate. The climate may be bullish. But a red Neural Index tells you to expect a storm over the next couple of days.
This is how professionals manage risk.
When the Neural Index is green and aligned with the upward sloping predictive blue line, it is signaling that all systems are go on the upside. Trend confirmed. Momentum confirmed. Probability increased.
Simple. Practical. Powerful.
VantagePoint A.I. Daily Range Forecast
Volatility is not a character flaw. It is a job description. And if you are trading $CAT, you are not signing up for a meditation retreat. You are strapping into heavy machinery with a turbocharger. The first chart, with its red projected highs and teal projected lows wrapping around price, is not decoration. It is a daily map of where opportunity and risk are likely to reside before the opening bell even rings. The purpose of the Daily Range forecast is to isolate where opportunity and risk reside each and every trading day, and to this commitment it delivers in spades.
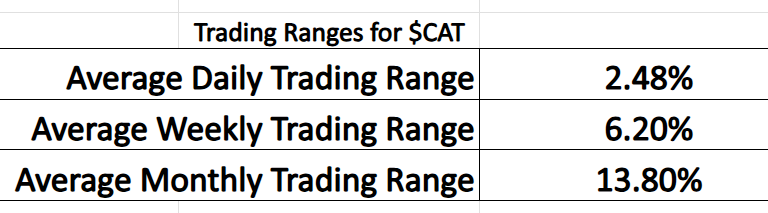
Look at the math. The average daily trading range is 2.48%. Weekly it expands to 6.20%. Monthly it stretches to 13.80%. That is not idle drift. That is motion with intent. When you know the probable high and low for the session, you stop reacting emotionally and start operating tactically. You understand where price is extended, where it is compressed, and where it is likely to surprise you. In other words, you stop guessing and start measuring.
The Daily Range forecast does not eliminate risk. Nothing does. But it frames it. It tells you where the battlefield is before you march into it. And in a stock that can swing this far this often, that is not a luxury. That is survival.
Intermarket Analysis
Let me put this in plain English.
$CAT is a company that makes the giant yellow beasts that chew up mountains and spit out highways. Bulldozers. Excavators. Mining trucks the size of apartment buildings. This is not a cute little tech startup. This is heavy metal. And the stock price does not move just because management had a good meeting.
It moves because the world moves.
That’s what intermarket analysis really means. It’s not academic mumbo jumbo. It’s understanding that CAT doesn’t live in a vacuum. It lives in a jungle. Commodities, currencies, bonds, and the overall market are all swinging vines. And if you don’t know which vine just snapped, you’re the one falling.
First, commodities. This is the big one. CAT sells machines to companies that dig stuff out of the ground. Oil. Copper. Gold. If those prices are high, mining companies get greedy in a good way. They buy more machines. They expand. They spend. CAT stock rises because its customers are printing money. But if oil collapses or copper tanks, guess what happens? The mining CEOs suddenly discover “discipline.” Orders slow down. CAT stock feels it. Right now, strong demand for metals and energy infrastructure is pouring gasoline on CAT’s fire. That’s not luck. That’s math.
Next, currencies. CAT sells all over the globe. If the U.S. dollar gets too strong, it’s like putting a luxury tax on CAT’s machines overseas. Buyers in Europe or Asia suddenly pay more in their local money. Sales can slow. Stock dips. If the dollar weakens, it’s like putting the machines on sale. Foreign buyers step up. Revenue improves. The stock responds. This is not complicated. Strong dollar can be a headwind. Weak dollar can be a tailwind. Period.
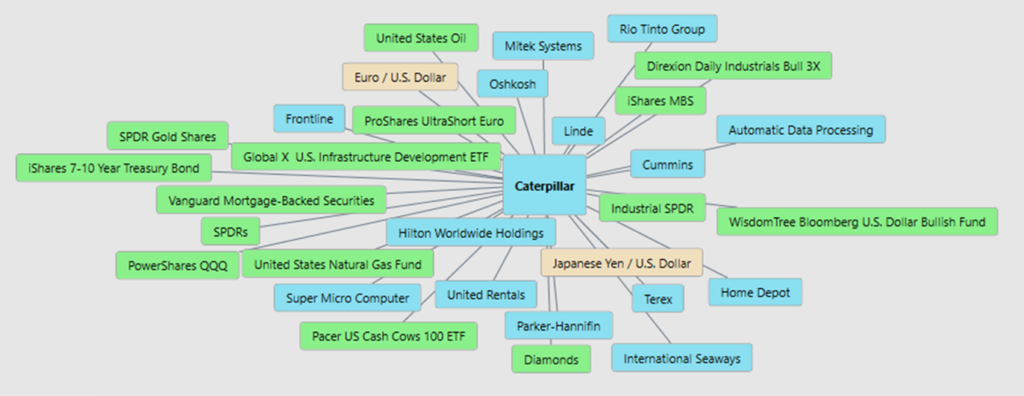
hen you’ve got bonds and interest rates. When rates go up, borrowing money gets expensive. Big construction projects slow down. Infrastructure plans get postponed. Mining expansion gets reconsidered. CAT’s customers rely on cheap capital to build big things. High rates choke that off. Low rates? It’s open season. Bridges, roads, data centers, energy plants. More projects mean more machines. More machines mean higher revenue. The stock follows the money.
And finally, the broader market. CAT is an industrial leader. When the global economy is humming, industrial stocks tend to lead. When recession fears spike, cyclicals get punished. If infrastructure spending rises or global growth accelerates, CAT thrives. If tariffs, trade wars, or economic slowdowns hit, demand softens. The stock reacts accordingly. It’s tied to the mood of the economy because it builds the bones of the economy.
So, here’s the bottom line.
CAT is not just a stock. It’s a reflection of global growth, commodity demand, currency strength, and capital costs. You don’t analyze it by staring at earnings alone. You analyze it by watching oil prices, copper trends, the dollar, and interest rates.
The stock is the scoreboard.
The world is the game.
Our Suggestion
Caterpillar is doing what strong companies are supposed to do. Over the last two earnings reports, they made more money than Wall Street expected. Sales were strong. Profits were strong. Their backlog, which is basically a long waiting list of future orders, is huge. That means customers are still lining up to buy their machines. When a company keeps beating expectations and building up orders, it usually means management is hitting its goals.
On the earnings calls, management sounded confident. Not wild. Not reckless. Just steady. They talked about strong demand, especially for power generation equipment used in data centers and infrastructure. They did not sound surprised by the economy or by how well the stock has done. In fact, they spoke as if this performance was the result of planning and execution, not luck.
But they are not pretending everything is perfect. The big risks they keep mentioning are higher costs from tariffs and pressure on profit margins. In simple terms, some of their expenses are going up, and that can squeeze profits even if sales stay strong. So, here is the bottom line: Caterpillar is performing well, management sounds in control, but like any company tied to the global economy, it still faces real risks. That is why the stock offers opportunity and risk at the same time.
If you are serious about trading, you cannot afford to guess where the battlefield is each day.
If you are trading without a plan, you are gambling.
Use the VantagePoint A.I. Daily Range Forecast to isolate where opportunity and risk live.
That clarity is where high-probability trades are found. Use the Daily Range Forecast to identify the opportunity.
That is how professionals trade.
But opportunity means nothing without discipline. Practice strict money management on every trade. Control position size. Define risk. Protect capital. Forecast the range. That is how professionals stay in the game.
It’s not magic.
It’s machine learning.
Disclaimer: THERE IS A HIGH DEGREE OF RISK INVOLVED IN TRADING. IT IS NOT PRUDENT OR ADVISABLE TO MAKE TRADING DECISIONS THAT ARE BEYOND YOUR FINANCIAL MEANS OR INVOLVE TRADING CAPITAL THAT YOU ARE NOT WILLING AND CAPABLE OF LOSING.
VANTAGEPOINT’S MARKETING CAMPAIGNS, OF ANY KIND, DO NOT CONSTITUTE TRADING ADVICE OR AN ENDORSEMENT OR RECOMMENDATION BY VANTAGEPOINT AI OR ANY ASSOCIATED AFFILIATES OF ANY TRADING METHODS, PROGRAMS, SYSTEMS OR ROUTINES. VANTAGEPOINT’S PERSONNEL ARE NOT LICENSED BROKERS OR ADVISORS AND DO NOT OFFER TRADING ADVICE.


