Welcome to the Artificial Intelligence Outlook for Forex trading.
VIDEO TRANSCRIPT
VANTAGEPOINT AI MARKET OUTLOOK
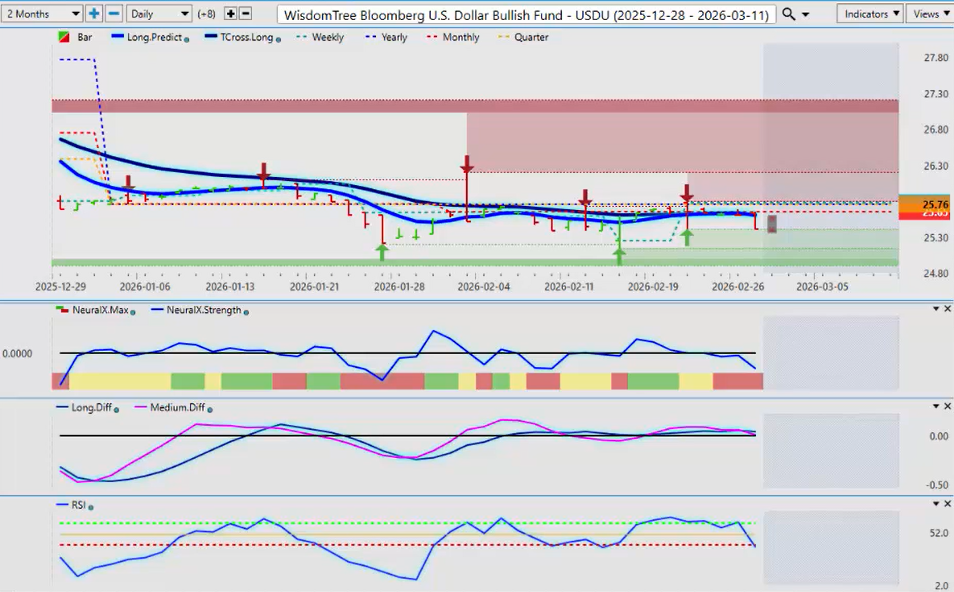
Wisdom Tree U.S. Dollar Bull Fund ($USDU / $UUP)
Okay, hello everyone. Welcome back. My name is Greg Firman, and this is the VantagePoint AI market outlook for the week of March the 2nd, 2026.
Now, to get started this week, we will look at the US dollar, the USDU bull fund. A lot going on in the world right now with the US and Israel hitting Iran, so it should be a very choppy, volatile start to the week, not necessarily favoring the US dollar even though, at this time of the month, we see the dollar rise.
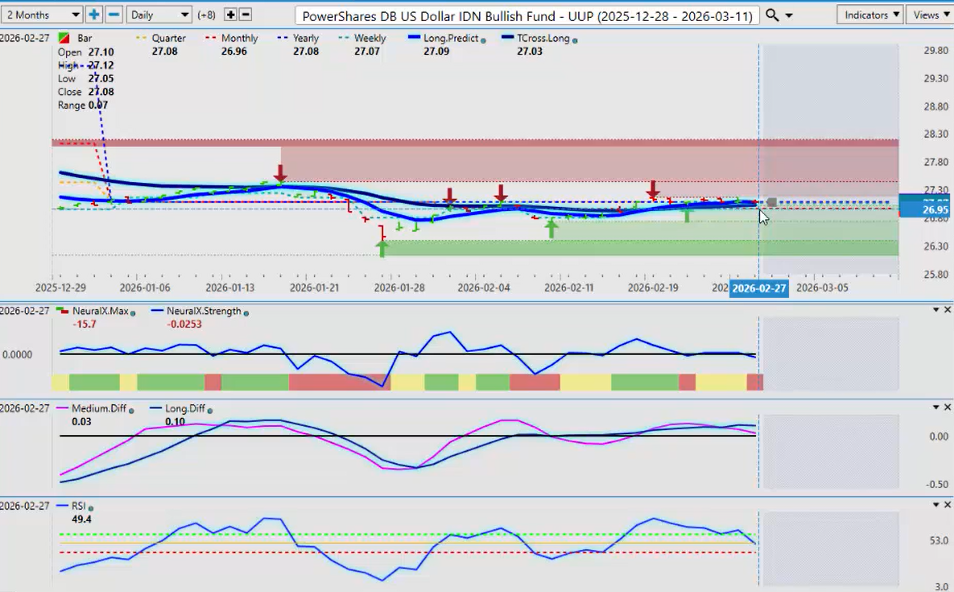
So, when we look at the core VP indicators, we remain below the calendar yearly opening price neural index, and our neural index strength is pointing down. We have an MA diff cross that is taking place, but not a medium-term crossover. But looking at the predicted RSI, momentum is building to the downside. Now, we could see this reverse violently on a risk-off scenario. The dollar, the Swiss Franc, the Japanese yen, these are your three main currencies that are likely going to rise next week. But again, the focus, until the dollar, the USDU, and the UUP can both break above the calendar yearly opening price, the medium-term to long-term bias is still down. But in the short term, we could rise slightly.
Now, this is likely going to be another hot week for gold.
Gold
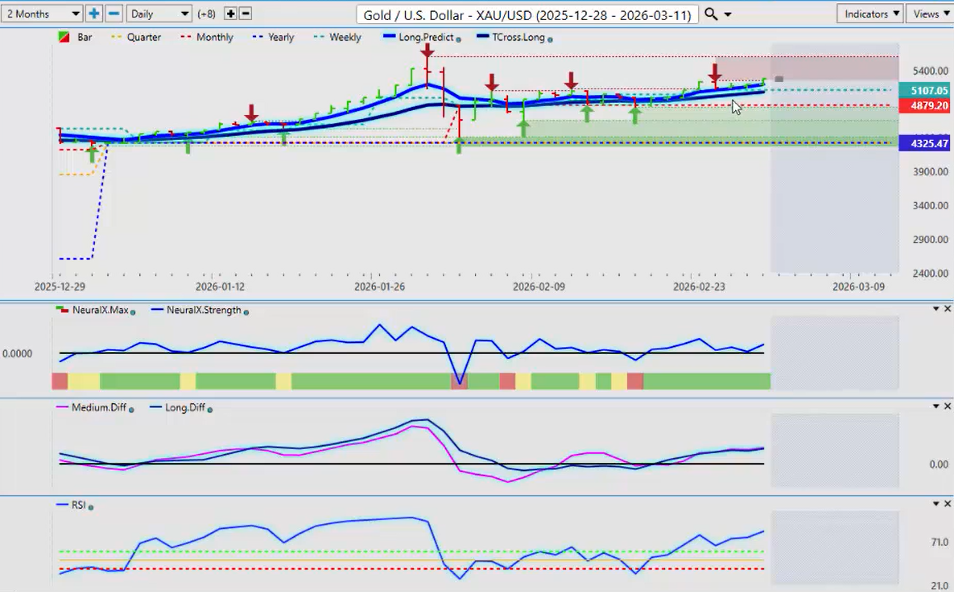
Gold, the trend is very clear, guys. It’s up. We’re above the yearly, the monthly, we’re above the T cross long, and we’re even above the long predicted. The neural index, neural index strength, everything is rising here, guys. And with the current conflict, I believe the last one between these guys was about 12 days last year sometime, but this one could go much further. So gold, silver, precious metals, all looking very good going into next week.
S&P 500 / SPY
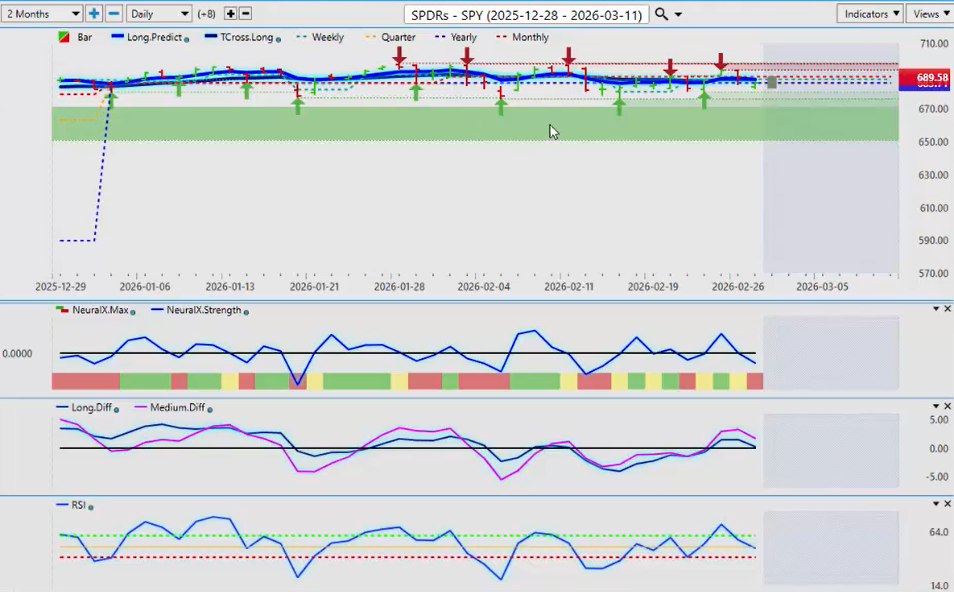
Now, where the tricky part is going to come in here is the global stock markets. What I do find interesting is they were under pretty significant pressure on Friday before all of this took place, but the S&P 500 has held its ground, holding above the yearly opening price, or the SPY, excuse me, is holding above its yearly opening price at 68,571. But that is very unlikely how it’s going to open on Monday morning because, again, this is an outlook, guys, not a recap of something that’s already happened.
Just to point this out, we’re looking forward. These indicators in VP are pointing down. As of its prediction on Friday, they were pointing down. This is likely to accelerate. In my respectful opinion, I would potentially look at end of day Monday, midday Tuesday, for potential longs, but I don’t think longs are going to gain any kind of traction under the current conflict and the VP indicators.
When we look at them, we’re holding above the yearly opening price, but the T cross long here on the SPY is coming in at 68,777, and we’ve closed below that on Friday. That is a big warning sign, regardless of the conflict in the Middle East.
Russell 2000 Index ($IWN)
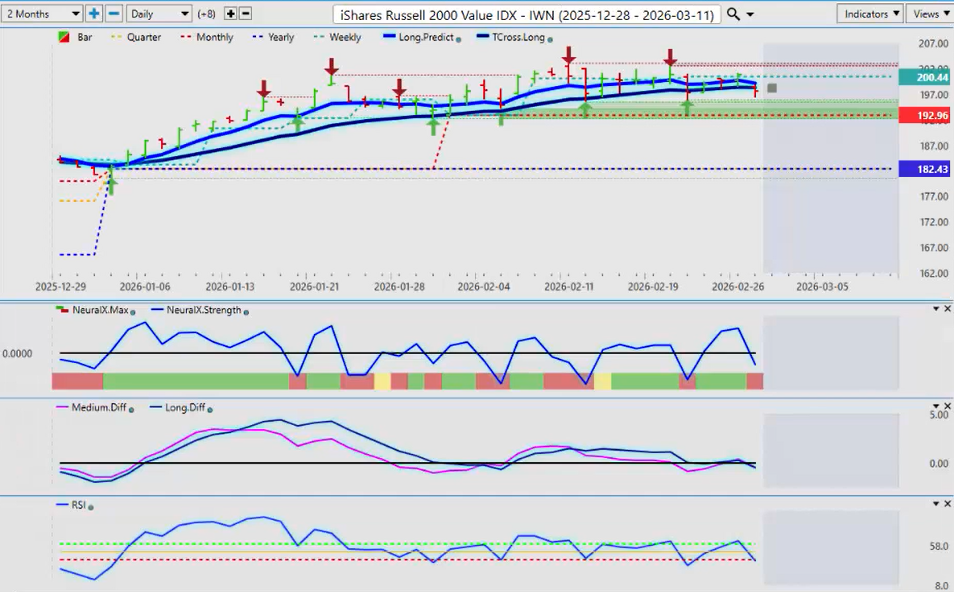
The Russell 2000, again, in my respectful opinion, only the Russell 2000 and the DAX are two of your better indices to go after on the ETF side, but they’re under pressure also. When we look at the Russell 2000, the IWN closing below the T cross long, but this trend is firmly to the upside. But again, very, very likely a major risk-off scenario is going to hit the markets on Monday.
And what that basically means is equities lower, metals higher, dollar potentially higher, but the Swiss Franc and the yen, those are the two you really want to keep an eye on, which I’ll talk about momentarily.
DAX
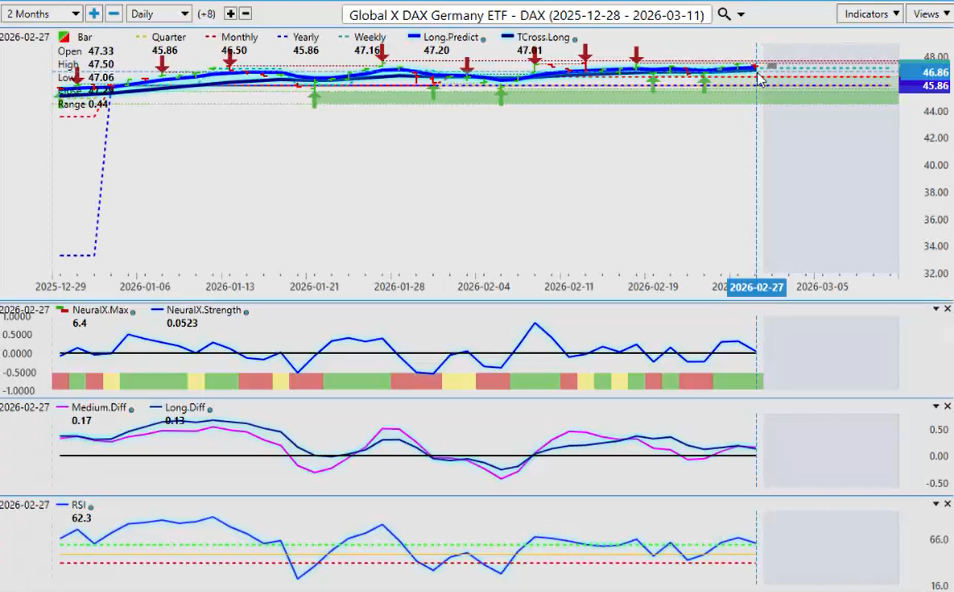
When we look at the DAX, again, the markets may look outward towards the DAX as a better place, but it still has a high correlation to the SPY. But the structure of this trend is perfect. We’re above the T cross long, the monthly opening price, and the yearly opening price. The VP indicators are still relatively bullish, but a corrective move lower should be anticipated with what we’re dealing with, and then a potential reversal on Wednesday, Thursday, that area once we see what direction things are going between the US, Iran, and, of course, Israel.
Volatility Index ($VIX)
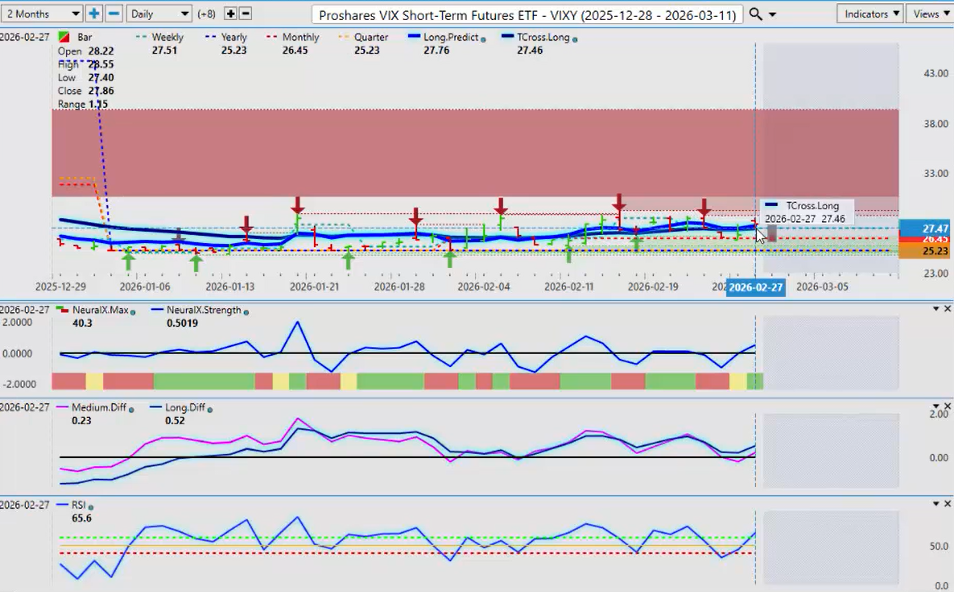
Now, when we look at the VIX, the VIX was starting to gain momentum again on Friday. So Vantage Point, to illustrate how we use these particular investment tools, this was already saying the VIX was getting ready to go higher, even though we had a down day on Friday.
On the VIX short-term futures, the core VP indicators, the T cross long, these are all actually bullish for the VIX, again before this conflict happened. I think we’re all anticipating something was going to happen, but maybe not as quick as what it did on Saturday.
So again, these VP indicators, as of Friday, were very bullish and remain bullish while we’re above the monthly, the yearly. Structurally, this is what I would look for, being above the T cross long, being above the long predictive, and then layer in our price-based tools with the point in time, with the monthly opening and the yearly opening. And this is telling me clearly that this is bullish. So I would expect the VIX to rise up for Monday and Tuesday at the very minimum.
Bitcoin ($BTC/USD)
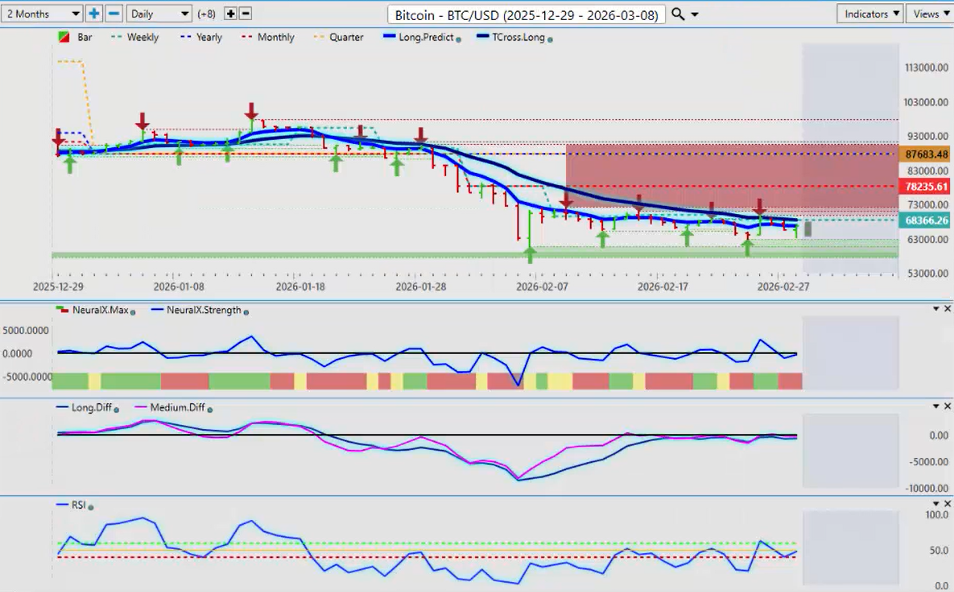
Now, when I look at Bitcoin, as I’ve said, in March you could see a rise. March could be a strong month for Bitcoin, even though we’re in a down year, which I absolutely agree. We are below the yearly, below the monthly. But historically, there has been strong buying of Bitcoin over the last five, six, seven, eight, nine, even ten years.
So again, we are below the T cross long, but the core VP indicators are actually pointing up. So what I suspect will happen is a selloff on Monday, maybe even Tuesday. But remember, March is a long month here, guys, 30 plus days, and we’re right at the beginning. So any pullback, any selloff in Bitcoin, just for the month of March, we should be watching for bullish signals in our VP software.
I actually see one trying to develop right now above the 40 level on the predicted RSI and MA cross. The neural index, while down, the neural index strength is actually up. So again, I’ll continue to update everybody on a weekly basis with this because this update, again, is for one week only.
United States Oil ($USO)
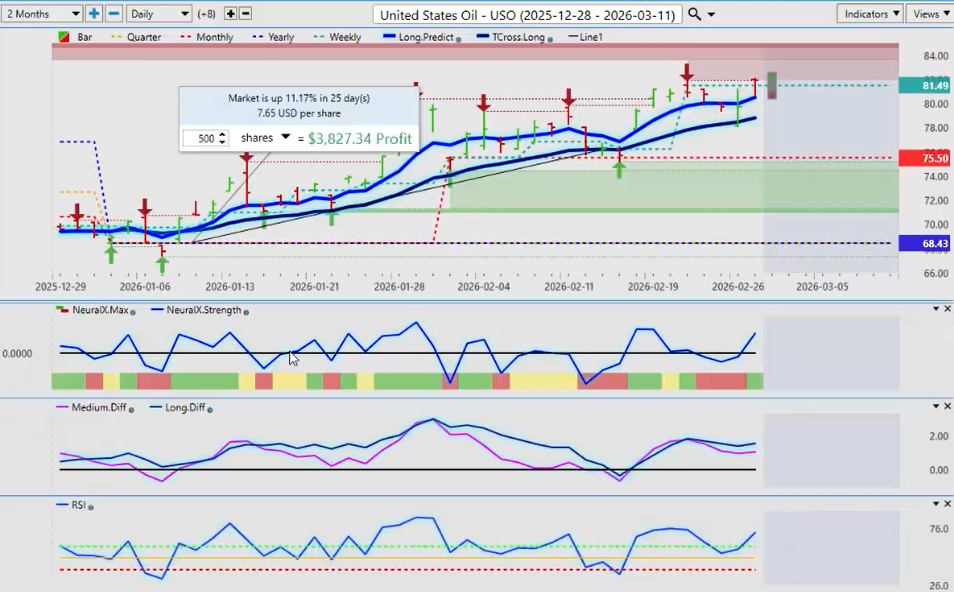
With oil, it would normally rise next month anyway, guys, so this is just helping things along. So when I look at oil closely here, and always remember that some of the big institutions only a month ago were predicting $35 a barrel on oil, and that came from some well-known people in the industry, and that was dead wrong.
When we look at VP’s prediction of that, it has been very, very bullish right out of the gate, almost right after they said that oil was going lower. Oil has done nothing but go higher. And I have repeatedly warned everybody on here that that comment really didn’t make a lot of sense.
So when we look at the 31 markets that Vantage Point uses to forecast this market, they were not in agreement with that call. And again, oil continues to rise, and I suspect it will rise even further. But either way, that seasonal pattern in oil would normally start towards the end of March into about early July, end of June.
So right now, our downside support 78.82, 80.52. Then we have our monthly, yearly. This is a very bullish-looking chart here. But oil prices could come under pressure with the current conflict.
Euro versus U.S. Dollar ($EUR/USD)
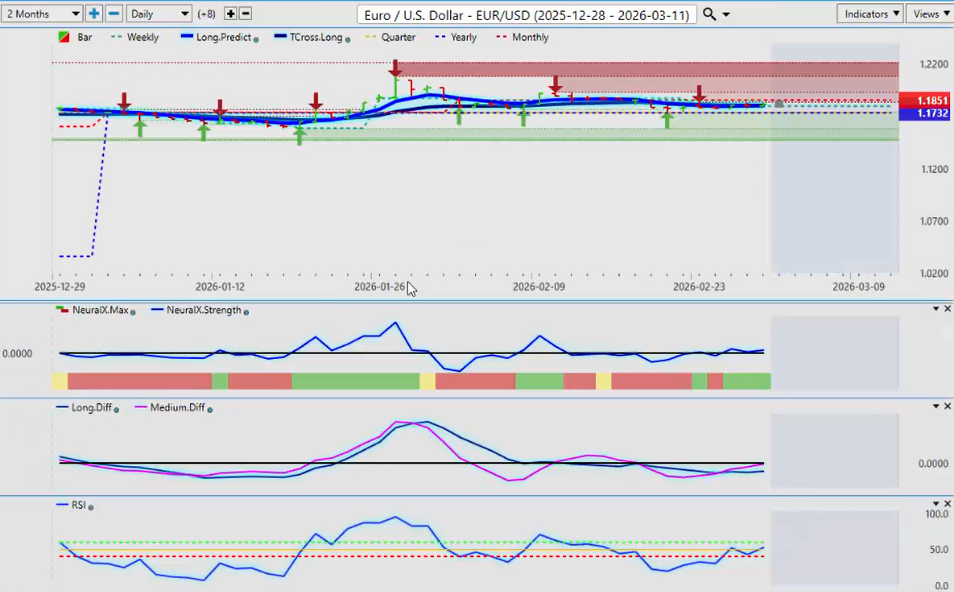
Now, when we look at some of the major currencies here, guys, I think the ones we really want to focus on this week, normally the EUR/USD has a very high correlation to gold. So if gold significantly rises, and this could be the volatility we were looking for to get this thing moving, we’ve been running in a tight channel this year.
The euro has been stubborn, unable to break down below the calendar yearly opening price, that price again coming in at or about 1.1732. So we would need a break of that level or, in my respectful opinion, getting a break of the monthly opening price at 1.1851 could trigger this higher because just because we’re going into a risk-off scenario does not necessarily mean that the US dollar will benefit from this.
So for now, the indicators as of Friday, the close of Friday, the prediction for Monday to start the trading week, it’s saying that the euro is actually bullish. So again, we’ll monitor this.
U.S. Dollar versus Swiss Franc ($USD/CHF)
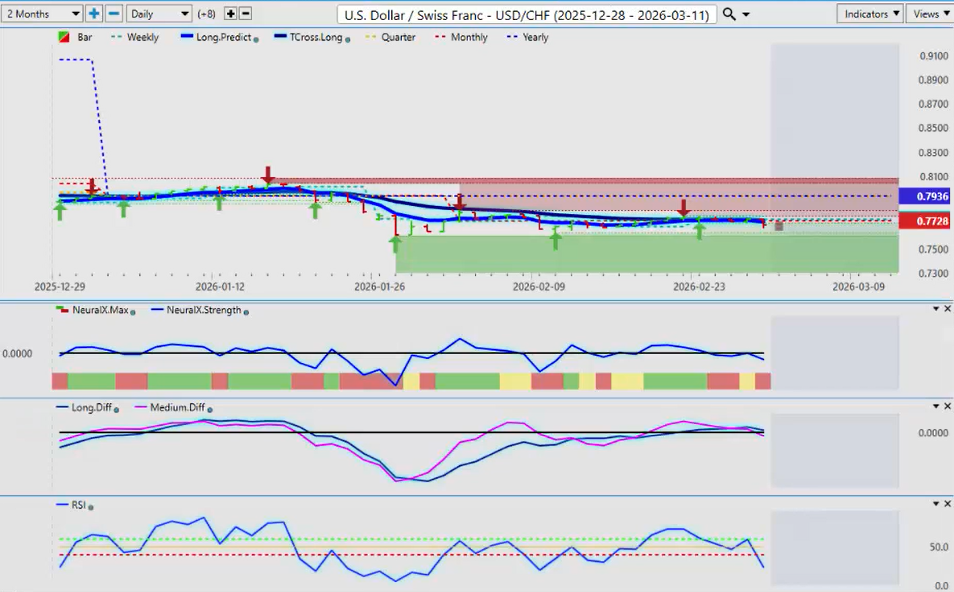
Now, the one I would like to focus on here, and this goes for cross pairs too, anything with the Swiss Frank in it. If this conflict continues, the Swiss Frank will benefit from this. So when I look at the USD/CHF pair, the primary trend is down anyway, guys, below the yearly opening price.
Friday, VP’s prediction is that this chart is bearish. We’re breaking down, unable to break above the T cross long at 0.7737. Our neural index strength is down. We have a medium-term crossover that has occurred to the downside, and the MA diff cross warned of a move lower on Wednesday of last week and a break of the 40 level. This is a big warning sign here, guys, that again, even if the dollar strengthens, it’s very likely that it will not strengthen against the Swiss Frank.
British Pound versus U.S. Dollar ($GBP/USD)
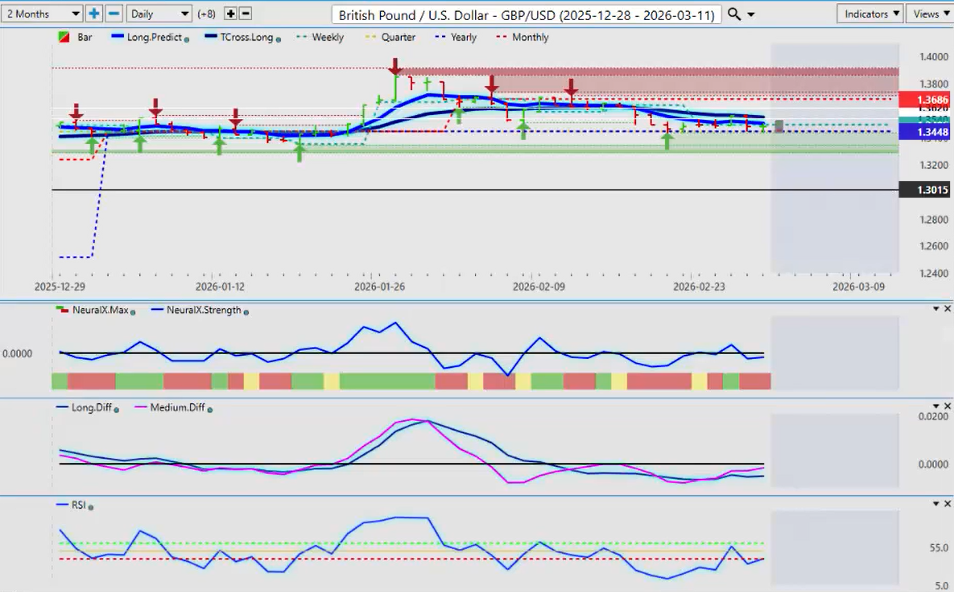
Now, again, when we look at these, these are all G7 pairs. The GBP/USD can benefit from rising oil prices. I think that’s what’s really been happening, really been helping the GBP/USD survive the test of the yearly opening price. But the GBP/USD is not necessarily a risk-off currency. It’s more of a risk-on currency.
So the British pound for next week, if the dollar weakens, that could be some opportunity. But watch your yearly opening price at 1.3448.
U.S. Dollar versus Japanese Yen($USD/JPY)
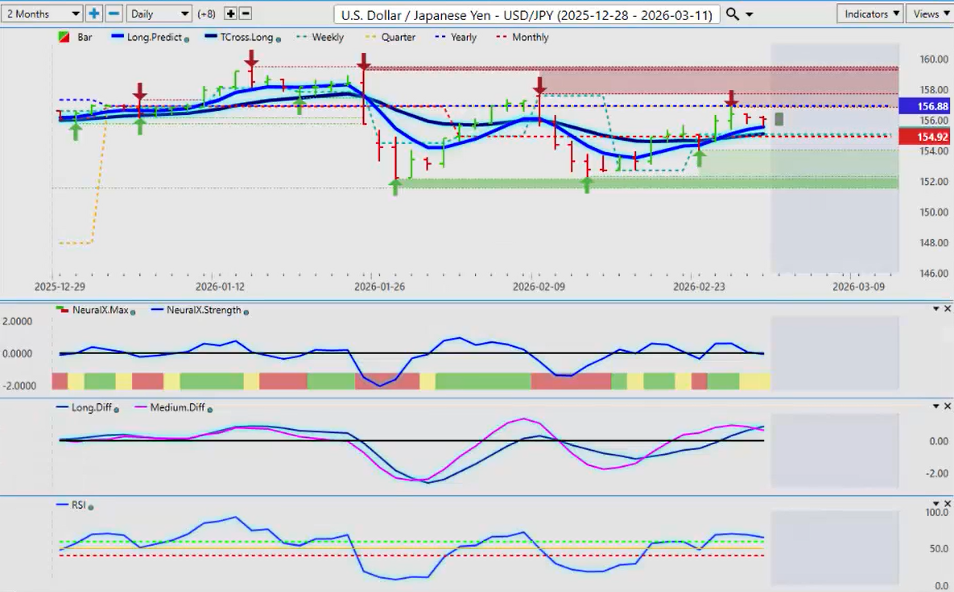
Now, the USD/JPY, again in a risk-off scenario, it’s usually three currencies that strengthen: the dollar, the Swiss Frank, and the yen. So we’ve had a test on Wednesday of last week of the calendar yearly opening price at 156.88, and in my respectful opinion, that was a pretty significant failure.
We were slowly moving lower on a corrective basis, but now we have an MA diff cross to the downside. So I suspect the yen is about to strengthen next week, and further gains and losses on the yen will be determined by the market itself.
Stocks down, yen up, Swiss Frank up, potentially the dollar up. So there’s a big warning sign here that this is potentially getting ready to sell off. So watch 156.88. If we cannot get above that level by midweek, then this thing is going significantly lower.
U.S. Dollar versus Canadian Dollar ($USD/CAD)
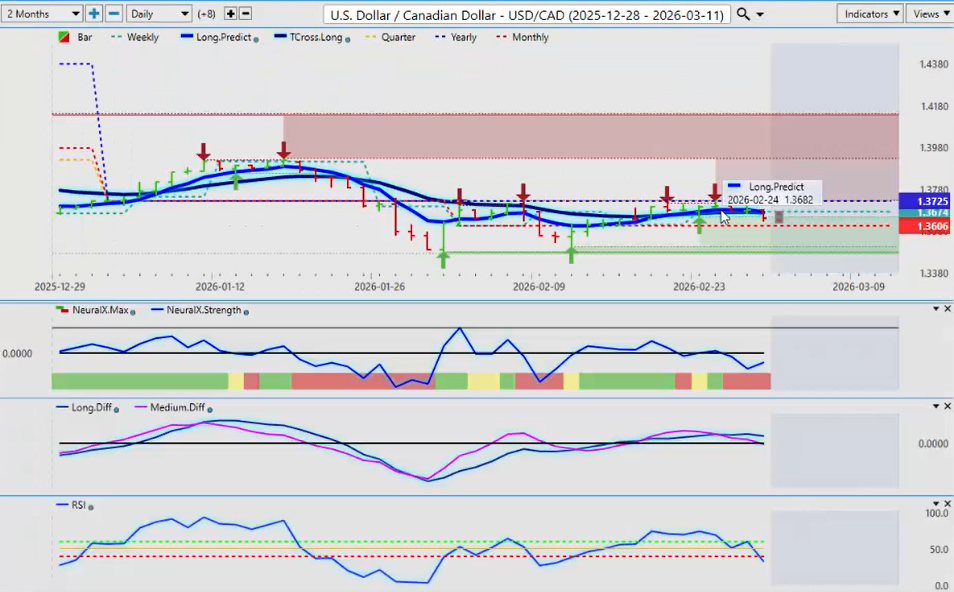
Now, the USD/CAD pair, right now you can see that we have tried to push through the calendar yearly opening price multiple times. That level is, of course, 1.3725. So we’ve seen repeated failures at this level, and what can’t go up must go down.
Now, things have changed again with this Middle East conflict escalating. So in most cases, the Canadian dollar may be hurt if the stock markets fall. We could see this rise, but that would likely be short-term and a selling opportunity as we move into that seasonal pattern of Canadian dollar strength closer to the end of the month. But definitely in April, May, and June, we see repeated strength in the Canadian dollar.
Right now, yes, the indicators are very bearish. Breakout to the downside possible, but our neural index strength is pointing up, so we’ve got to be careful here.
Australian Dollar versus U.S. Dollar ($AUD/USD)
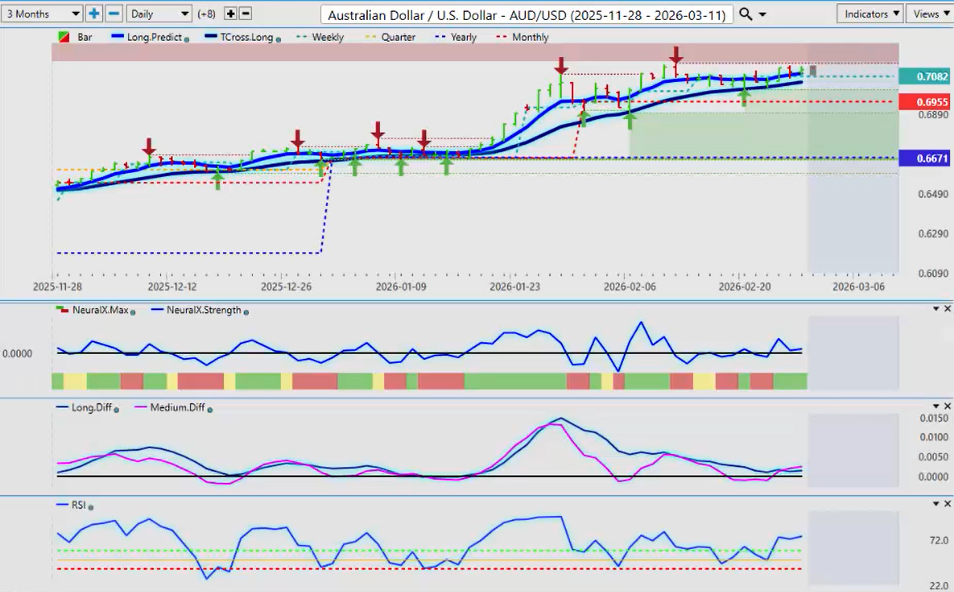
Now, the Aussie and the Kiwi, also risk-on currencies. So if the stock markets crash, you’re likely to see the AUD/USD move lower short to medium term in time frames. Each week I update everybody. We do have a buy signal as of Friday, but we also, in the calendar year 2026 and even towards the end of 2025, what I have noticed is that the correlation between the Aussie and the equity markets is starting to break down.
So for now, I do expect the AUD/USD to move lower at the beginning of the week, but watch your key level, your T cross long, 0.7053. But a retracement back towards the monthly opening prices is extremely likely.
New Zealand Dollar versus U.S. Dollar ($NZD/USD)
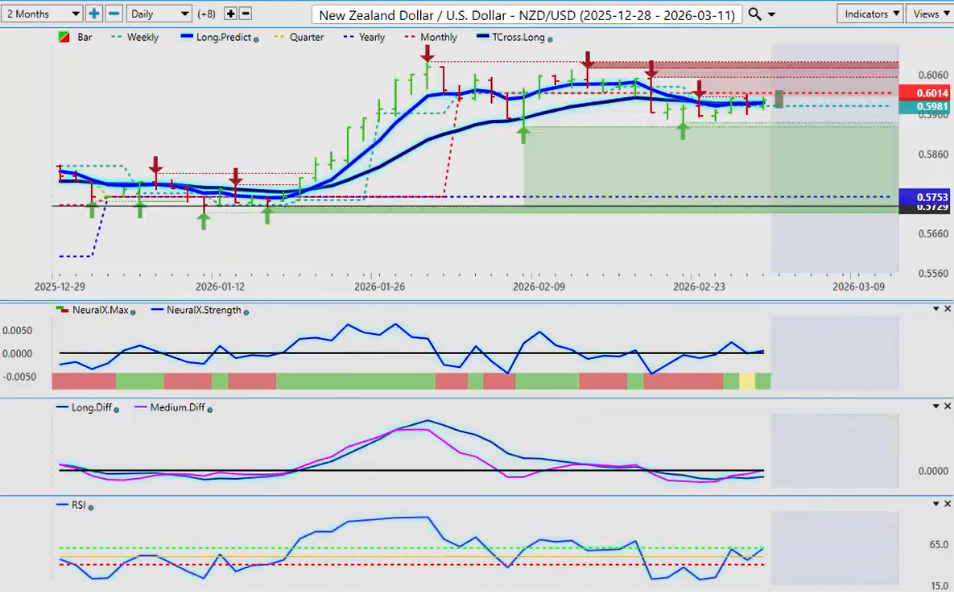
And whatever the AUD/USD does here, I can pretty much assure you that the NZD/USD is going to do the same thing. And the NZD/USD is rising, trying to climb, but I suspect because of what’s happening, we’re going to fail to begin the week.
Midweek is really where we just need a couple of days to see what happens in the markets, and we can assess from there. So next week’s weekly outlook will definitely be a very good one, but there’s a lot of information in this one, and best of luck in the markets.
So with that said, this is the Vantage Point AI market outlook for the week of March the 2nd.