


This week’s ai stock spotlight is Cipher Mining ($CIFR)
Cipher Mining (CIFR) has been on an absolute tear—up 282% in just two months—and traders are finally waking up to why. What started as a bitcoin mining story has evolved into something much bigger: a full-scale play on artificial intelligence infrastructure. On September 25, 2025, Cipher announced a 10-year AI hosting deal with Fluidstack, a system-training specialist financially backed by Alphabet’s Google division. That single headline added more than 10% to the stock overnight—and it didn’t stop there. The market’s still digesting the implications of a bitcoin miner transforming into a dual-purpose data powerhouse. This isn’t just another speculative rally; it’s a bet that Cipher’s low-cost energy footprint and massive Texas data centers will become the backbone for both AI computation and bitcoin mining in the years ahead.
Cipher’s diversification is striking. The company is adding AI-training services to its mining infrastructure, effectively blending two of the decade’s most explosive themes—crypto and AI—under one roof. It even resells excess power when energy markets make that the smarter trade, a clever arbitrage that adds flexibility and cushions margins. Despite its shift into AI, Cipher isn’t neglecting its crypto roots: bitcoin production rose 51% year over year in August, thanks to new hardware deployments that lifted self-mining capacity to 16.8 EH/s, with plans to reach 23.5 EH/s by year-end. Yet for all this expansion, the company remains deeply unprofitable and trades at roughly 43 times sales—a multiple that even the hottest tech stocks would blush at.
Still, this latest surge feels like more than just a meme-stock moment. It’s sustained momentum driven by a massive structural pivot. Cipher is building out 2.6 gigawatts of data-center capacity, a scale that could make it a key landlord for both bitcoin miners and AI developers. With a 10-year, Google-backed contract now anchoring its hosting business, Cipher’s narrative has shifted from a speculative crypto play to a diversified digital infrastructure company. The stock may be overheated short term, but traders with an eye on the future can’t ignore a miner turning into an AI landlord. The question now is whether Cipher can translate its bold vision into consistent profitability before the hype cycle runs out of juice.
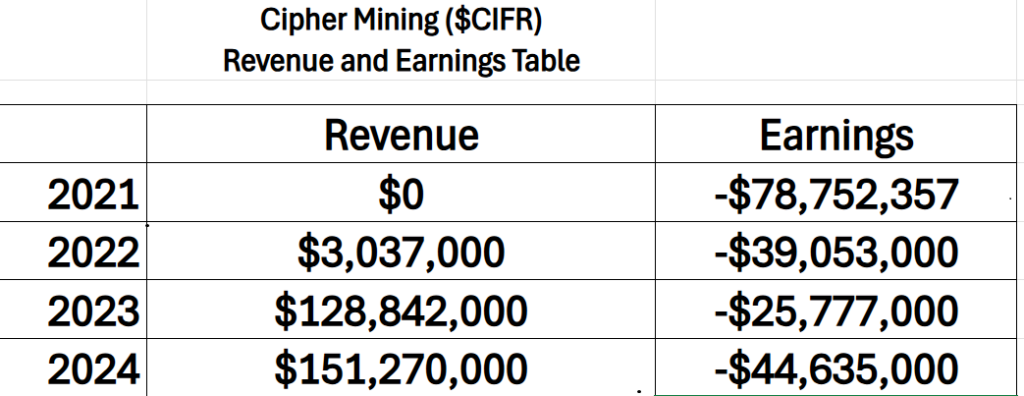
Cipher Mining’s financial story reads like a tale of ambition outrunning arithmetic. In 2021, revenue was nonexistent—just a blank page. By 2022, a modest $3 million trickled in. Then came the big leap: $128.8 million in 2023 and $151.3 million in 2024. The top line exploded, the kind of hockey-stick growth that lights up investor decks and Wall Street screens. But behind the fireworks, the numbers whisper a different truth—Cipher still hasn’t figured out how to make money. Losses have been steady companions: $78.7 million down in 2021, $39 million in 2022, $25.8 million in 2023, and $44.6 million in 2024. The revenue curve points north, but the profit column stays red, stubborn as ever. It’s a company scaling the mountain with a hole in its pocket.
Profitability here is an endangered species, and the longer you stare at the numbers, the rarer it looks. Maybe 2025 changes the story, maybe it doesn’t—but if the past four years are any clue, Cipher hasn’t yet learned how to turn growth into gold. Right now, it’s building castles on energy and ambition, but the foundation—consistent profit—remains elusive.
In this stock study, we’re not here to worship tickers or chase hype—we’re here to understand what’s really driving the tape. Every chart tells a story, and every number hides a motive. The goal is simple: figure out whether this stock deserves your capital, your attention, or neither. The tools we use aren’t guesses or gut feelings—they’re the result of years of data, behavioral insight, and predictive intelligence doing the heavy lifting beneath the surface.
- · Wall Street Analysts Ratings and Forecasts
- · 52 Week High and Low Boundaries
- · Best-Case / Worst-Case Scenario Analysis
- · VantagePoint A.I. Predictive Blue Line
- · Neural Network Forecast (Machine Learning)
- · VantagePoint A.I. Daily Range Forecast
- · Intermarket Analysis
- · Our Suggestion
Artificial intelligence may anchor the forecast, but it’s not the whole story. Before trusting the signal, we step back and look at the company’s financial heartbeat—its fundamentals, its risk pulse, its environment. For $CIFR, that context matters more than ever. It tells us not just what the algorithm sees, but why the probabilities are leaning the way they are—and whether the market’s next move will be conviction… or confusion.
Wall Street Analysts Forecast
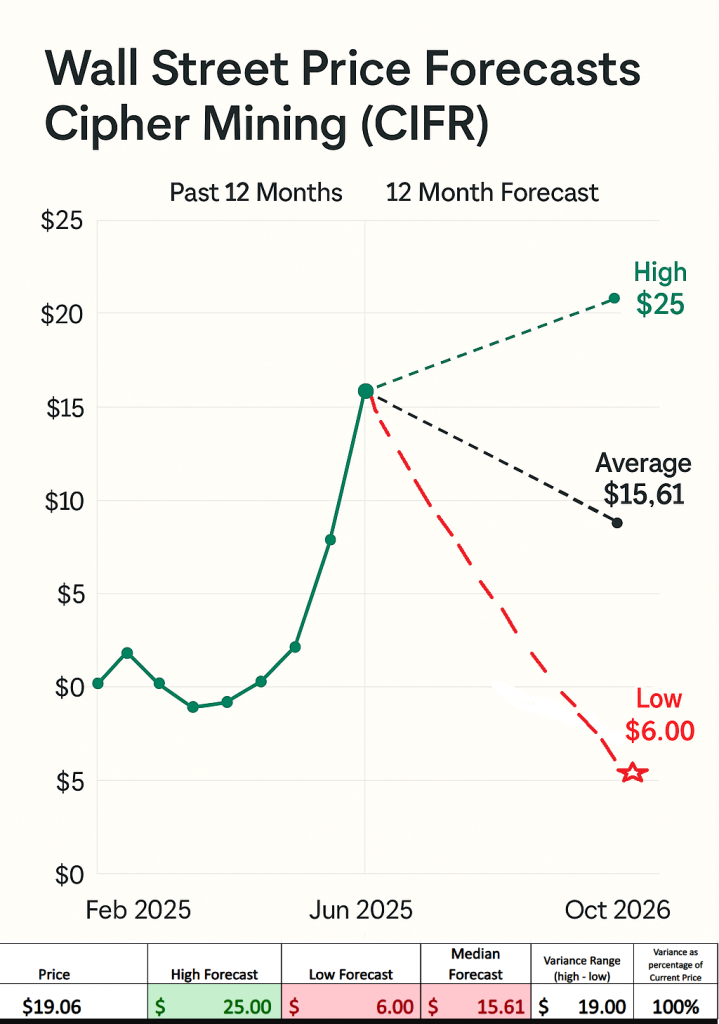
Take a look at this chart — it practically shouts “indecision.” Wall Street’s price forecasts for Cipher Mining (CIFR) couldn’t be more split if they tried. The most bullish analyst sees the stock racing toward $25, while the most bearish sees it collapsing to $6. That’s a $19 spread, or roughly 100% of the current price — meaning the Street is hedging every possible outcome, from moonshot to meltdown. In plain English: volatility isn’t coming, it’s already baked in.
For traders, that kind of dispersion is a double-edged sword. It tells you one thing above all — conviction is low, emotion is high. When analysts can’t agree on direction, price becomes the battleground, and that’s where opportunity lives for those with the stomach for it. Cipher’s dramatic two-month rally has captured attention, but this chart is the fine print behind the hype: Wall Street is still figuring out whether Cipher is the next AI-infused infrastructure breakout or just another crypto-fueled sugar rush. Either way, expect turbulence — and maybe pack a parachute.
52 Week High and Low Boundaries
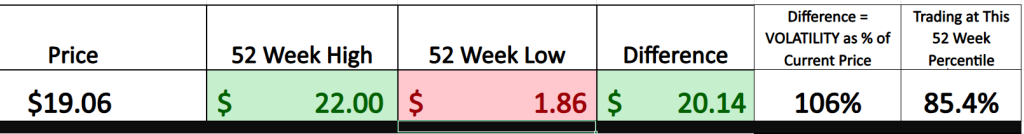
This 52-week range graphic for Cipher Mining (CIFR) says more in a single row of numbers than most analyst reports do in ten pages. At $19.06, the stock is trading at roughly 85% of its 52-week high, which sits at $22.00, while the low is buried all the way down at $1.86. That’s a staggering $20.14 spread—a volatility gap equal to 106% of the current price. Translation? The stock’s had one wild ride, and there’s no sign the seatbelt light is turning off anytime soon.
Traders pay close attention to these 52-week boundaries because they define the emotional edges of the market—the levels where fear and greed are most visible. The 52-week low represents maximum pessimism; it’s where panic once prevailed. The 52-week high, on the other hand, marks the peak of optimism and often serves as both a magnet and a ceiling. When a stock trades near that top quartile—like Cipher is now—it signals strength, momentum, and speculation colliding in the same trade. For technicians, it’s a pressure point; for fundamentalists, it’s a sanity check. And for short-term traders, it’s a playground—because when a stock climbs this high in its range with this kind of volatility, the only constant is motion.
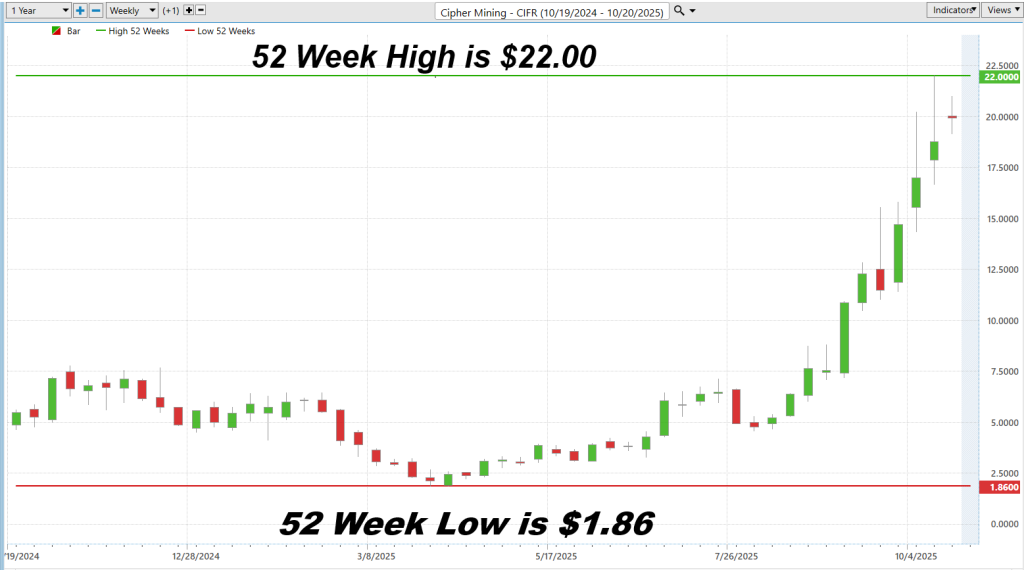
Well now, if you’ve ever watched a river after a long rain, you know there comes a moment when the current quits meandering and starts running with purpose—fast, loud, and unstoppable. That’s what this chart of Cipher Mining ($CIFR) looks like. For most of the year, it wandered in the shallows, splashing around near two bucks a share, where hope and despair were shaking hands. Then, sometime around midsummer, something changed. The current picked up. The price began to climb those green bars like a man late for the last train, and before you knew it, the stock had run all the way to $22, setting a brand-new 52-week high.
Now, breaking a 52-week high is no small matter. It’s like crossing the river and finding out the bridge didn’t wash away after all. Traders notice. Momentum takes hold. Folks who once doubted start squinting at the screen, wondering if they should’ve bought when it was quiet. You can almost hear the hum of greed waking up from its nap. But here’s the thing about momentum—it’s a fine horse to ride, until it throws you. Every rally looks permanent right up until it isn’t.
So when a stock like Cipher bursts through its ceiling, traders see two stories: one written by momentum, and the other by memory. The crowd that bought at the lows feels like prophets. The crowd thinking about buying now feels like gamblers. But as any old river rat—or trader—will tell you, it’s not the splash that counts. It’s whether you know when to paddle and when to get to shore.
Best-Case/Worst-Case Scenario Analysis
If you want to get a real feel for volatility, skip the textbooks and the tidy equations—open the chart. Markets don’t whisper in theory; they shout in motion. Every bar, every swing, every wild reversal tells you exactly how the crowd feels and how fast that feeling can change. The only honest way to understand volatility is to measure it straight from price—how high it’s flown and how far it’s fallen over the last 52 weeks. Those green bursts and red plunges are the market’s heartbeat, not abstractions but evidence. Once you see the range of motion, you stop pretending risk is a mystery and start treating it like gravity—constant, unforgiving, and real. Volatility isn’t fear; it’s feedback. It tells you where conviction ends and emotion begins.
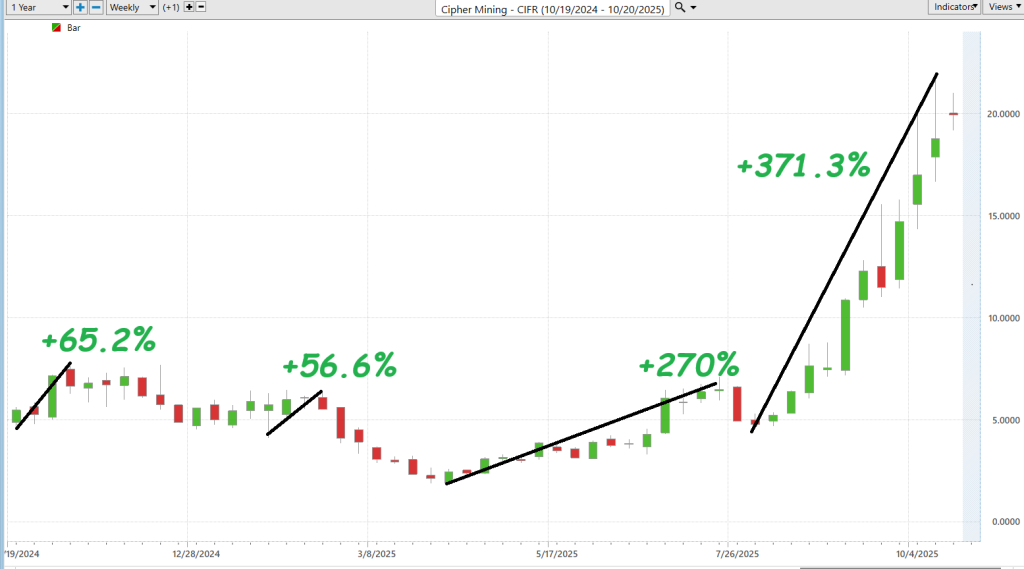
Let’s start with the best-case side of the equation.
Followed by the worst-case scenario.
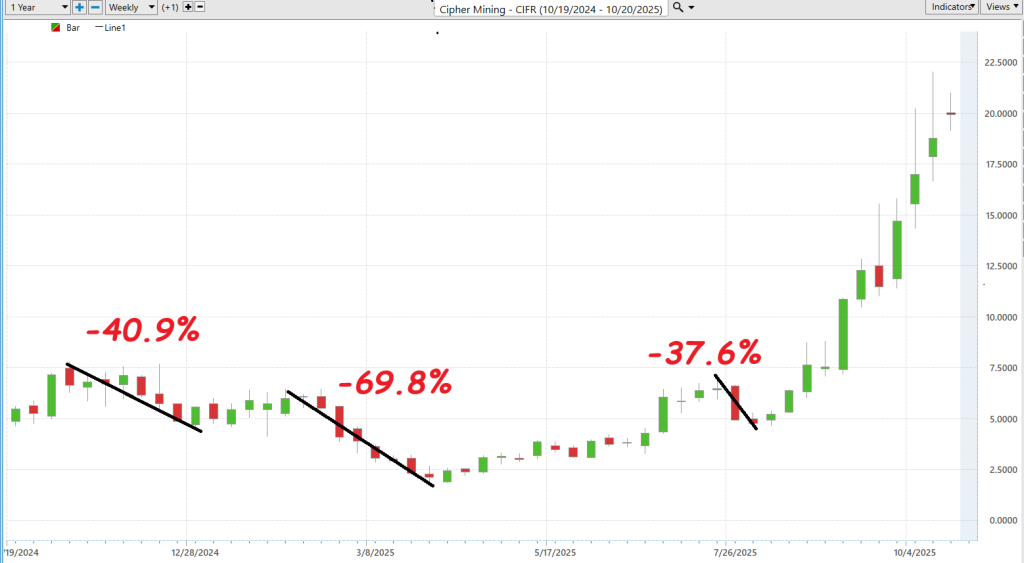
If you want to understand what kind of animal Cipher Mining ($CIFR) really is, these two charts tell the story better than any analyst note ever could. The first one, painted in red, is the reality check — a visual reminder that this stock can fall fast and hard. We’ve seen uninterrupted drops of –40.9%, –69.8%, and –37.6% over the past year. Those aren’t corrections; they’re freefalls. Each one wiped out weeks of gains in a handful of trading sessions. That’s what raw volatility looks like when it stops being a number and starts being a feeling. You can’t trade a chart like that without discipline; it will humble anyone who mistakes momentum for safety.
But then there’s the other side — the green chart — the part that keeps traders glued to their screens. When CIFR moves, it doesn’t tiptoe. It sprints. We’re talking +65.2%, +56.6%, +270%, and a monster +371.3% rally, all in uninterrupted surges. Those aren’t normal runs; they’re breakout behavior fueled by sentiment, short-covering, and pure adrenaline. It’s the kind of tape that rewards speed, punishes hesitation, and tempts everyone to chase.
Together, these charts define the heartbeat of CIFR: wild swings, big opportunity, bigger risk. It’s a trader’s market, not an investor’s sanctuary. You don’t manage something like this by prediction — you manage it by reaction. Respect the volatility, or it’ll remind you who’s really in charge.
Next we compare Cipher Mining ($CIFR) to the broader stock market averages.
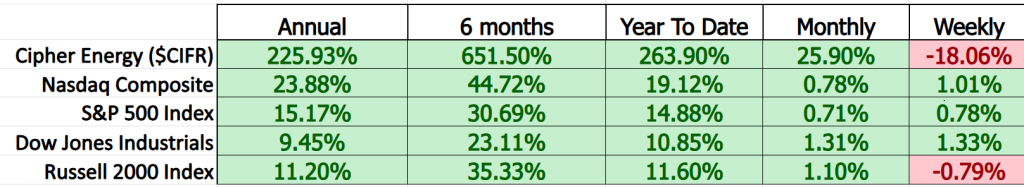
There’s really no way around it—Cipher Mining ($CIFR) has crushed the broader market. While the Nasdaq is up a respectable 24% over the past year and the S&P 500 just over 15%, Cipher has surged an eye-popping 226%. Stretch the lens to six months, and the outperformance becomes even more dramatic—651% versus the Nasdaq’s 45%. Even after a rough week, down 18%, the stock’s trajectory leaves the major indexes in its wake. This isn’t just outperformance; it’s dominance. Traders can debate valuation and volatility all they want, but the scoreboard is clear—Cipher has been running laps around Wall Street’s benchmarks.
Vantagepoint A.I. Predictive Blue Line
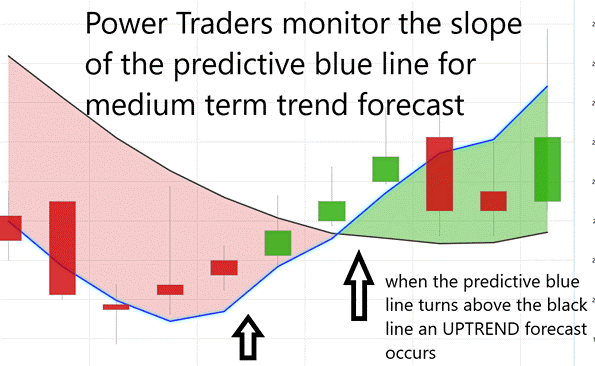
The VantagePoint A.I. Predictive Blue Line isn’t a crystal ball—it’s a compass. It takes the chaos of price action and turns it into structure. Every day, it recalculates what the market is likely to do next by weighing intermarket data—commodities, interest rates, global indexes, and even correlated stocks—and projects that into a single, adaptive trend line. When price closes above the Blue Line, it signals that momentum is shifting upward and traders should lean long; when it closes below, the tone turns defensive, suggesting short or stand-aside setups.
The rules are simple, but the edge is in consistency. Traders use the Blue Line as both a signal and a filter—buy strength above it, sell weakness below it. No guessing, no emotions, no “maybe it’ll bounce.” It’s designed to help you harness volatility, not fear it. Because when markets get wild, human instincts tighten up. The Blue Line does the opposite—it stays objective. It adjusts to new information every 24 hours, keeping traders aligned with the current trend, not the one they wish was happening. In short, it turns volatility into usable data—and that’s the difference between chasing moves and mastering them.
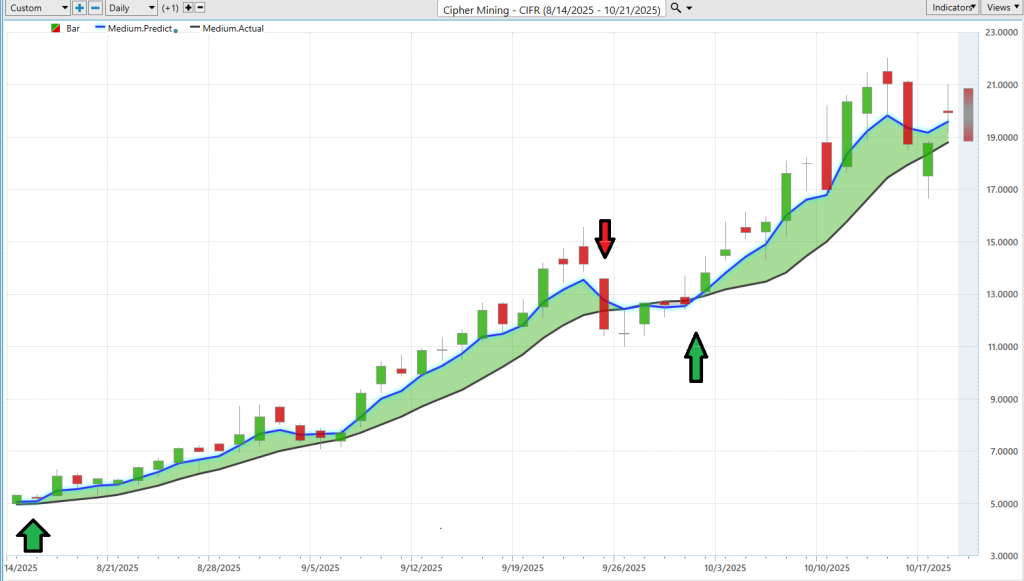
Here’s the thing about the VantagePoint A.I. Predictive Blue Line—it’s like having a trading ninja as your very own trading coach. The chart for Cipher Mining ($CIFR) shows exactly why. When the price dips below that blue line, it’s not some cosmic mystery—it’s the market saying, “Easy there, cowboy.” And when it climbs back above, it’s an invitation to saddle up again. The beauty is in its brutal honesty: no hype, no hopium, just data telling you which side of the fence to stand on. Those green arrows mark moments when the Blue Line flipped bullish and the market took off; the red one shows when gravity reminded everyone it still works. In a world where traders chase every rumor and headline like it’s gospel, this line quietly does the one thing most investors can’t—it keeps its emotions out of the trade.
Neural Network Forecast (Machine Learning)
A neural network for trading is essentially a digital brain built for the markets — but instead of neurons firing signals, it’s math crunching data. Picture thousands of data points streaming in: price, volume, volatility, interest rates, commodities, crypto, currency correlations. The neural network processes all of that through layers — an input layer that collects the data, hidden layers that look for relationships, and an output layer that converts it all into a probability: what’s most likely to happen next. Each connection between “neurons” carries a weight, like an opinion that adjusts every time new data proves it right or wrong. Over time, those weights evolve — the network learns what matters and what doesn’t. What starts as noise turns into a signal.
In modern trading, these networks are the quiet engine rooms behind the charts — learning, adapting, recalculating at speeds no human can match. They don’t get tired, emotional, or distracted by headlines. They see structure in chaos — spotting repeating price patterns, subtle intermarket correlations, or volatility shifts that most traders overlook. And that’s where the real edge lives: in anticipation, not reaction.
Within this framework sits the Neural Index — the part of the system that translates all that deep computation into something traders can actually use. It’s color-coded clarity: green when the network projects higher prices over the next 48 to 72 hours, red when weakness is expected. Behind that simple cue are hundreds of intermarket relationships being modeled and re-weighted in real time. The Neural Index isn’t guessing — it’s calculating. Traders use it like radar, aligning their positions with where the probabilities lean. In a market ruled by volatility and speed, it doesn’t just help you see the next move — it helps you see it before everyone else does.
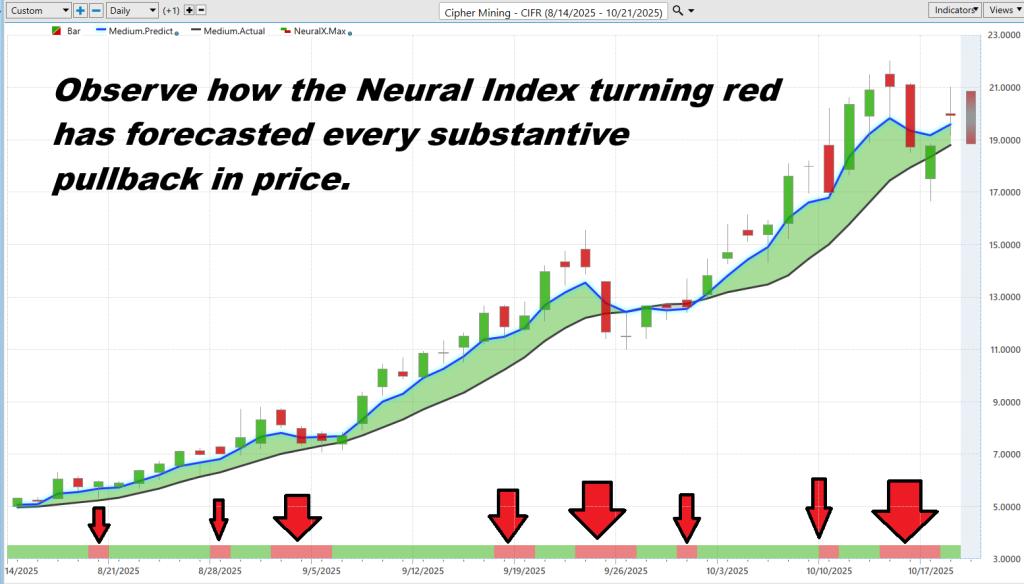
This chart is a gut punch to anyone who thinks trading is random. Look close — every time Cipher Mining ($CIFR) started to wobble, the Neural Index flipped red first. Not once. Not occasionally. Every single meaningful pullback, the red light flashed before the fall. That’s not luck; that’s data working overtime. This thing doesn’t read tea leaves — it reads correlations, hundreds of them, across markets most traders never even glance at.
What you’re seeing here isn’t prediction in the mystical sense — it’s preparation. The Neural Index turns emotion into evidence. When it shifts to red, it’s like the market whispering, “Storm incoming.” When it turns green again, the clouds clear and the bulls stampede. In a world where traders love to talk about “gut feel,” this is the system that has one — but it’s wired to math, not mood.
VantagePoint A.I. Daily Range Forecast
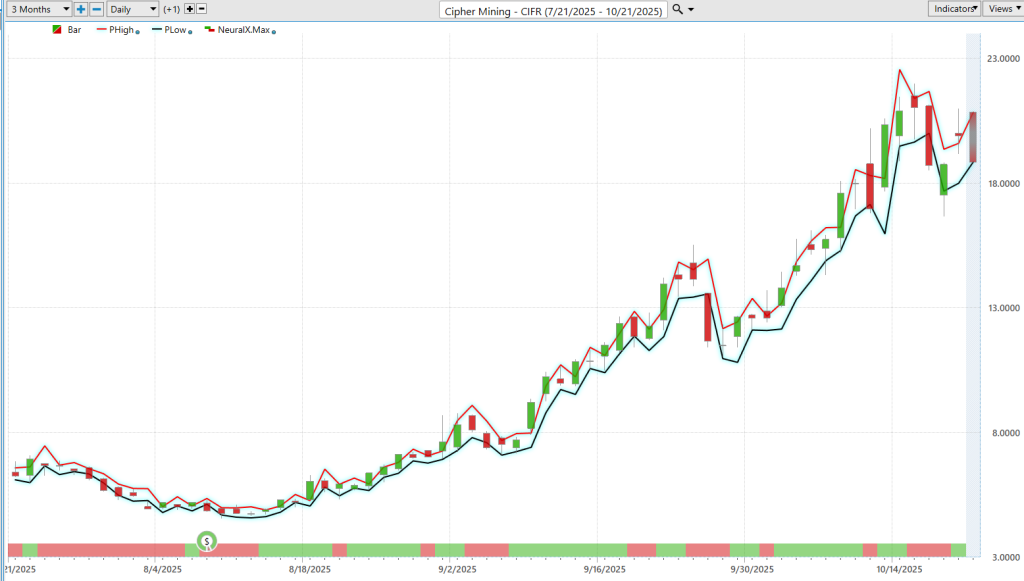
Every trader on the planet wants the same thing — a reliable, effective way to know where to buy and sell tomorrow. That’s the holy grail. And that’s exactly what the VantagePoint A.I. Daily Range Forecast is built to do. It doesn’t just show you what happened — it gives you the map for what’s likely to happen next. But before we get to the chart, let’s talk about why this matters.
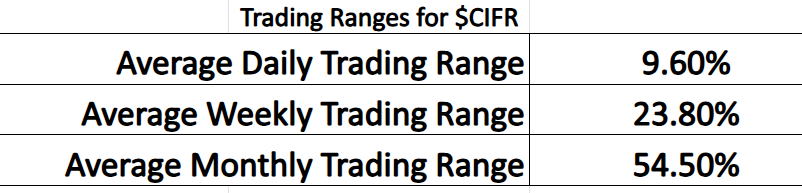
Cipher Mining ($CIFR) is no slow-moving blue chip. This thing breathes volatility. The data proves it — an average daily trading range of 9.6%, weekly at 23.8%, and monthly at 54.5%. That’s not just movement, that’s opportunity — and risk — on steroids. A trader who doesn’t understand those ranges is flying blind, guessing where to enter and exit in a market that punishes hesitation. But a trader who does? They’ve got a rhythm to work with, a framework to turn chaos into precision.
That’s where the Daily Range Forecast earns its keep. Look at the chart — the upper and lower bands are the A.I.’s forecasted boundaries for the next session. They outline where price is expected to go, based on intermarket data and predictive modeling. When you know those boundaries in advance, you stop reacting and start planning. You can buy near the forecasted low, sell near the forecasted high, and trade inside the real estate where probability lives. That’s not luck or gut instinct — that’s strategic alignment with tomorrow’s volatility, today.
Intermarket Analysis
When you strip away the jargon, Cipher Mining ($CIFR) lives and dies by three things — the price of Bitcoin, the cost of energy, and the price of money. Everything else is noise. When interest rates fall and the dollar weakens, liquidity floods in and speculative assets like Bitcoin—and by extension, Cipher—catch fire. But when rates rise or energy costs spike, the air gets sucked out fast. Mining margins tighten, capital dries up, and profitability fades like a mirage in desert heat.
The second takeaway is all about correlation. $CIFR isn’t just a crypto play; it’s a leveraged bet on the global macro environment. It moves opposite to bond yields, mirrors Bitcoin’s swings, and depends on cheap energy like an airline depends on fuel. If oil jumps or the Fed tightens, Cipher feels it instantly. But in the sweet spot—a low-rate world with stable power and a bullish Bitcoin—it becomes a rocket ship. Traders who get that intermarket rhythm right aren’t just guessing trends; they’re reading the weather before the storm hits.
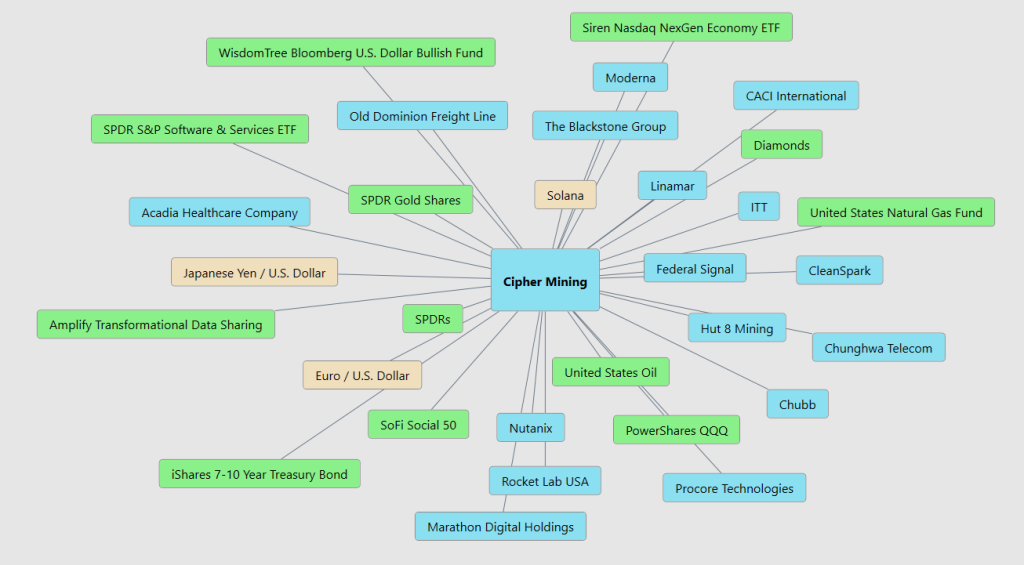
Here are the 31 key drivers of $CIFR price action. I recommend studying the chart and familiarizing yourself with these assets. You are bound to find a few gems.
Our Suggestion
Cipher Mining ($CIFR) is a company that makes money by running big computer centers to mine Bitcoin and do other high-powered computing work. In their last two earnings calls — which are basically company report cards — they said they’re growing fast but still not making real profits yet.
In the first call (from May 2025), the company said it made about $49 million in sales but still lost around $39 million overall. The boss sounded hopeful and said they’re building new facilities and getting more powerful mining machines ready to make money in the future.
In the second call (from August 2025), they said revenue was around $44 million, and even though they showed a small profit on one measure, they still had a big loss after all expenses. They bragged about growing their mining power faster than expected and keeping electricity costs super low — important because mining takes a ton of energy.
The tone in both calls was positive but realistic. The leaders sounded confident they’re on the right track, but they admitted they’re not fully profitable yet. They think once their new sites and faster machines are up and running — maybe sometime after late 2025 — the company could finally start making real profits.
In short: Cipher is growing fast, spending a lot, and betting that bigger and better operations will soon turn those losses into gains.
The fact that the company is not profitable is clearly a warning sign. We advise you to place $CIFR on your trading radar as we think it will create numerous opportunities over the next year.
Now, I’ve seen plenty of shiny stories in my day, but Cipher Mining ($CIFR) feels a bit like a steam engine running full throttle with no coal left in the tender. The stock’s been on a tear, climbing skyward like it’s got angels pushing from below—but here’s the rub: the company still isn’t making any money. Not a nickel of real profit. And that ought to make any sober-minded trader a little uneasy.
You see, a rally without earnings is a parade without a band. It makes a lot of noise, but sooner or later the crowd figures out there’s no music. Cipher’s got ambition, no doubt—big data centers, big dreams, and bigger electricity bills—but until those dreams start paying for themselves, this thing looks more like a meme stock than a money-maker. Folks are cheering, the ticker’s dancing, and the story sounds fine enough, but the math hasn’t caught up with the magic.
Profit is the difference between a business and a wish, and right now Cipher’s still wishing. Until it proves it can mint more dollars than it burns, traders would be wise to enjoy the spectacle with one hand on the exit door.
Practice great money management on all of your trades.
It’s not magic.
It’s machine learning.
Disclaimer: THERE IS A HIGH DEGREE OF RISK INVOLVED IN TRADING. IT IS NOT PRUDENT OR ADVISABLE TO MAKE TRADING DECISIONS THAT ARE BEYOND YOUR FINANCIAL MEANS OR INVOLVE TRADING CAPITAL THAT YOU ARE NOT WILLING AND CAPABLE OF LOSING.
VANTAGEPOINT’S MARKETING CAMPAIGNS, OF ANY KIND, DO NOT CONSTITUTE TRADING ADVICE OR AN ENDORSEMENT OR RECOMMENDATION BY VANTAGEPOINT AI OR ANY ASSOCIATED AFFILIATES OF ANY TRADING METHODS, PROGRAMS, SYSTEMS OR ROUTINES. VANTAGEPOINT’S PERSONNEL ARE NOT LICENSED BROKERS OR ADVISORS AND DO NOT OFFER TRADING ADVICE.


