


Welcome to the Artificial Intelligence Outlook for Forex trading.
VIDEO TRANSCRIPT
VANTAGEPOINT A.I. MARKET OUTLOOK | WEEK OF MARCH 9, 2026
Okay, hello everyone and welcome back. My name is Greg Firman, and this is the VantagePoint A.I. Market Outlook for the week of March 9, 2026. To get started this week, we begin where we always do, with that very important U.S. Dollar and the Dollar Index.
U.S. DOLLAR INDEX – $USDU
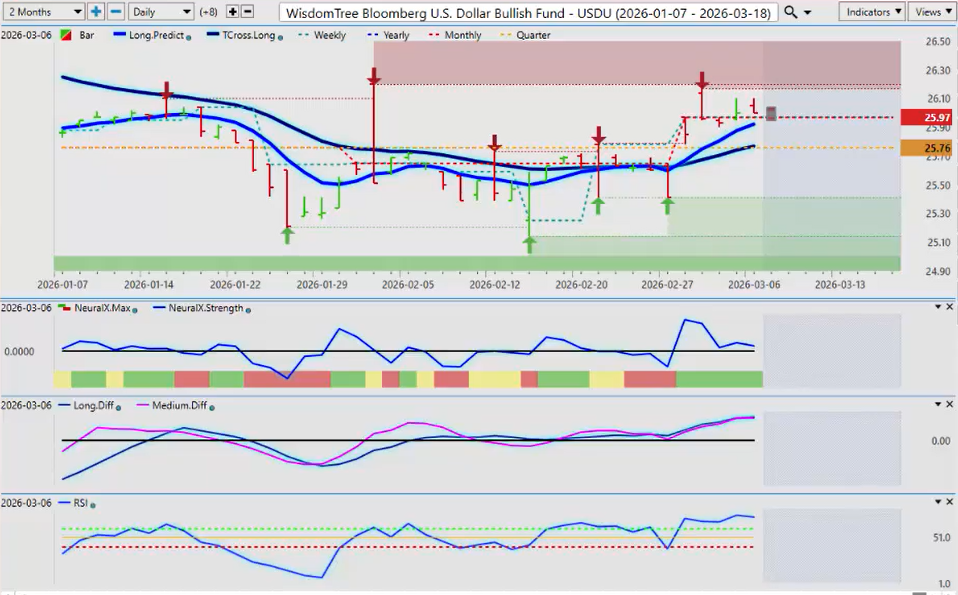
With the USDU, we have managed to just barely climb above the yearly and monthly opening price. But we’ve been above the Tcross Long the better part of the week. Always remember here, guys, that the dollar would see this strength with or without the Iran war at the beginning of the month into the first week of the new month after the Non-Farm Payroll number.
Now, the payroll number was pretty horrific, but the U6 Unemployment Rate at 7.9 was still pretty decent. It’s heading in the right direction. The household survey number and unemployment rate ticking up a little bit should put some pressure on the dollar. But again, we would normally see the dollar coming under pressure the week following the Non-Farm Payroll number.
From there we look at the VP core indicators, the indicators that have absolutely nothing for lag here: the MA Diff Cross, the Neural Index Strength, and the Predicted RSI. They are essentially starting to top out here. Now we don’t want to trade overbought signals here, guys. We want to make sure that there’s a fundamental attached to our technical or intermarket technical analysis.
The indicators in VP are suggesting that the dollar is not as strong as it appears to be. We have a newly formed verified resistance high at 2617, where I would anticipate a failure. We had a similar verified zone at 2620, so very significant resistance up here. If the dollar is going to reverse lower, it will likely be midday Tuesday to midday Thursday of the coming week, because again this is an outlook, not a recap.
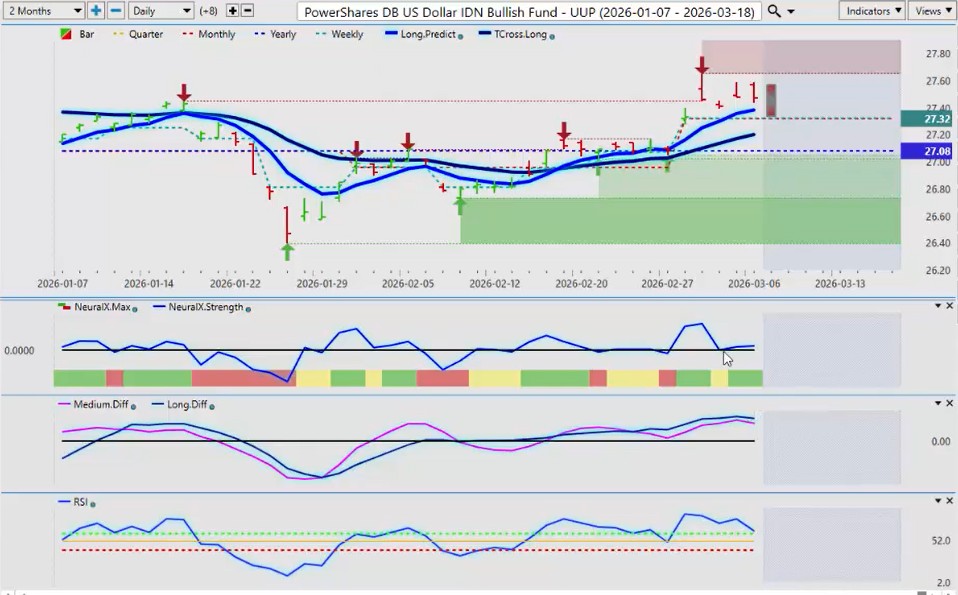
When I look at the bull fund on the UUP, it’s showing a slightly different signal and still looks a little bullish. This is where the outlook becomes extremely powerful using two different ETFs. The Neural Index Strength is strong on the UUP, but the UDN suggests the dollar is losing momentum. This comparative analysis, leaning toward the USDU on global U.S. Dollar transactions rather than applying it primarily to the Euro Currency, gives a better read on how the dollar is actually performing. In reality, it is not as strong as it appears. But again, the outlook is for one week only, and we will reassess next week.
GOLD
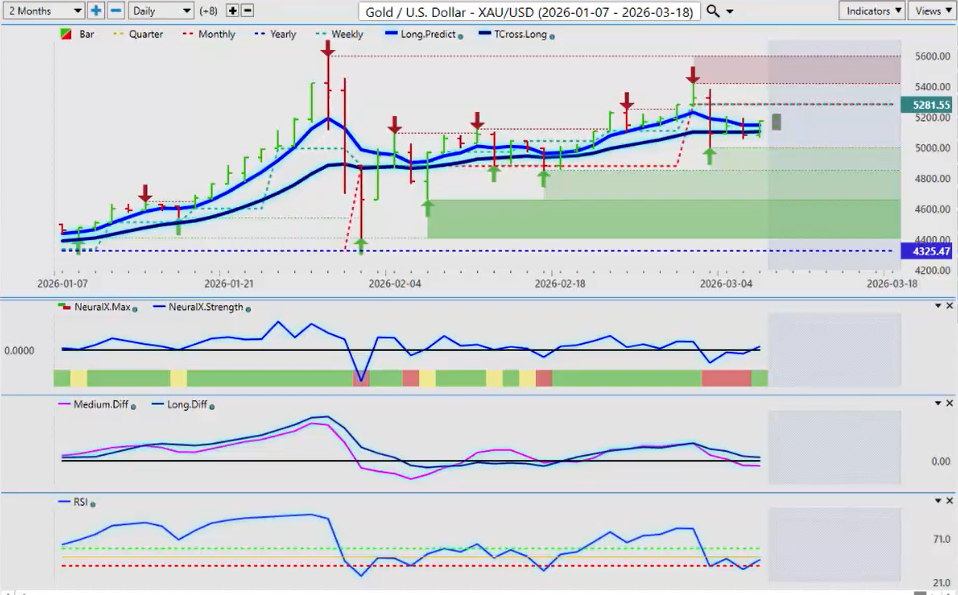
When we compare this to Gold, we can see that Gold is holding right along the VP Tcross Long and bounced from that level on Friday, rightfully so following the payroll number.
The Neural Index Strength has been rising since the large sell-off bar. The Neural Index Strength remained negative at the time, but the indicator itself suggests Gold is moving back higher. Right now the Neural Index and the Neural Index Strength are both in agreement, which is exactly what we want to see.
We do have a medium-term crossover developing, but we cannot apply that signal until we close below the very important Tcross Long at 5103. We must close below that level and remain below it before the medium-term crossover becomes relevant.
This hard pivot line is extremely important, but we also have to correctly identify the primary trend. The trend is not down. The primary trend remains up. We are above 4325, and that would be a logical dip-buying area. However, given current geopolitical tensions, I do not anticipate a move down to that level in the near term.
S&P 500 ETF – $SPY
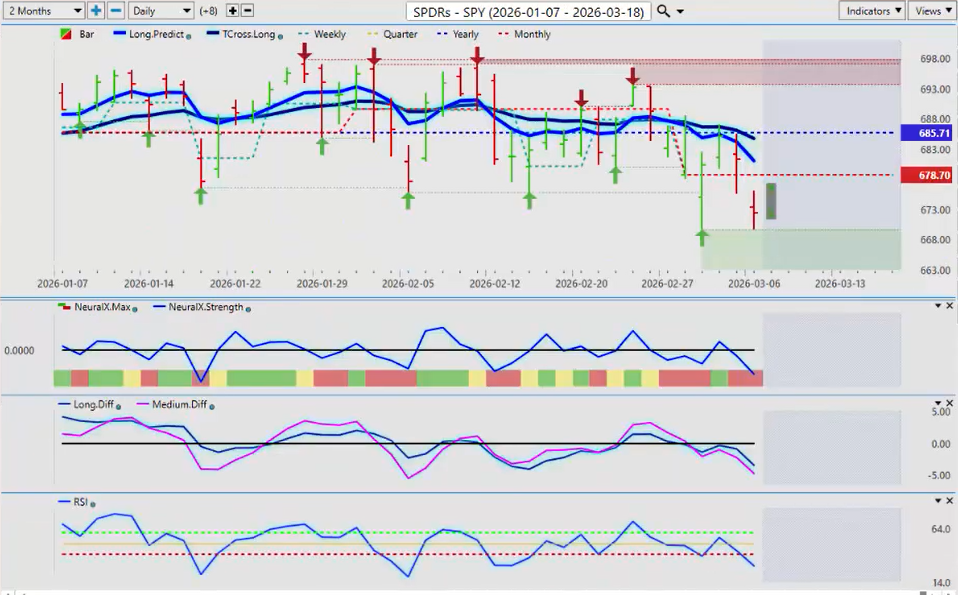
Looking at equities, the SPY is currently under pressure. It has repeatedly attempted to move back above the yearly opening price but has struggled to do so. We can further assess that the Tcross Long is also sitting near 60 heading into the coming week.
Under normal circumstances, this would be a bearish signal, and I would agree with that if we did not have the geopolitical backdrop involving the U.S., Iran, Israel, Russia, and Ukraine.
With the Tcross Long crossing over the yearly opening price, it confirms that our current position is bearish until that level is cleared. For traders looking to pinpoint entry points, a strategy could be to place buy stops above the yearly opening price.
Historically, shorting equity markets over the last five to seven years has not worked well for extended periods. Therefore, if traders want confirmation of a long trade, they could place a buy stop above 68571. If the market rallies sharply, the order would already be in place.
RUSSELL 2000
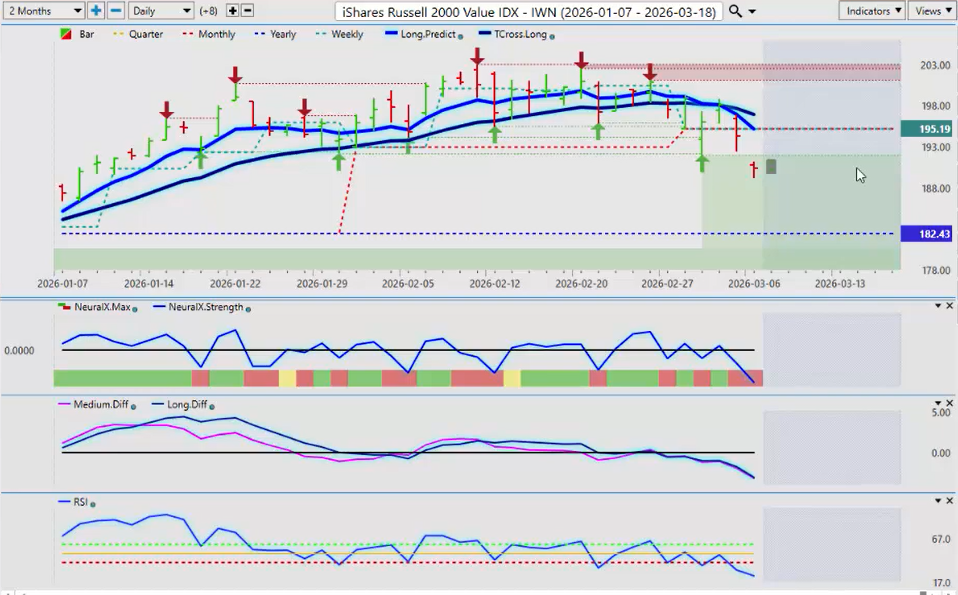
The Russell 2000 looks structurally very different from the S&P 500 and the Nasdaq Q’s. The market remains positive on the year at 18243.
Yes, the VP indicators are currently negative, and I do expect a short-term pullback. However, we must always identify the primary trend. We want objective analysis rather than subjective tools.
The short-term and possibly medium-term trend may be down, but the long-term trend remains firmly upward. We will watch the MA Diff Cross for reversal signals.
At the very least, I would anticipate a retracement back toward the Tcross Long at 19694, potentially by midweek.
DAX
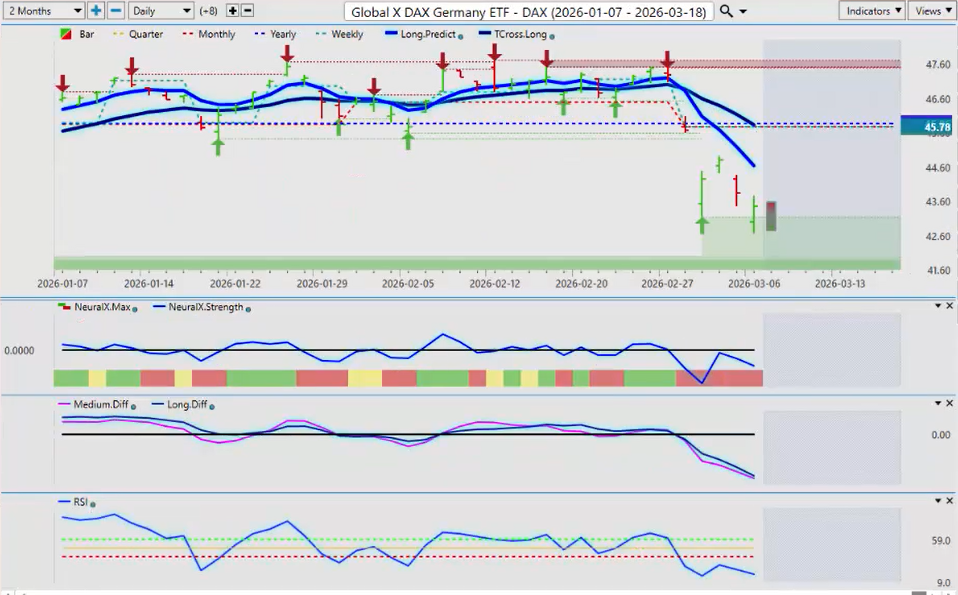
The DAX experienced heavy selling pressure this week, largely due to weakness in the Euro.
The U.S. currently has a dispute with Spain, which refused the use of its air bases. That development immediately impacted the Euro and the DAX.
If these issues resolve themselves, the DAX could rebound alongside the Euro. I believe this is likely in the weeks and months ahead once geopolitical tensions settle.
For now, we have a verified support low on the DAX around 4314. When I see a large move away from the Tcross Long, I measure retracements based on that distance rather than using tools like Fibonacci.
The two key levels are 4463 and 4584. The yearly opening price also aligns with the Tcross Long at 4584, creating a significant pivot point.
All I need now is a trigger from VP, specifically the MA Diff Cross, where the pink line crosses above the blue line.
Volatility Index ($VIXY)
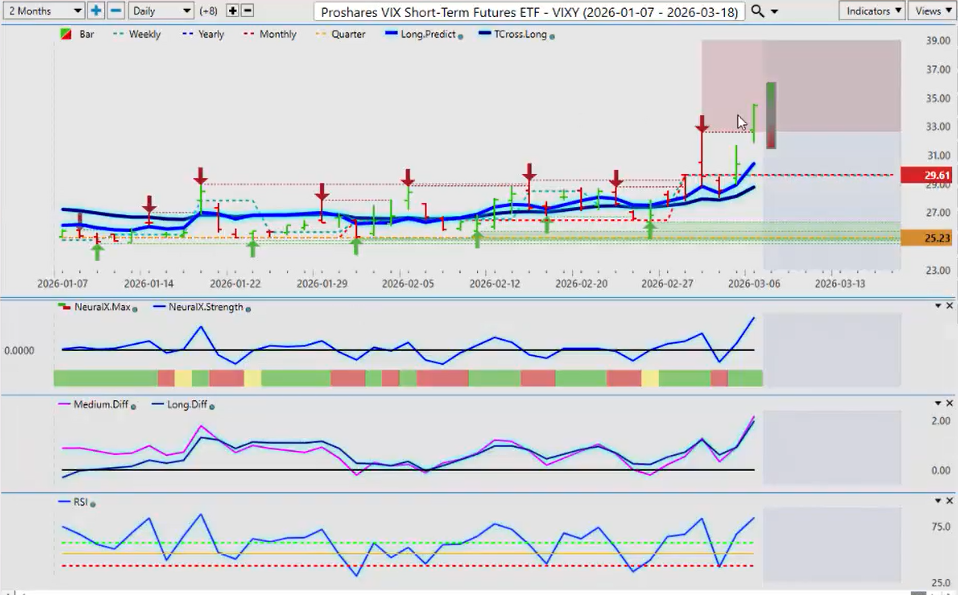
Turning to the VIX, I have been discussing this for several weeks. My concern is that the VIX has not moved below its yearly opening price at 2523.
We have seen a significant upward extension, but based on the payroll number, money could begin moving out of the U.S. Dollar and back into equities.
We are watching for a trigger point. With a 60/40 split on the Predicted RSI, the market came down to the 40 level and bounced.
We also had the Tcross Long at 27.85, identified on March 4th. For the market to move toward 2523, we would have needed two consecutive closes below that level, which did not occur.
Therefore, while the VIX may be somewhat overextended, it could still move higher.
BITCOIN
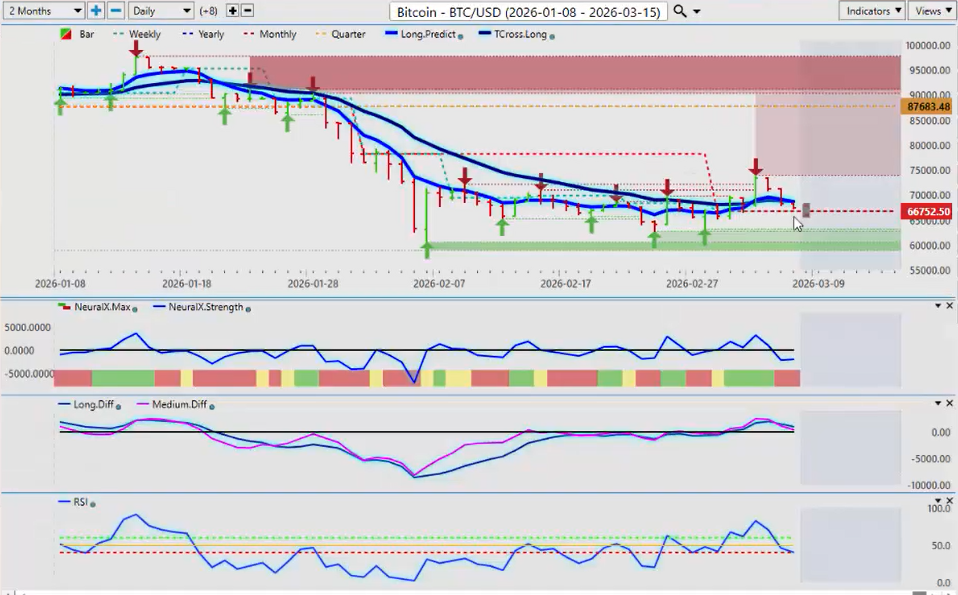
Bitcoin had a very strong week overall.
Although it finished slightly lower, it remains positive on the month at 66,752. Historically, I have observed significant buying activity in Bitcoin during March and October, and often beginning in late September.
We do have an MA Diff Cross to the downside, but traders should be cautious. The broader trend appears down because Bitcoin is still below the yearly opening price at 87,683.
However, the monthly opening price at 66,752 is critical. If the downtrend is going to continue, we must see Bitcoin close below the monthly opening price for at least two consecutive days.
If the U.S. Dollar begins losing momentum midweek, that could push Bitcoin higher.
United States Oil ($USO)
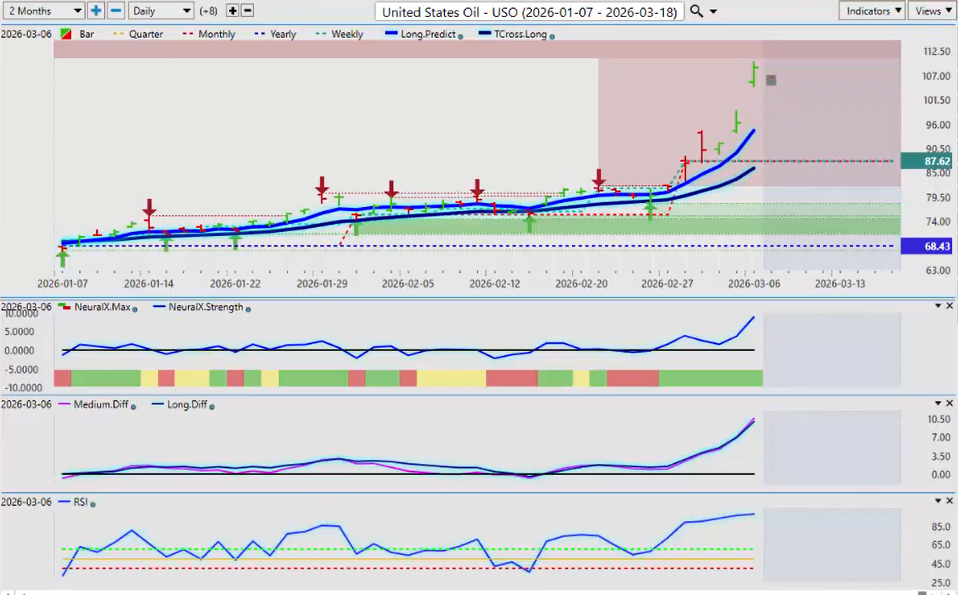
Looking at Crude Oil, the market is extremely overextended.
In my view, part of this move reflects opportunistic pricing by the oil industry as tensions escalate between the U.S., Israel, and Iran.
However, seasonality also favors Oil moving higher during April, May, and June.
Friday produced a large move away from the Tcross Long and the long predicted value. Roughly 80% of the time when we see a bar like that, a retracement follows.
The Tcross Long is at 85.89, and the further price moves away from that level, the less attractive the long trade becomes. I expect a pullback first, followed by a continuation of the seasonal uptrend into the second quarter.
Euro versus U.S. Dollar ($EUR/USD)
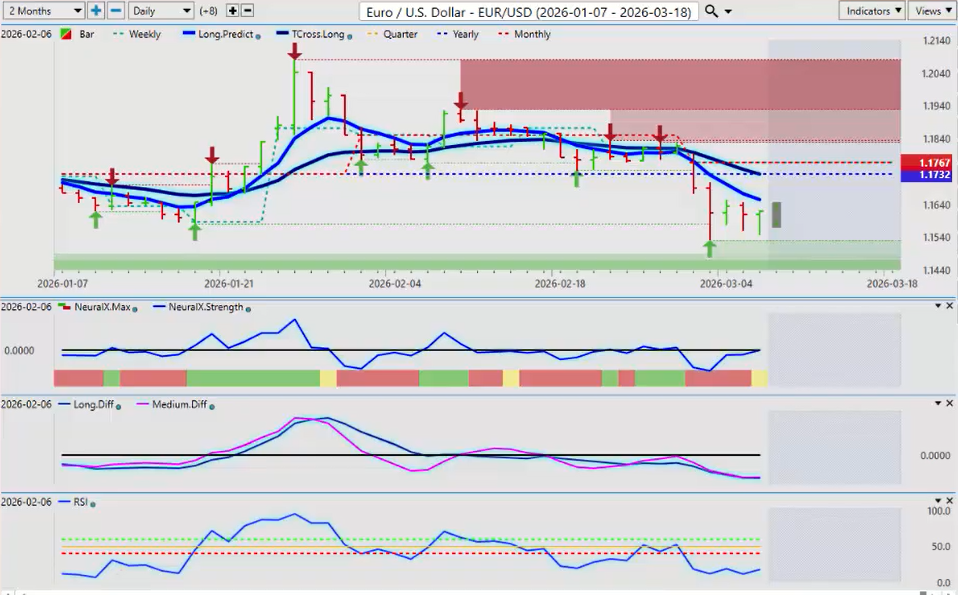
Now, when we look at some of our main forex pairs, obviously without the U.S.–Iran war, the Euro would not be sitting where it is. So that would tell me that there’s limited downside on this because, again, I think you’re going to see more money going towards the Swiss Franc.
And again, the Swiss National Bank, they just really have a hard time learning from their mistakes, don’t they? They intervened in the currency markets again on Monday and were talking down the Swiss Franc, saying don’t put your money here. Don’t put your money in the Swiss Franc.
That has blown up in their face multiple times with the Euro–Swiss Franc peg, for example. This is the best one I can give you.
So, I believe right now on the month that this is perfectly normal for the dollar to move, the Euro, excuse me, to move lower at this time. But the question is, can this continue?
So the verified support zone now comes in at 11530. There is very significant support.
Now I will further concede that the Euro trend, at least for now, is down.
So you can sell into rallies or you can put buy stop orders above 11732 and 11767.
Once we move back up above that, then I would look for the Euro uptrend to continue.
That may not be this coming week, guys, but I do believe that that is coming.
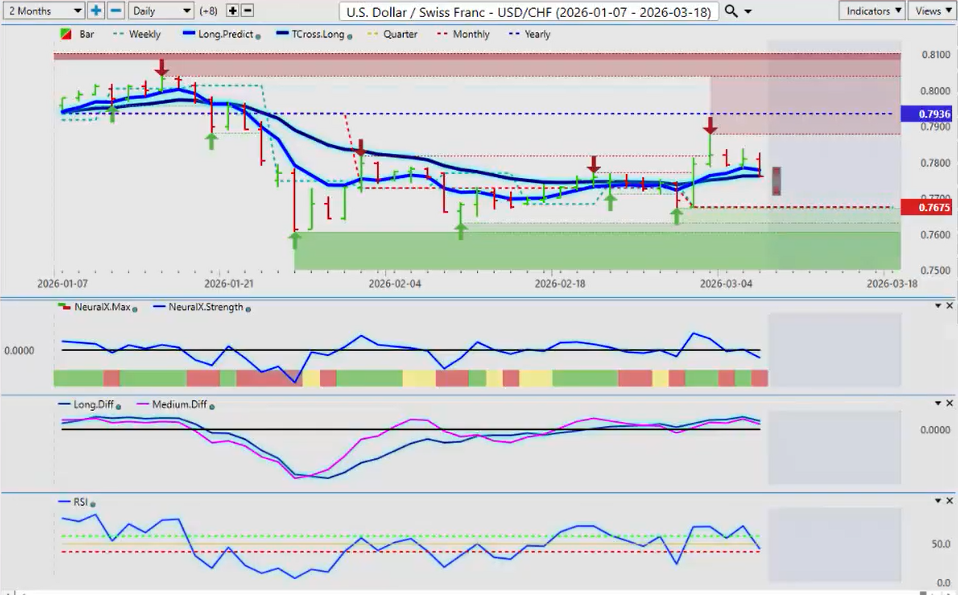
U.S. Dollar versus Swiss Franc ($USD/CHF)
Now with the U.S. Dollar / Swiss Franc, that is a pair we want to keep an eye on.
And when we look at the U.S. Dollar, at first glance it appears that it’s very strong, but as you can see it’s negative on the year.
So this is, so far, it’s one and one. One strong. The U.S. Dollar is strong against the Euro. The U.S. Dollar is not strong against the Swiss Franc.
So already their intervention is backfiring.
So the yearly opening price 7936, we are trapped and we are likely going to trade between 7675, the monthly opening price, and the yearly opening price.
Again, giving you guys an alternative strategy for the more savvy trader, you put a buy stop above 7936 and a sell stop below 7675.
I believe the lower end of that is the one that will get triggered.
But if you don’t want to get involved in this intraday chop, then use the VP indicators in a different way.
The Neural Index Strength is saying, no, we’re coming down to the lower end of this particular range.
And again, guys, this is a real defined range. Not by me, not by VantagePoint, by the market.
The monthly opening, the yearly opening, and we’re using the VP indicators to navigate through these very choppy waters, pardon the pun, but again it’s pointing down. So if we look at the repetitive seasonal patterns in the dollar and the risk-off scenario, it’s not just applied to the dollar. It applies to the Yen, the Swiss Franc, and the dollar. So all three of them.
So looking at this right now, I would respectfully submit that if we can’t hold above the Tcross Long at 7762, we are moving lower.
British Pound versus U.S. Dollar ($GBP/USD)
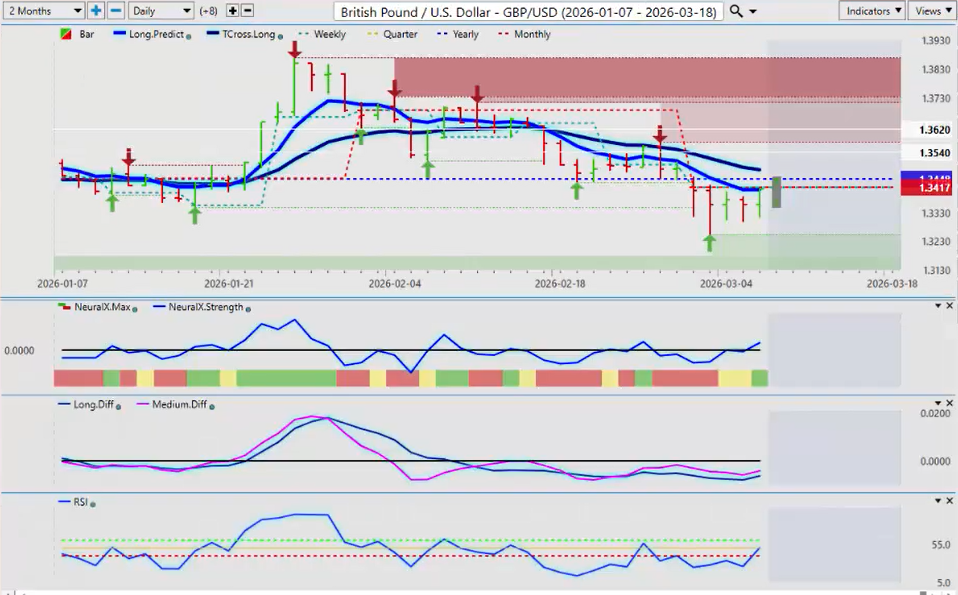
Now again the British Pound, which essentially mirrors the Euro trade, it too now is below the yearly opening price, but just barely.
And without the Iran–U.S.–Israeli conflict, the Pound wouldn’t be here.
So if this conflict starts to resolve itself, this starts to move higher.
But for now you’ve got the Euro and the Pound that are weak against the U.S. Dollar, but you’ve got the Swiss Franc that’s strong.
So it’s 2:1 right now.
U.S. Dollar versus Japanese Yen ( $USD/JPY)
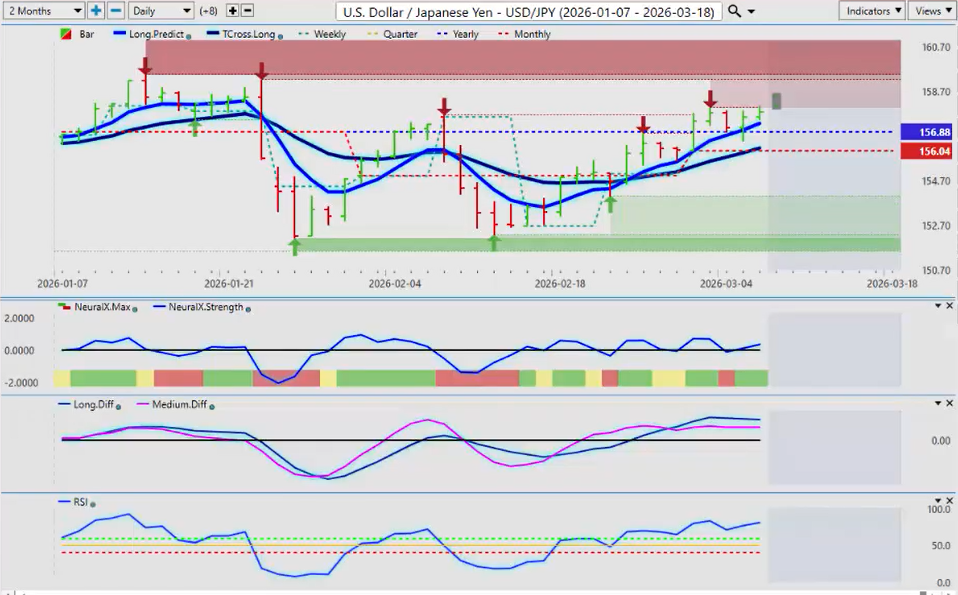
If we look at the Japanese Yen, once again the Japanese Yen should see some kind of strength, but for now the U.S. Dollar has regained the yearly opening price.
I seriously doubt that this is going to hold because when we look at that employment number I believe the Fed is getting backed into a corner on these interest rates. He’s going to have to cut. They’re delusional if they think otherwise.
That type of unemployment number, and if you look at a rolling average of jobs of six months, it was 85,000. Now it’s even lower.
So once again we’ve got an MA Diff Cross warning us that there isn’t a lot of strength up here.
But for now I will concede the dollar has regained its footing, but that carry trade is going to be in trouble.
U.S. Dollar versus Canadian Dollar ($USD/CAD)
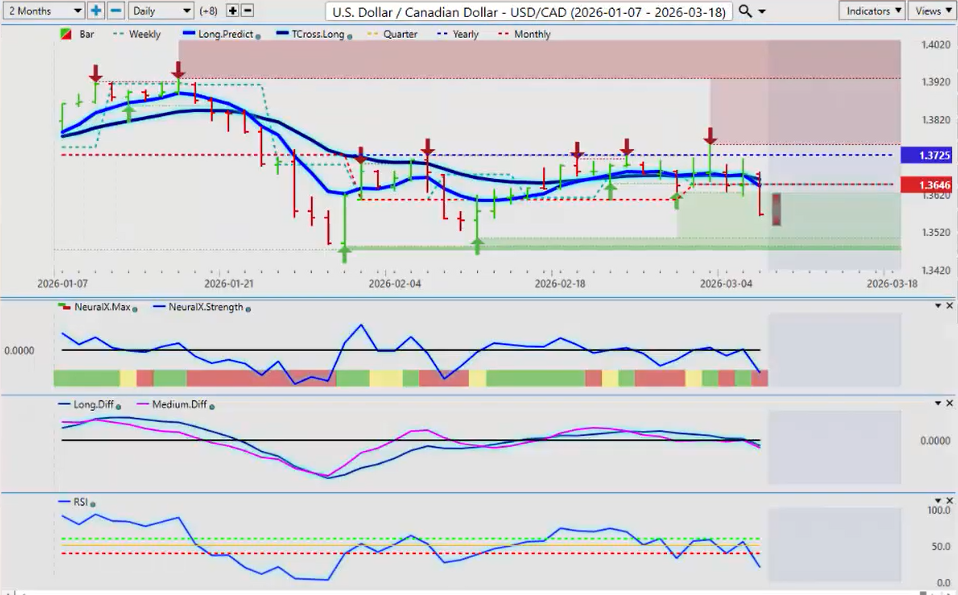
So the dollar has managed to make gains against three currencies, but here’s where it gets interesting. These three currencies, the Aussie, the CAD, and the New Zealies, if we’re not just pegging it and heavily weighting it to the Euro, then we see a little bit of a different picture.
When we look at the Canadian Dollar, we’re below the yearly opening price. We’ve been working on this pair for the last several weeks in the VP live training room. If it can’t clear this level, it’s a short.
And in my respectful opinion only, looking at the seasonal patterns with the Canadian Dollar, it was going to strengthen anyway even though the Canadian economy is not doing well. But again Oil prices normally go up toward April, May, and June anyway. So right now this is not a surprise that the primary trend on this is down.
If you can’t break through that yearly opening price, it goes down. But either way the dollar is not actually making any gains against the Canadian Dollar.
So when we look at that further, this looks like it’s getting ready for a bigger move to the downside also.
Australian Dollar versus U.S. Dollar ($AUD/USD)
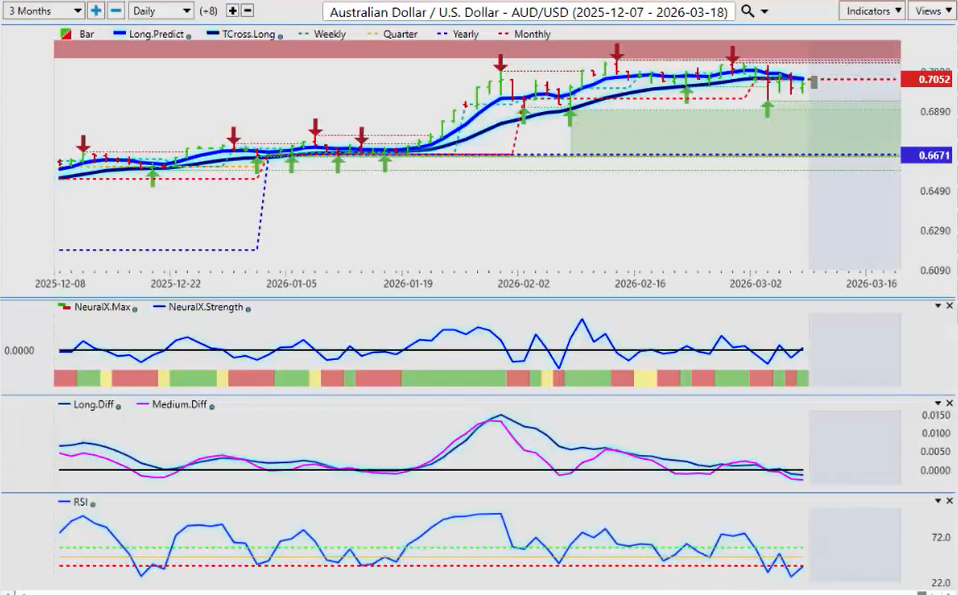
So what about the Aussie?
Is the Aussie actually making gains? Is the dollar making gains against the Aussie?
The answer is no, it’s not. If we just identify the primary trend, yes we’re below the Tcross Long, but we are firmly above the yearly opening price. So all three of those currencies are actually doing well. Plus if we add the Swiss Franc into that, then four of the seven the dollar is losing ground against. And again you have to identify the primary trend. And it’s indisputable between the Kiwi, the Aussie, and the CAD. They are making gains. And this is where it gets even further interesting.
This tells me it’s required dollar buying that may dry up in the days and weeks ahead. So the Tcross Long here is coming in at 7053.
New Zealand Dollar versus U.S. Dollar ($NZD/USD)
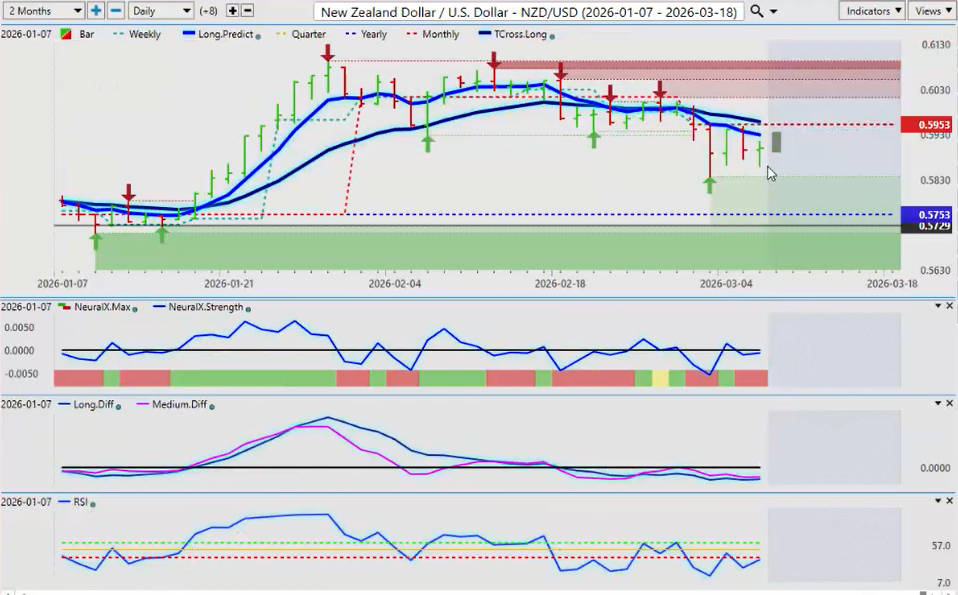
When we do a comparative to the Kiwi, it’s the same thing. The dollar is in a downtrend against the Aussie, the Kiwi, the CAD, and the Swiss Franc. So out of your G7 currencies, it depends how you want to measure the strength of the U.S. Dollar. I would measure that strength by saying the dollar is making gains against the Euro, the Pound, and the Yen.
But I’ve already stated that I don’t believe the dollar’s strength against the Yen is going to continue. Because the interest rate differential between the Bank of Japan and the Fed, whether the Fed knows it or not, is about to change.
So with that said, this is the VantagePoint A.I. Market Outlook for the week of March 9th, 2026.


