


| This week’s a.i. Stock Analysis is CleanSpark ($CLSK) |
CleanSpark is a dynamic player in the bitcoin mining sector, focusing. Headquartered in Henderson, Nevada, CleanSpark has carved a niche for itself by operating data centers that predominantly rely on low-carbon power sources. Founded in 1987, originally as Stratean Inc., it rebranded to CleanSpark in November 2016, signaling a strategic pivot towards clean energy and bitcoin mining operations.
CleanSpark boasts a comprehensive workforce of 130 employees, underlining its commitment to innovation and growth in the sector. The market cap of $CLSK is only $4.14 billion, making it a mid-cap company.
The company is led by a team of seasoned executives, including S. Matthew Schultz as the Executive Chairman and Zachary K. Bradford as the CEO and President, indicating a strong leadership foundation for its ambitious operations.
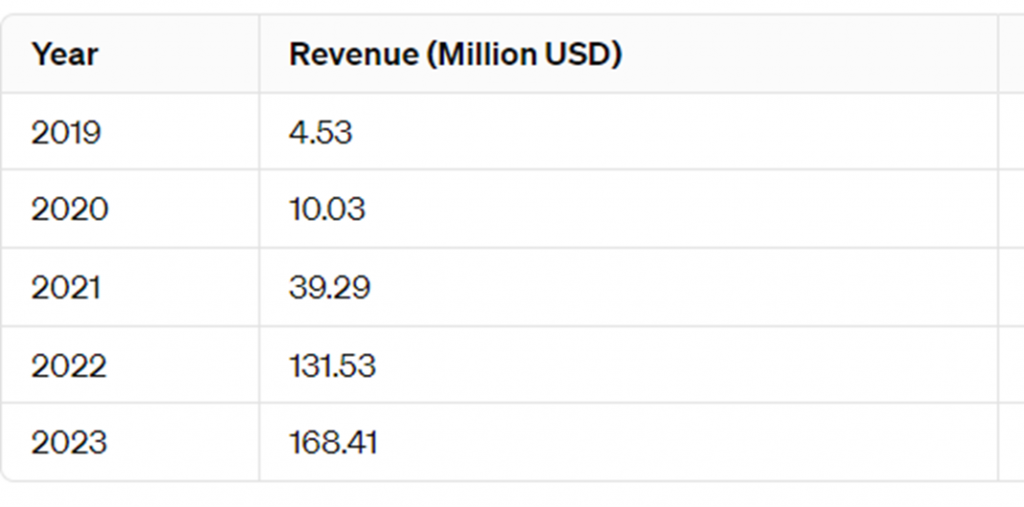
The revenue and earnings analysis of CleanSpark over the last five years reveals a company on a growth trajectory, albeit with the expected fluctuations inherent to the volatile bitcoin mining sector and renewable energy investments. The company’s focus on sustainability and innovative technology has positioned it uniquely in the market, offering a blend of environmental consciousness with the lucrative, albeit unpredictable, world of cryptocurrency. What is very clear is that the revenue growth of CleanSpark over the last 5 years has been exponential. The table below shows their revenue growing at a rate of 3,633% over this time frame.
It’s a simple but profound truth in the mining cosmos: these companies’ fortunes are tied to Bitcoin, with their revenues minted in the cryptocurrency itself while their costs are shackled to the steadfast dollar. When Bitcoin’s value soars, it’s like a financial bonanza, bolstering both the income statement and the balance sheet of these mining mavens. This is the kind of one-two punch that can turbocharge their valuations in the blink of an eye.
Now, as Bitcoin flexes its muscles yet again today, the market seems to be betting on this rally not just being a flash in the pan but a harbinger of more to come, setting the stage for a notable leap in CleanSpark’s stock price. Investors, with their gaze fixed on the horizon, are also weighing the impact of monumental events like the upcoming Bitcoin halving on April 20.
Here’s where it gets even more intriguing: come April, Bitcoin’s mining rewards will undergo a dramatic halving, effectively slicing miners’ revenues right down the middle.
Currently, 900 new bitcoins are mined daily. After the Bitcoin halving on April 20th, this amount will decrease to only 450 new bitcoins mined daily. This halving event is a significant part of Bitcoin’s monetary policy, designed to reduce the rate of new bitcoins entering circulation, thus enforcing its scarcity, and potentially influencing its value.
But here’s the kicker – with this increased mining difficulty comes a tightening of supply, potentially pushing prices to new heights, a scenario we’re already witnessing unfold. So, for companies like CleanSpark, the name of the game is navigating this new landscape where, if Bitcoin’s price ascent can outpace the rewards reduction, they might just find themselves not just surviving but thriving in this high-stakes environment.
In the last decade, CleanSpark’s strategic acquisitions have bolstered its market position, enhanced its technological capabilities, and expanded its operational footprint. These acquisitions underscore the company’s commitment to growth and innovation in sustainable bitcoin mining and energy management solutions.
In an astonishing revelation brought to us by bitcoinstrategyplatform.com, we’ve been afforded a glimpse into the sheer magnitude of capital inflow into Bitcoin, courtesy of the burgeoning sector of Bitcoin ETFs. It’s nothing short of staggering. On the ledger as of this past Tuesday, February 27th, these financial juggernauts have collectively scooped up an eye-watering 10,108 Bitcoins. Now, pause for a moment and digest this: our daily production of Bitcoin hovers around a mere 900. Over the course of just the last week, these ETFs have snapped up more than tenfold the daily mint of this digital gold. This, my friends, is the very engine driving Bitcoin’s price skyward.
We are witnessing a profound dislocation in the market—a seismic imbalance fueled by an insatiable buying frenzy, colliding with a painfully constrained supply.
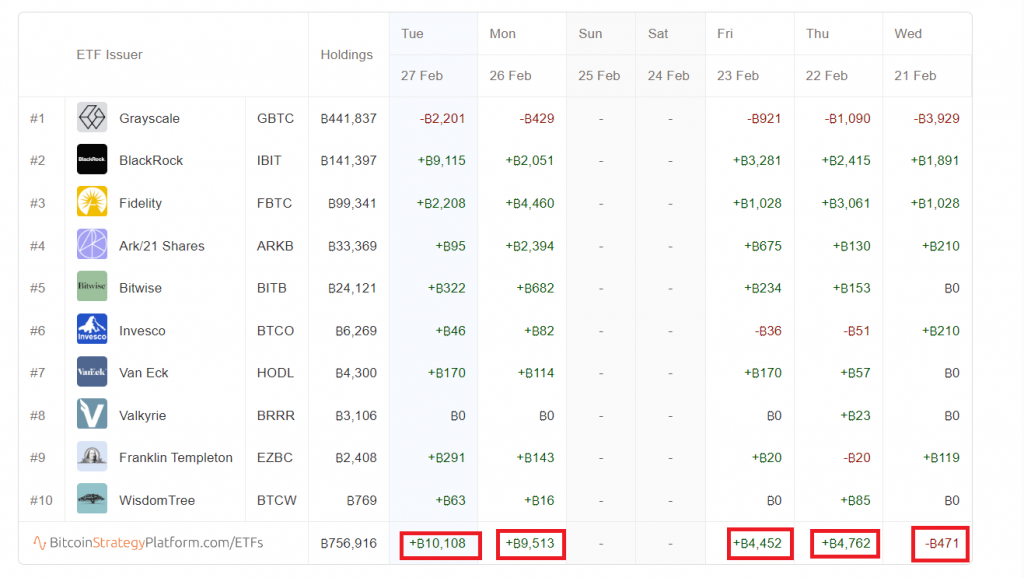
Source:bitcoinstrategyplatform.com
CleanSpark has amassed a war chest exceeding $200 million in liquid assets. This strategic move positions them on the cusp of an unparalleled buying spree, enabling them to acquire invaluable assets at a fraction of their worth. It’s this very capability that solidifies the conviction in CleanSpark’s destiny to ascend as the preeminent force in the global Bitcoin mining arena. They stand on the verge of an aggressive expansion, poised to significantly bolster their arsenal of mining rigs and data centers. This expansion is not merely growth for growth’s sake; it’s a calculated endeavor to substantially increase their Bitcoin mining output.
With their astute leveraging of capital, they’re not just aiming to participate in the market; they’re positioning themselves to redefine it. CleanSpark’s strategic maneuvers today lay the groundwork for their emergence as the titan of Bitcoin mining tomorrow. This is more than mere speculation; it’s a clear-eyed vision of a future where CleanSpark dominates the digital currency landscape.
Wall Street analysts have had varied views on CleanSpark, with opinions oscillating based on bitcoin market dynamics and the company’s operational efficiency. However, its focus on sustainability, coupled with an aggressive growth strategy through acquisitions and technological advancements, has made it a company to watch in the niche of environmentally conscious bitcoin mining.
Competing in a field that includes both traditional energy companies and emerging tech firms venturing into cryptocurrency, CleanSpark faces stiff competition. Yet, its dedication to low-carbon power usage and energy-efficient mining operations distinguishes it from many competitors, offering both an environmental edge and appealing to sustainability-conscious investors.
The biggest opportunity for CleanSpark lies in the growing demand for sustainable and renewable energy solutions, especially in sectors like cryptocurrency, which are increasingly under scrutiny for their environmental impact. Conversely, the risks include the volatility of the bitcoin market, regulatory changes, and the technological challenges associated with maintaining a competitive edge in energy efficiency.
CleanSpark’s product lineup, focusing on energy management and bitcoin mining, reflects a strategic alignment with global trends towards digital currencies and sustainable energy. The integration of these sectors is perhaps its most significant revenue generator, tapping into the lucrative intersection of technology, finance, and environmental sustainability.
In summary, CleanSpark represents a fascinating case study of innovation, sustainability, and adaptation in the rapidly evolving landscapes of cryptocurrency and renewable energy. With a solid foundation, strategic acquisitions, and a clear focus on sustainability, it is poised for future growth, albeit navigating the inherent risks and competition in its unique market niche. As always, investors and industry watchers will be keenly observing CleanSpark’s trajectory in the coming years, as it continues to innovate and expand its footprint in the sustainable technology and financial services sectors.
In this stock study we will look at the following metrics and indicators.
- Wall Street Analysts’ Estimates
- 52-week high and low boundaries
- Vantagepoint A.I. Predictive Blue Line
- The Best Case – Worst Case Scenarios
- Neural Network Forecast
- Daily Range Forecast
- Intermarket Analysis
- Our trading suggestion
We don’t base decisions on things like earnings or fundamental cash flow valuations. However, we do look at them to better understand the financial landscape that a company is operating under.
Wall Street Analysts’ Estimates
Based on 4 Wall Street analysts offering 12-month price targets for Cleanspark in the last 3 months. The average price target is $11.25 with a high forecast of $15.00 and a low forecast of $8.00.
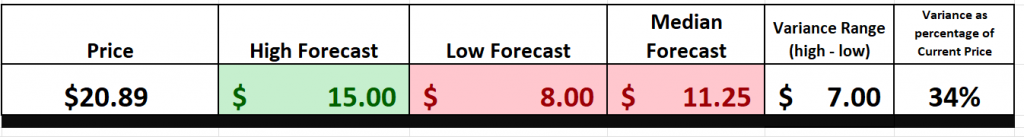
You can see that Wall Street analysts have been lagging the CleanSpark trend. I anticipate that they 3will dramatically revise their forecasts and estimates upwards when they comprehend the effect of the bitcoin halving on bitcoin miners.
We typically like to look at the variance between the most bullish and bearish forecasts and use that as a gauge for future expected volatility. Currently this variance is 34% or $7 which is very moderate.
We find this variance valuable as declines are often confined to this level of volatility.
52-Week High and Low Boundaries
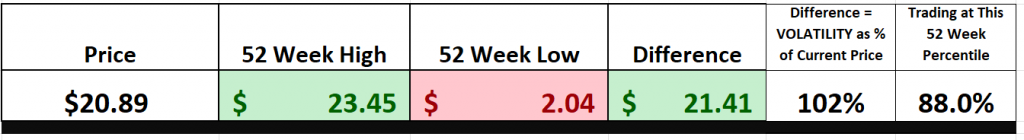
Over the past 52 weeks $WM has traded as high as $23.45 and as low as $2.04. The annual trading range was $21.41. These numbers provide us with an accurate perspective of historic volatility which we can calculate by comparing the annual trading range to the current price.
Over the last 52 weeks the historic volatility was 102% which is moderate in comparison to the broader stock market indexes. This value is extremely high and tells us the level of volatility that has been baked into the price action over the past year.
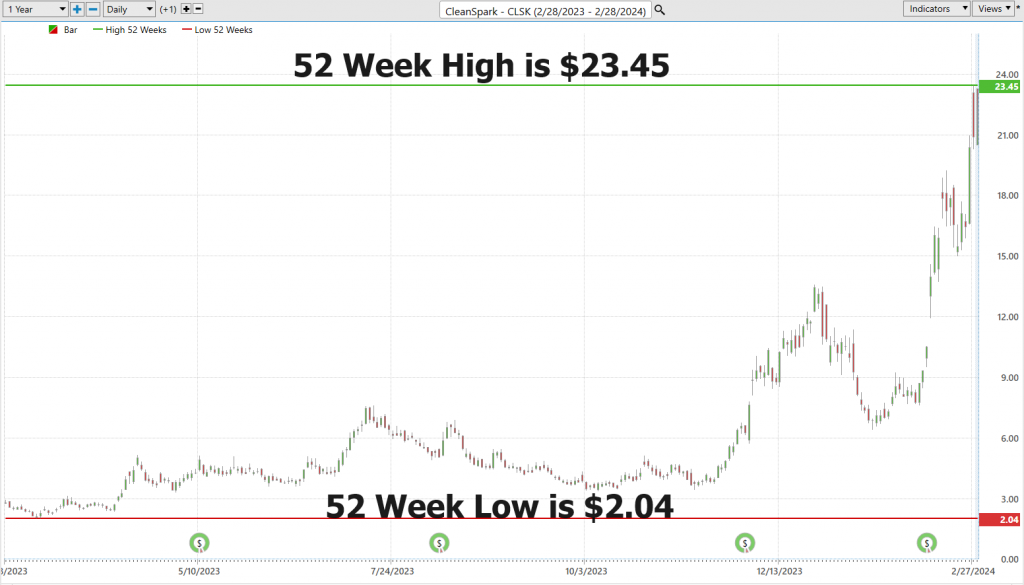
Understanding the significance of the 52-week high and low boundaries is crucial for any investor or trader considering entering the stock market. These metrics serve as a barometer for a stock’s performance over the past year, offering insights into its volatility, momentum, and potential resistance or support levels. The 52-week high signals bullish trends and investor optimism, indicating potential entry points for buyers. Conversely, the 52-week low may reveal bearish trends and investor nervousness, possibly signaling a cautionary tale for prospective investors.
These boundaries provide a historical context that helps investors gauge the stock’s relative strength or weakness over an extended period. Breaking above a 52-week high can suggest a stock’s upward momentum is likely to continue, attracting more buyers. On the other hand, falling below a 52-week low might indicate underlying issues or a lack of investor confidence, potentially leading to further declines. Therefore, these metrics are indispensable tools for building a robust investment strategy, guiding investors through the market’s inherent volatility.
In the trading world, anchoring our analysis in these foundational metrics proves indispensable, because it allows us to quickly see who is winning and who is losing. Or stated another way, what has been profitable and unprofitable over the past 52 weeks.
Such a metric isn’t merely a number; it’s a vital sign of the stock’s pulse, a testament to its resilience or vulnerability over an annual cycle. It highlights the stock’s momentum, charting its course through bullish highs and bearish lows.
As we pivot our attention to the broader canvas, extending our gaze on the 10-year chart, we observe a pattern of consolidation, a harbinger of the stock’s latent potential or its simmering constraints. This dual analysis—melding the immediacy of the 52-week markers with the longitudinal perspective of a ten-year trend—forges a comprehensive and pragmatic framework for evaluating CleanSpark’s prospects.
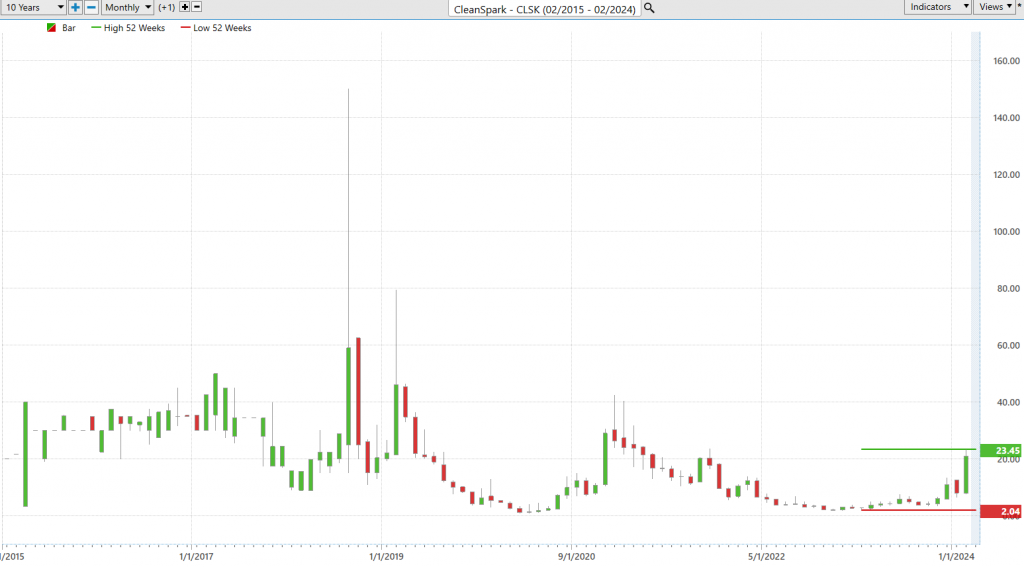
The variance in analyst estimates, juxtaposed with the stock’s historical volatility, serves not just as a gauge of future fluctuations but as a strategic compass guiding our investment thesis. From simply looking at the 10-year chart on $CLSK I see a very broad consolidation, which is not indicative of a long-term bullish trend. However, when a stock breaks out from a long consolidation the results can be staggering. Therefore, let’s dig deeper.
Best Case – Worst Case Scenario
So, imagine you’re thinking about putting some money into $CLSK. Before you jump in, there’s this super useful thing you should do called a best case/worst case analysis. Think of it as a way to predict the future of your money in both a sunny and stormy scenario.
**Why do this? ** Well, it’s all about not flying blind. You want to know the best thing that could happen (like how much money you could make) and the worst thing that could happen (how much you could lose). This way, you can decide if it’s worth the risk and how it fits with what you’re comfortable with.
**How to do it: ** You look back at how the price of what you want to trade has moved up and down over time. Find the highest points and the lowest points to get a thorough understanding of the asset’s volatility. Then simply connect the most recent highs to the most recent lows. This simple but practical exercise allows you to quickly understand the real-world implications of potential risk and reward.
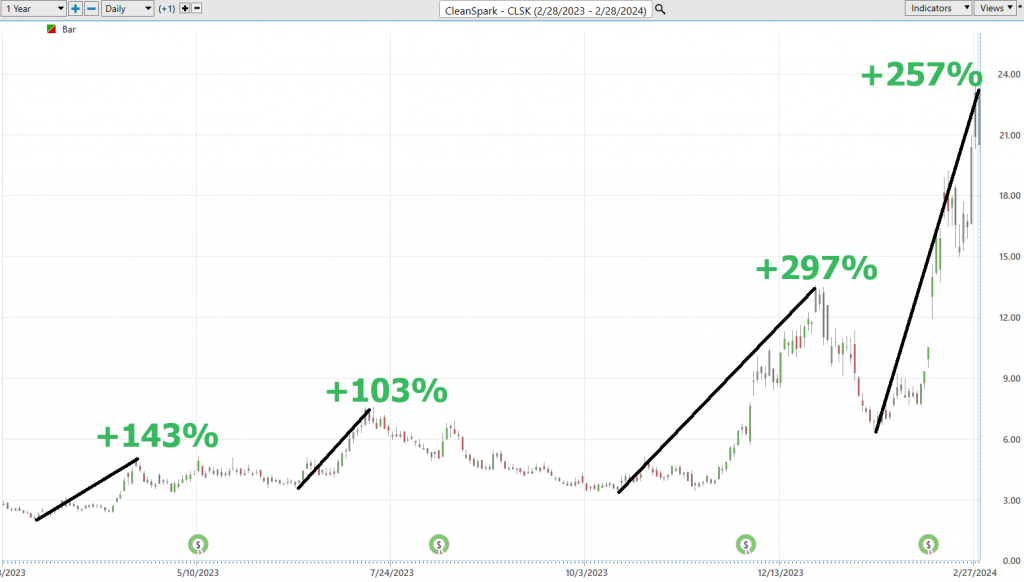
– **Best Case Scenario: ** Here, you’re connecting all the highest points to their most recent lows. This shows you the peaks of the ride and gives you an idea of how high it could possibly go again. You’re basically looking for the best outcome, using the past as your guide to dream big but realistically.
– **Worst Case Scenario: ** Now, do the opposite. Connect all the lowest points to their most recent highs to see how low the price has dipped. This helps you understand the scary parts of the ride and prepare for what could happen if things go south. Knowing the worst case helps you set up safety nets, like a stop-loss order, which is like telling your broker to sell your stock if it hits a certain low price, so you don’t lose too much.
Doing this isn’t just about drawing lines between highs and lows; it’s about getting a full picture of what you’re getting into. It helps you see the potential ups and downs based on real history, not just guesses. With this insight, you can step into the market more confidently, with a strategy that suits your goals and how much risk you’re okay with. This way, you’re never caught off guard, whether the market decides to throw a party or a tantrum.
So, before you decide to invest your hard-earned money, take a moment to do this analysis. It’s like scouting out the path ahead with a flashlight, making sure you’re ready for whatever lies in the shadows. This isn’t just about making smart moves; it’s about making moves that are right for you.
Here is the best-case analysis:
Followed by the worst-case analysis:
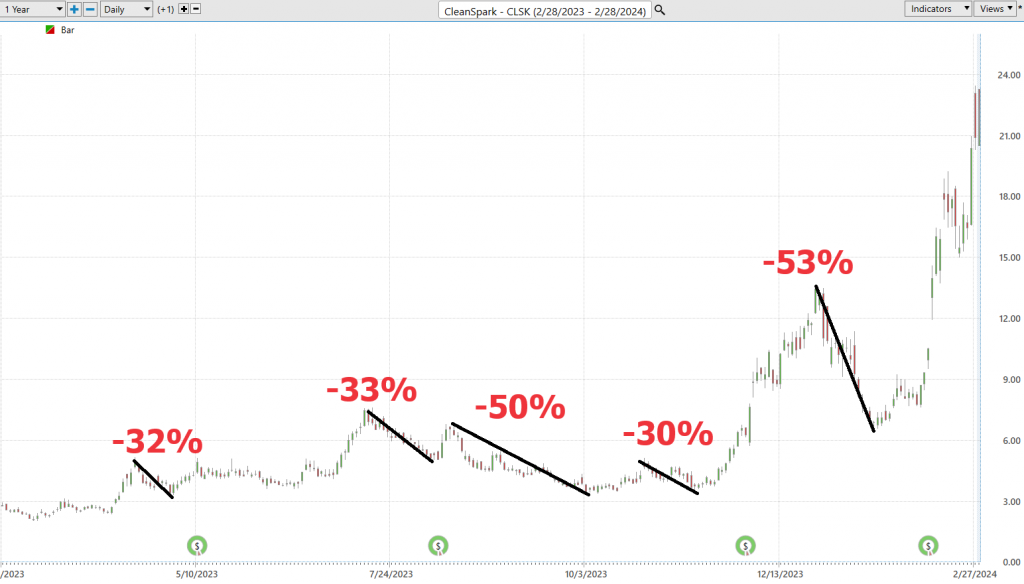
Viewed from this perspective we can immediately see the reward and risk of the past year for $CLSK.
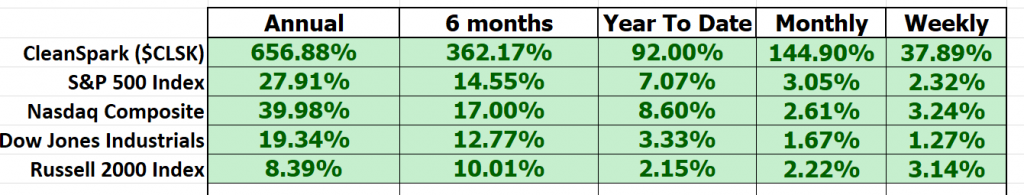
Next, we need to compare $CLSK to the broader stock market indices. By doing so we can immediately see that $CLSK has massively outperformed the broader market.
Last but not least we need to compare the volatility of $CLSK to the broader market. This is done by looking at BETA. Beta is a measure of a stock’s volatility in relation to the overall market. A beta of 1 indicates the stock tends to move in line with the market, while a beta greater than 1 suggests higher volatility, and a beta less than 1 implies lower volatility compared to the market.
Cleanspark ($CLSK), over the past 5 years, exhibits a beta of 3.81, indicating it is 283% more volatile than the broader market.
Over the last year the bulls are clearly in control and with the bitcoin halving approaching on April 20 $CLSK is in an enviable position as one of the most profitable bitcoin mining companies.
The VantagePoint A.I. Predictive Blue Line
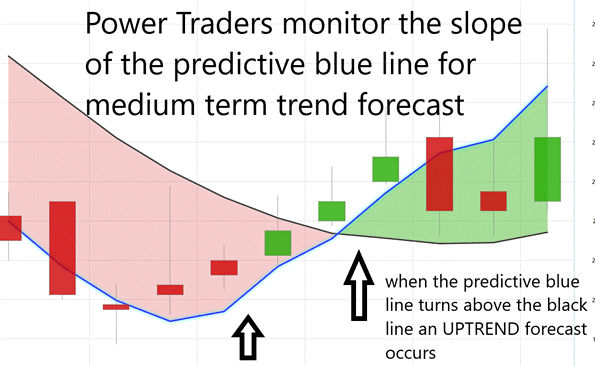
Savvy investors have a powerful tool at their disposal with VantagePoint Software, leveraging the cutting-edge artificial intelligence it employs to navigate the complexities of market trend forecasts. By focusing on the predictive blue line’s slope/trajectory, traders can gain a decisive advantage. This is in stark contrast to the traditional black line, which merely echoes past market activities through a basic 10-day simple moving average of price, offering limited forward-looking insight.
The predictive blue line emerges as a critical benchmark for value, guiding traders to make purchases at or below this line’s value during uptrends. It underscores the importance of understanding the dynamic interplay between the historical data represented by the black line and the forward-looking predictions of the blue line. Such insights are invaluable for those committed to making informed trading decisions.
VantagePoint’s proprietary technology, incorporating a Neural Network and Intermarket Analysis, stands at the forefront of this innovation. It assesses an asset’s future trajectory by examining its most influential price drivers through a sophisticated blend of artificial intelligence and statistical analysis. This methodology shines when the predictive blue line surpasses the black line, signaling an opportune moment for traders to enter the market on an upward trend, as denoted by UP arrows on the chart. Similarly, a downward movement of the blue line below the black line flags a prime opportunity for a downward trend entry.
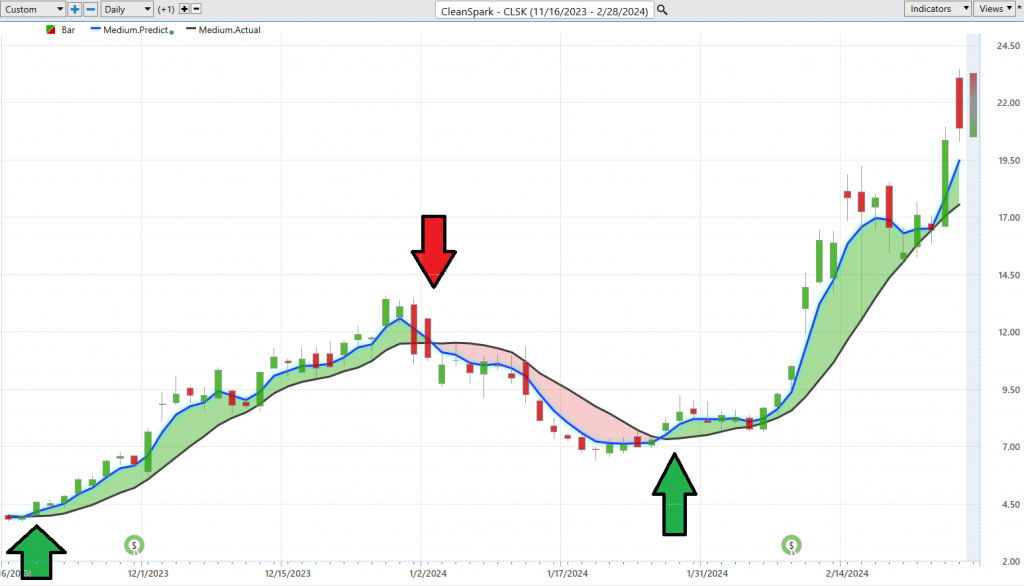
This approach eliminates guesswork, ensuring traders are consistently informed about both the prevailing trend and the value zone. By examining the performance of $CLSK stock over the past six months through this AI-enhanced lens, we can vividly demonstrate the transformative impact of artificial intelligence on real-time trading. Thus, for investors seeking to refine their market strategies with a blend of conservative wisdom and innovative analysis, VantagePoint Software offers an indispensable resource.
In the chart you see 3 clear trend forecasts. All of them were big winners as the ai offered wonderful guidance in defining the underlying trend each trading day.
Neural Network Indicator (Machine Learning)
Neural networks, particularly for traders, represent a cutting-edge artificial intelligence architecture inspired by the neurological structure of the human brain. These networks are composed of layers of nodes, or “neurons,” each layer designed to perform specific tasks. The neurons within these layers are interconnected, allowing for the flow and processing of data through the network. A neural network is constructed starting with an input layer, where data is fed into the network, followed by one or more hidden layers where the actual processing through weighted connections takes place, and finally, an output layer that delivers the conclusion or prediction.
For traders, neural networks can decipher complex market patterns and dynamics that might be invisible to the human eye. They process vast datasets, learning from historical trends and variables to predict future market movements with remarkable accuracy. This capability to evolve and improve over time with more data makes neural networks an invaluable tool for enhancing decision-making processes, minimizing risks, and identifying opportunities for profit.
At the heart of artificial intelligence in trading, the Neural Network stands as a testament to technological ingenuity, echoing the human brain’s complexity. It’s far from being a mere static entity; rather, it’s a dynamic and evolving system, adept at processing and learning from a vast array of data to refine its predictions. Herein lies the fusion of high-tech and financial acumen, offering traders a deepened insight into market behaviors and bolstering their decision-making prowess.
Envision a complex web where each node represents a neuron, all working together to analyze and learn from incoming data. This sophisticated system evolves, adapts, and hones its ability to forecast, presenting traders with critical insights into market trends and potential strategies for trading.
In the fast-paced world of trading, where timing is crucial for maximizing profits and minimizing losses, neural networks serve as a beacon of precision and foresight. They curtail human error, sharpen the accuracy of decisions, and maintain traders’ competitiveness in the ever-vigilant market environment.
Taking the example of CleanSpark ($CLSK), the integration of Vantagepoint’s A.I. Neural Index Indicator showcases how traders utilize this advanced technology for ‘double confirmation.’ They observe the predictive blue line’s trajectory, seeking validation through the Neural Net Indicator, creating a synergy between data analysis and prediction. This method, involving the Triple Cross and Neural Net signals, doesn’t just highlight opportunities; it underlines them as high-probability trading maneuvers.
The performance of CleanSpark ($CLSK) underlines the efficacy of these tools. The Neural Net Indicator, along with the Triple Cross, has consistently provided traders with moments of ‘double confirmation,’ marking the convergence of highly probable trading moments.
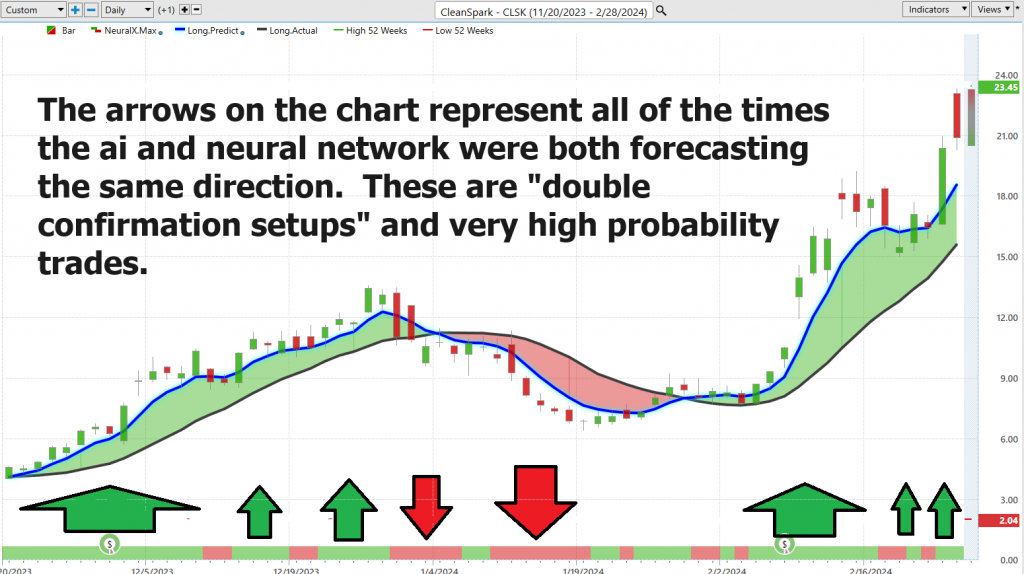
In these instances, where technological sophistication meets statistical probability, traders can leverage market trends, transforming data into decisive, actionable strategies.
Hence, the significance of neural networks for traders cannot be overstated. They represent the analytical edge, focusing on numbers and probabilities to unearth patterns beyond human detection.
So, why should you care about neural networks? Because they are the secret sauce for traders. They are all about numbers and probabilities, and they can spot patterns that we humans might overlook.
VantagePoint Software Daily Price Range Prediction
Let’s get straight to the point. In the arena of high-stakes trading, the essence of timing transcends everything else; it’s paramount. For those elite Power Traders, ever vigilant for the opportune moment to act, the Daily Range Forecast serves as their secret edge. Why does this matter so much? It boils down to executing flawless entry and exit strategies, particularly for traders who thrive on rapidly capitalizing on fleeting, lucrative opportunities.
Consider, for example, the stock of CleanSpark ($CLSK). Observe its average trading ranges across daily, weekly, and monthly intervals.
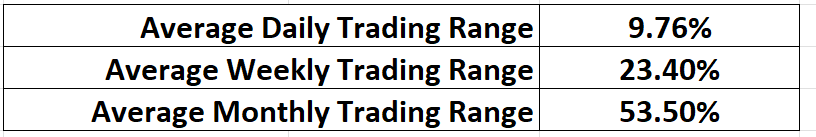
While these values are important the challenge for traders is determining how to apply them in real time.
However, the trick lies not just in understanding these ranges. The critical aspect is identifying those optimal moments for entry and exit.
Now, turn your attention to the Daily Range Forecast chart. This is no ordinary chart; it’s akin to a navigator for those engaged in short-term swing trading, offering a daily expectation of market movements.
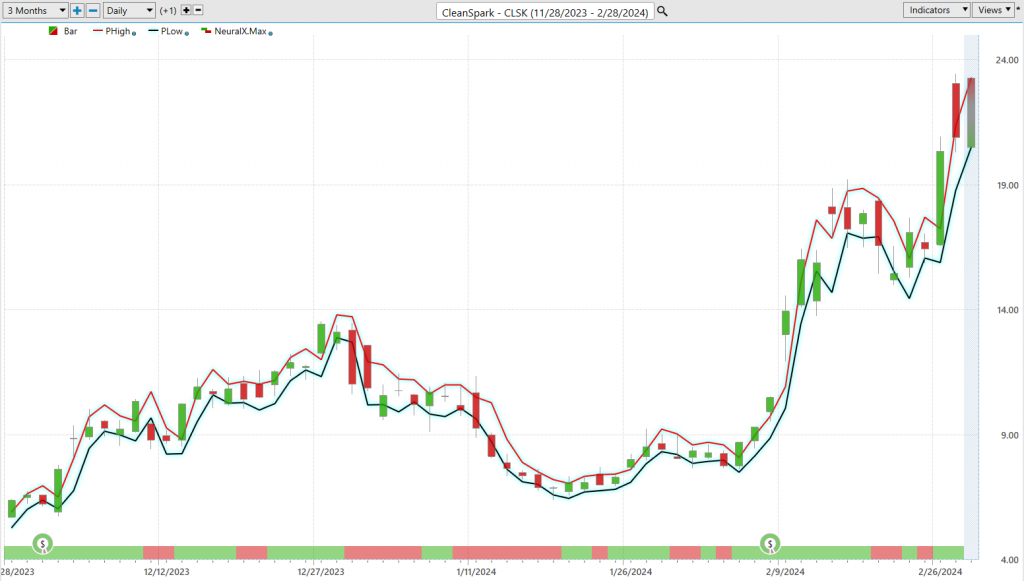
In the world of short-term swing trading, accuracy is imperative. This is precisely the role of Vantagepoint A.I.’s Daily Range Forecast. Equipped with artificial intelligence, machine learning, and neural networks, this tool does more than just analyze data; it forecasts the market’s rhythm for each trading day. Consider it your navigational beacon in trading, enabling Power Traders to masterfully navigate market fluctuations, identify prime entry points, and execute exits with unparalleled precision.
Intermarket Analysis
Intermarket analysis is a method of understanding and analyzing financial markets by examining the relationships between different asset classes. This approach is based on the principle that all markets are interconnected and that movements in one market can have direct or indirect effects on others.
VantagePoint Software cuts through all the noise to provide traders with a graphic which shows the 31 key drivers of an assets price. Its mastery in slicing through the complex web of Intermarket analysis, pinpointing those critical assets driving the heart of price movement, truly distinguishes it in the vast sea of market tools.
Peeling back the layers of chart analysis, we uncover the raw truths of support and resistance. Yet, it’s the intricate dance of global market forces that really piques our curiosity about the true determinants of price dynamics.
The essence of Intermarket analysis lies in its understanding that a ripple in one market pond can send waves crashing across the financial globe. It’s this intricate ballet of market interrelations that offers traders a lens to view the undercurrents connecting disparate assets, revealing how a surge in commodities or a dip in currency rates can send stocks on a wild ride.
Trailblazers like John Murphy and Louis Mendelsohn have charted the map of this terrain. Murphy’s seminal work, “Intermarket Technical Analysis,” serves as a beacon for traders navigating these waters, while Mendelsohn’s creation of VantagePoint Software, equips them with the compass to navigate.
Beneath the market’s surface, hidden correlations lie dormant, waiting to be unveiled. The dance of interest rates, the sway of crude oil prices, the flutter of dollar strength—these are but a few of the myriad forces molding the market’s fate, challenging companies to adapt or falter.
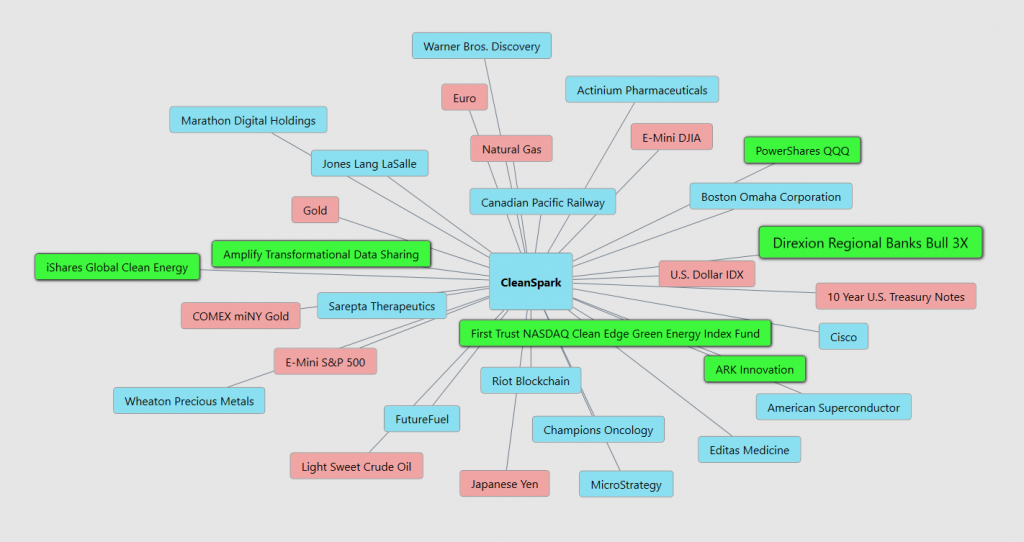
Armed with this treasure trove of insights, traders can chart a course through uncharted waters, spotting the ETFs aligning with $CLSK, and seizing a vanguard position in the market skirmish. This is not merely trading; it’s navigating the high seas of finance with the precision of a seasoned captain, eyes set on the horizon of opportunity.
In short, Intermarket Analysis helps traders be more like smart detectives, making better guesses by looking at the whole picture and not just one clue.
Our Suggestion
The next earnings call for $CLSK will occur on or around May 8, 2024. This is 3 weeks after the bitcoin halving.
One of our favorite trading setups is finding stocks that are trading at 52 week highs and then allowing the artificial intelligence to guide our decision making. $CLSK fits this framework. We will continue to rely upon the VantagePoint A.I. daily range forecast for guidance.
I hold a highly optimistic view on CleanSpark’s potential, envisioning them as a leading contender to dominate the global Bitcoin mining industry in the future. Should this vision materialize, I anticipate a significant positive impact on their stock valuation. This belief hinges on CleanSpark’s ability to consistently expand their revenue and profits. My confidence in the company and its leadership team is steadfast; I’m convinced they possess the strategy and execution prowess needed to ascend to the pinnacle of Bitcoin mining. However, I encourage you to conduct thorough research and make an informed decision.
$CLSK deserves to be on your trading radar. Use the daily range forecast for the relevant positioning opportunities.
We advise that you practice good money management on all of your trades and that you follow the A.I. forecast for your trend anaysis to determine optimal entries and exits.
Let’s Be Careful Out There!
Remember, It’s Not Magic.
It’s Machine Learning.
Disclaimer: THERE IS A HIGH DEGREE OF RISK INVOLVED IN TRADING. IT IS NOT PRUDENT OR ADVISABLE TO MAKE TRADING DECISIONS THAT ARE BEYOND YOUR FINANCIAL MEANS OR INVOLVE TRADING CAPITAL THAT YOU ARE NOT WILLING AND CAPABLE OF LOSING.
VANTAGEPOINT’S MARKETING CAMPAIGNS, OF ANY KIND, DO NOT CONSTITUTE TRADING ADVICE OR AN ENDORSEMENT OR RECOMMENDATION BY VANTAGEPOINT AI OR ANY ASSOCIATED AFFILIATES OF ANY TRADING METHODS, PROGRAMS, SYSTEMS OR ROUTINES. VANTAGEPOINT’S PERSONNEL ARE NOT LICENSED BROKERS OR ADVISORS AND DO NOT OFFER TRADING ADVICE.