


The A.I. stock spotlight this week is Chevron ($CVX)
Chevron began life in 1879 as Pacific Coast Oil, which is older than sliced bread and slightly more useful. It has survived Standard Oil’s breakup, two world wars, OPEC tantrums, and more energy crises than Hollywood has superhero reboots. Its mission has always been beautifully simple: find oil, pump oil, refine oil, sell oil, repeat. It bulked up through mergers, including the Texaco tie-up, and recently tried to swallow Hess for dessert. Today it’s one of the largest integrated energy companies on Earth, pumping millions of barrels a day, employing roughly 45,000 people, headquartered in Houston, and still very relevant because when oil sneezes, markets catch pneumonia.
Chevron is not an industrials company. It is an energy company. It drills holes in the ground and makes money come out. It also turns that money back into fuel, chemicals, lubricants, and shareholder dividends.
The business splits neatly into upstream and downstream, with a side of chemicals. Upstream is the treasure hunt. That is exploration and production. If oil prices are high, upstream prints cash. If oil prices collapse, upstream cries quietly in a dark room. Downstream is refining and marketing. It buys crude, turns it into gasoline, diesel, jet fuel, and sells it at stations with very bright lights and overpriced snacks. Chemicals, via its Chevron Phillips Chemical joint venture, turn hydrocarbons into plastics and industrial inputs.
The biggest revenue driver is crude oil production. Not branding. Not ESG reports. Barrels. The Permian Basin in Texas and New Mexico is a crown jewel. International assets in Kazakhstan and Australia matter too. When Brent and WTI move, Chevron’s stock pays attention like a dog hearing a treat bag crinkle.
Key customers are refiners, airlines, trucking fleets, industrial companies, and, indirectly, you every time you fill up your car. Leadership sits in Houston. The CEO is Mike Wirth, a steady operator who looks like he’d rather discuss free cash flow than attend Davos cocktail parties. Competitors include ExxonMobil, BP, Shell, and TotalEnergies. Chevron competes on scale, low production costs, and balance sheet strength. It is not the wildest driller in the shale patch. It is the adult in the room.
Financially, Chevron is a cash flow machine when oil cooperates. Chevron cranks out real money every single year, no excuses, no fairy dust. But look closer and you’ll see the roller coaster. Revenue rips from $155 billion to $235 billion, then slides back under $200 billion like oil prices just changed their mood.
Earnings tell the same story. Huge spike in 2022, then a steady comedown, yet still solidly profitable every year. Bottom line: they always make money, but both revenue and earnings swing hard with the energy cycle, and traders who ignore that volatility get blindsided.
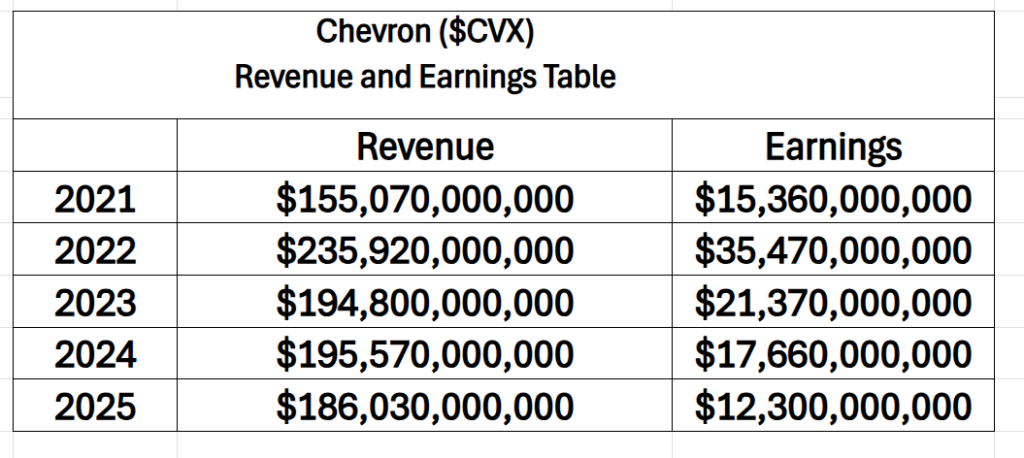
Revenue swings with commodity prices. In high oil environments, revenue surges. In downturns, it retreats. Margins in upstream can be glorious when crude is north of $70. Downstream margins are thinner and more cyclical, often expanding when crude falls because input costs drop faster than pump prices.
Chevron sits on a solid cash position and typically carries less relative debt than many global peers. Its balance sheet is one reason institutional investors sleep at night. Debt is meaningful but manageable. This is a capital-intensive business. Drilling wells, building LNG projects, maintaining refineries. None of this is done with pocket change.
What traders misunderstand is this: Chevron is not a straight line proxy for oil prices. It is a portfolio. Refining margins, production growth, share buybacks, dividend increases, and geopolitical risk all mix into the price. Sometimes oil rises and Chevron lags because refining margins are weak. Sometimes oil drifts and Chevron rallies because production volumes surprise to the upside.
Right now traders are asking a few big questions.
First, where are oil prices headed over the next six months. Not philosophically. Practically. If crude stays elevated due to supply constraints or geopolitical stress, Chevron’s cash flow stays robust.
Second, can Chevron keep growing production in the Permian without blowing up capital spending. Investors love growth. They hate surprise budget overruns.
Third, how safe is the dividend if oil rolls over. Chevron is considered a dividend aristocrat in energy clothing. Income funds care deeply.
Over the past 30 days, the biggest drivers have been crude price strength, OPEC production discipline, and headlines around supply risk. If global inventories tighten and Middle East tensions simmer, oil futures rise. When oil rises, energy stocks get religion. What is actually new is the resilience of crude prices despite concerns about global growth. Markets expected softer demand to crush prices. Instead, supply constraints and capital discipline from producers have kept the floor higher than many analysts predicted.
What Wall Street may be missing is how sensitive free cash flow is to even small moves in oil prices. A five-dollar swing in crude can materially change quarterly cash generation. If prices stay firm longer than models assume, estimates may creep higher.
Where expectations could be wrong is demand. If global growth slows sharply, especially in China, oil demand could soften faster than bulls expect. Energy stocks are beloved when things are tight. They are abandoned when recession fears spike.
Chevron’s stock has been up over the past 90 days largely because oil prices have been firm and refining margins have not collapsed. Production growth in the Permian has been steady. Investors have rotated into energy as a hedge against inflation and geopolitical uncertainty.
Year to date, the stock’s gains reflect two main narratives. One, energy remains underowned after years of ESG-driven neglect. Two, capital discipline means companies are not flooding the market with new supply. That combination keeps pricing power intact.
Compare Chevron to the Energy Select Sector ETF. Chevron often moves in line with the sector, but its relative strength improves when investors prefer integrated majors over smaller shale players. In volatile markets, big balance sheets win beauty contests. Analysts generally argue that Chevron’s disciplined capital allocation and low breakeven costs justify a premium multiple within energy. That is grounded in evidence. The company has historically avoided the boom-bust capital destruction that plagued the sector.
Where analysts have failed before is assuming oil will behave politely. Forecasts tend to cluster. When oil collapses, estimates are too high. When oil spikes, they are too low. The commodity is the boss.
Opportunities are straightforward.
If oil prices stay elevated or rise due to supply disruptions, Chevron’s earnings and free cash flow could surprise to the upside. If the Hess deal closes and Guyana production ramps smoothly, long-term growth expectations improve. Continued buybacks reduce share count and mechanically boost earnings per share.
The single biggest upside surprise would be a structural supply deficit that keeps oil above expectations for multiple quarters. That would turbocharge cash flow and force analysts to chase estimates higher.
Risks are equally blunt.
However, at this moment the Energy Sector has been the top performing sector for the last 3 months and candidates like $XOM, $COP, $TPL and $TNK are all having spectacular uptrends and massively outperforming.
A global recession that slams demand would push oil lower. Lower oil means lower cash flow. Regulatory pressure or unexpected production issues could hit volumes. Large projects always carry execution risk.
The single biggest blind spot traders should respect is complacency around demand. Energy stocks often look strongest right before economic data rolls over. When that happens, they can fall quickly.
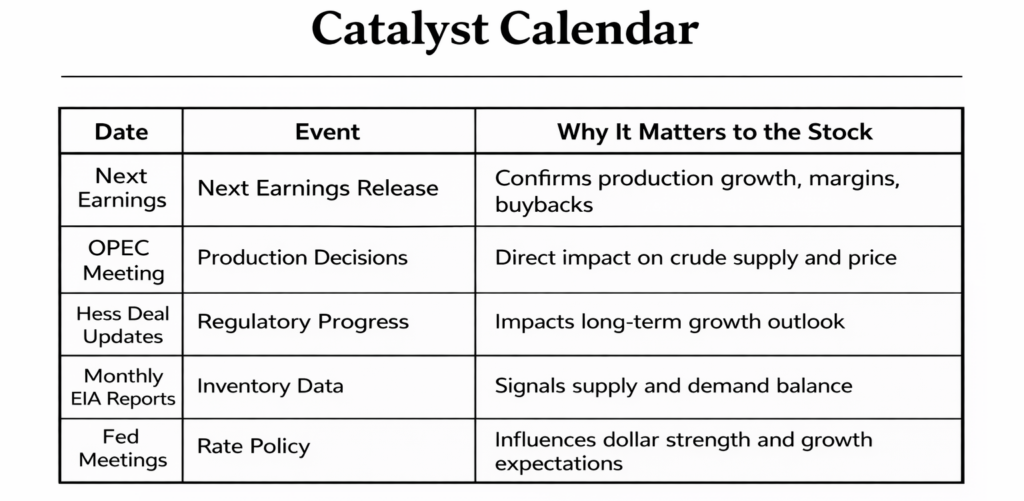
Here is the near-term catalyst calendar.
For traders, Chevron is best suited to those who understand that they are trading oil with a corporate wrapper around it.
It works for swing traders who watch crude futures and sector flows. It works for position traders who want exposure to energy with less balance sheet drama than smaller exploration names. It is not ideal for day traders looking for meme-stock fireworks.
For the trend to continue, three things must stay true. Oil prices need to remain firm. Production growth needs to meet or exceed guidance. Capital returns must remain consistent.
Trouble will signal itself early through falling crude prices, widening credit spreads, or a sharp breakdown in the broader energy sector relative to the S&P 500. If the sector ETF starts underperforming while oil weakens, pay attention.
Chevron is not exciting in the way that artificial intelligence or biotech moonshots are exciting. It is exciting in the way a well-maintained diesel engine is exciting. It runs. It produces. It pays you. Until it does not.
In markets, boring can be beautiful. But boring is still subject to gravity. Watch the barrels. Watch the balance sheet. And remember that when you buy Chevron, you are buying the global appetite for energy. That appetite can diet unexpectedly.
In this week’s stock study, we’ll break down the key indicators and metrics that guide our decision-making process, helping us determine whether to buy, sell, or stay on the sidelines for a particular stock.
- Wall Street Analysts Ratings and Forecasts
- 52 Week High and Low Boundaries
- Best-Case/Worst-Case Analysis
- Vantagepoint A.I. Predictive Blue Line
- Neural Network Forecast (Machine Learning)
- VantagePoint A.I. Daily Range Forecast
- Intermarket Analysis
- VantagePoint A.I. Seasonal Analysis
- Our Suggestion
While our final decisions are driven by artificial intelligence forecasts, we still take a quick look at the fundamentals to understand the financial environment in which $CVX is operating.
Wall Street Analysts Ratings and Forecasts
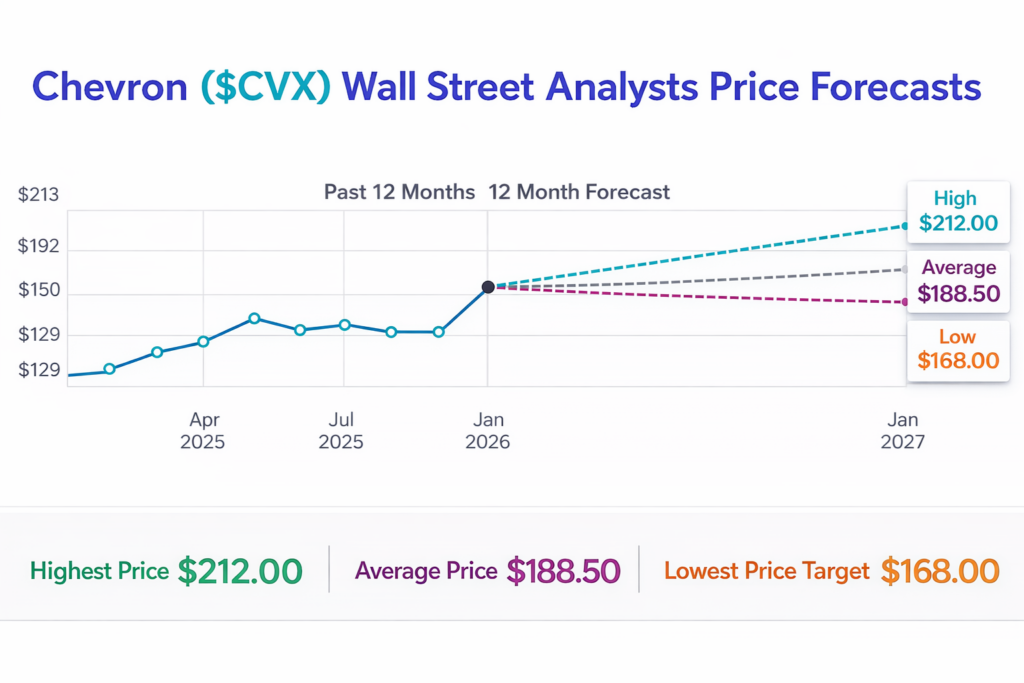
What you’re seeing is Wall Street’s best and brightest staring at the same Chevron balance sheet, the same oil charts, the same global economy, and coming to conclusions that are $44 apart.
The high target sits at $212.
The low target sits at $168.
That is a $44 spread.
These are not random bloggers in their basements. These are analysts who watch Chevron 24/7, build models thicker than a Manhattan phone book, and attend more conference calls than most people attend weddings. And yet here we are. A $44 disagreement.
With Chevron currently trading around $185, that $44 gap represents roughly 23.7% expected variance from the most optimistic to the most pessimistic outlook.
That is not small. It is not meme-stock insanity either.
It is a polite, institutional way of saying: “We think this thing could move.”
In practical terms, that spread is your forward volatility map. The bulls see oil staying firm, production humming, buybacks flowing, and the Hess deal aging like fine bourbon. The bears see softer demand, margin compression, and oil prices behaving like a toddler in a candy aisle.
A 23.7% range is not a panic signal. It is not a casino. But it is large enough to demand respect. If you are trading Chevron, you are not buying a sleepy utility. You are buying a macro instrument disguised as a dividend stock.
The key takeaway is not which target is “right.” It is that serious people disagree meaningfully about the path ahead.
That disagreement is opportunity.
And volatility, even the well-dressed institutional kind, is what pays traders.
52 Week High and Low Boundaries
This is where the story gets interesting.
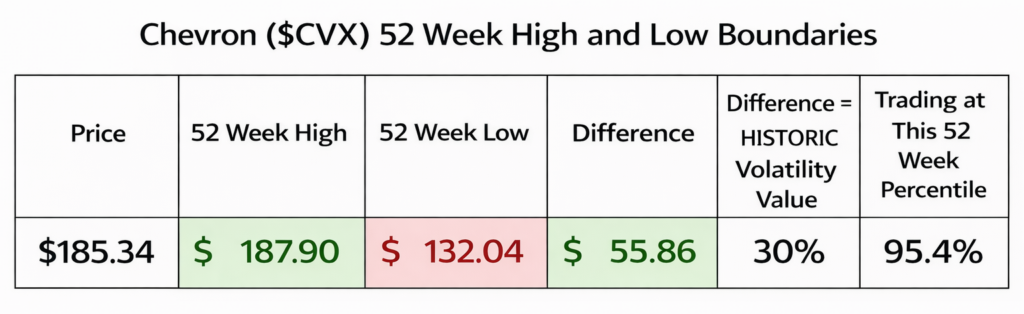
Over the last 52 weeks, Chevron has traded between $132.04 and $187.90. That is a $55.86 swing, which translates to roughly 30% historic volatility. Not imagined. Not forecasted. Not debated on CNBC. Lived. Experienced. Survived. And today, at $185.34, the stock is sitting in the 95th percentile of that entire range. In plain English, we are camped just a few dollars beneath the ceiling it has respected all year. This is not mid-range chop. This is altitude.
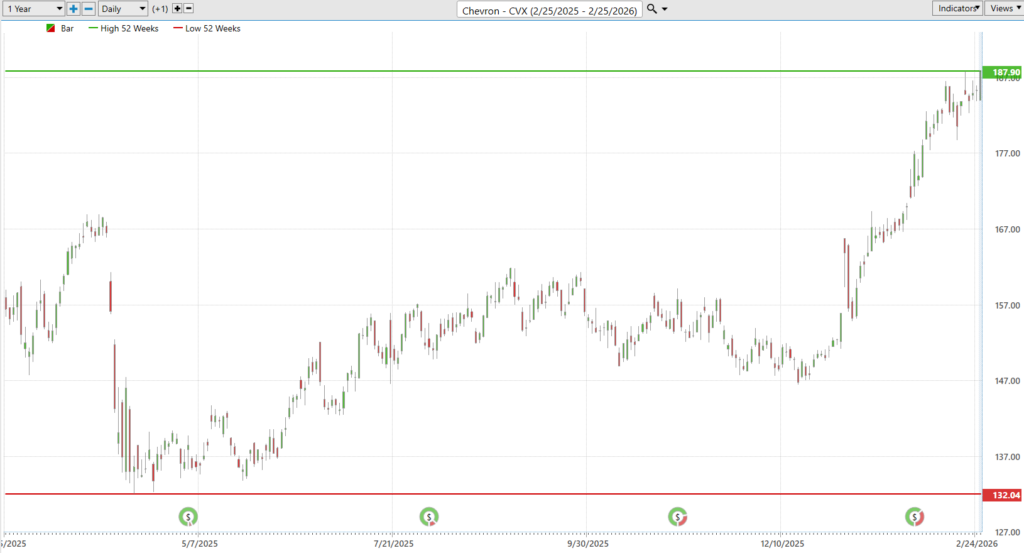
Now compare that to the analyst spread we discussed earlier. Wall Street’s sharpest minds are projecting a $44 difference between their high and low targets, implying about 23.7% forward variance. Notice the symmetry. Historically, Chevron has already demonstrated it can swing 30%. Analysts are pricing in slightly less, about 24%, going forward. Similar magnitude. Different perspective. One is backward-looking reality. The other is forward-looking expectation. The market has already proven it can move wider than the current forecast dispersion. That tension matters. Because when a stock is trading at the 95th percentile of its 52-week range while analysts are calmly modeling 20-plus percent volatility ahead, what they are really saying is this: movement is normal here. The only question is direction.
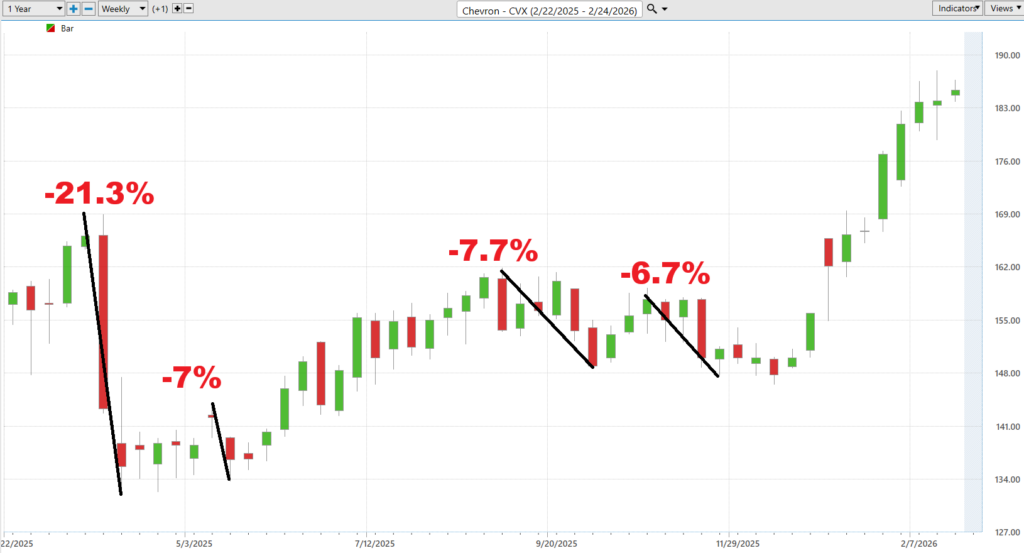
Best-Case/Worst-Case Scenario Analysis
Volatility is often discussed as though it were an abstraction, a statistical output buried in a spreadsheet. But over the past year, Chevron has demonstrated that volatility is neither theoretical nor polite. The largest uninterrupted decline was 21.3%, with additional directional pullbacks in the 6% to 8% range occurring with notable regularity. When set beside the roughly 30% 52-week high-to-low range and the current analyst forecast dispersion in the low-to-mid 20% range, the relationship becomes clear. The market has already experienced downside moves comparable to, and at times exceeding, what Wall Street is projecting forward. In other words, the modeled risk is not hypothetical. It has precedent.
On the other side of the ledger, the largest uninterrupted rally climbed more than 28%, accompanied by several secondary advances in the 7% to 20% range. The symmetry is striking. The same stock that can shed one-fifth of its value in a concentrated stretch can just as readily advance by a similar magnitude. This alignment between historic movement and forecast dispersion suggests that analysts are not expecting chaos, but they are pricing in meaningful motion. The forward-looking volatility implied in their targets reflects the lived behavior of the stock. The difference is that one is backward-looking data, and the other is forward-looking expectation.
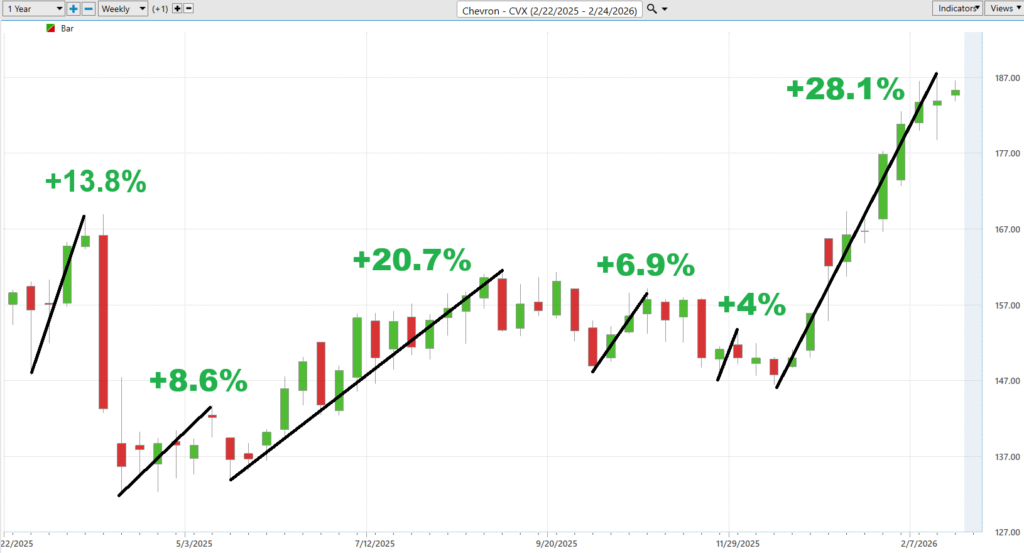
For traders, the lesson is less about potential upside and more about tolerable downside. Professional risk management begins not with optimism but with realism. Before initiating a position, the more relevant question is not how much could be made if the thesis proves correct, but how much could be lost if it does not. If an uninterrupted decline of 20% is within one’s risk tolerance, the position can be sized accordingly. If it is not, discipline demands restraint. Capital preservation is not glamorous, but it is foundational. Over time, survival compounds. And without survival, opportunity is irrelevant.
Next, we compare the performance of $CVX to the broader stock market average.
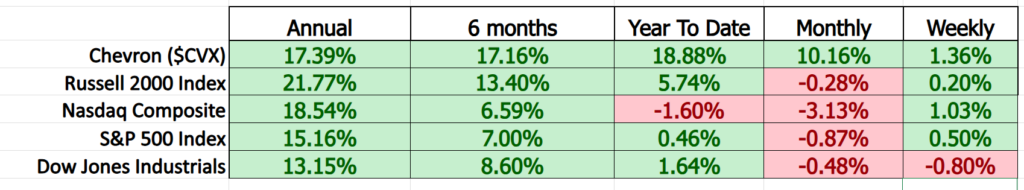
At 10,000 feet, this scoreboard is not subtle.
Chevron is winning.
Not by a whisper. Not by accounting trickery. By performance.
Year to date, Chevron is up 18.88%. The S&P 500 is barely positive. The Nasdaq is negative. The Russell 2000 is positive but meaningfully behind. The Dow is crawling. On a monthly basis, Chevron is green while most of the major averages are red. On a six-month basis, it is leading nearly every benchmark except the Russell’s strong annual number. This is not noise. This is relative strength.
Leadership in markets has a specific look. It outperforms across multiple time frames. It does not rely on one lucky quarter. It shows strength when others hesitate. Chevron is doing exactly that. When the Nasdaq stumbles, Chevron advances. When the S&P drifts sideways, Chevron compounds. That is what institutional accumulation looks like. It rarely announces itself with fireworks. It simply outperforms persistently.
Most traders miss this because they stare at price charts in isolation. They see a stock near its highs and assume it is “extended.” What they fail to ask is extended relative to what? If the broader market is flat or negative and Chevron is printing double-digit gains, that is not exhaustion. That is money rotating. Relative strength is capital voting with size. Based on this scoreboard, money is not flowing out of Chevron. It is flowing toward it.
You do not need to overcomplicate it. The stock is outperforming the major averages across key time frames. That is the definition of winning. And in markets, money tends to continue flowing toward winners until something changes the narrative.
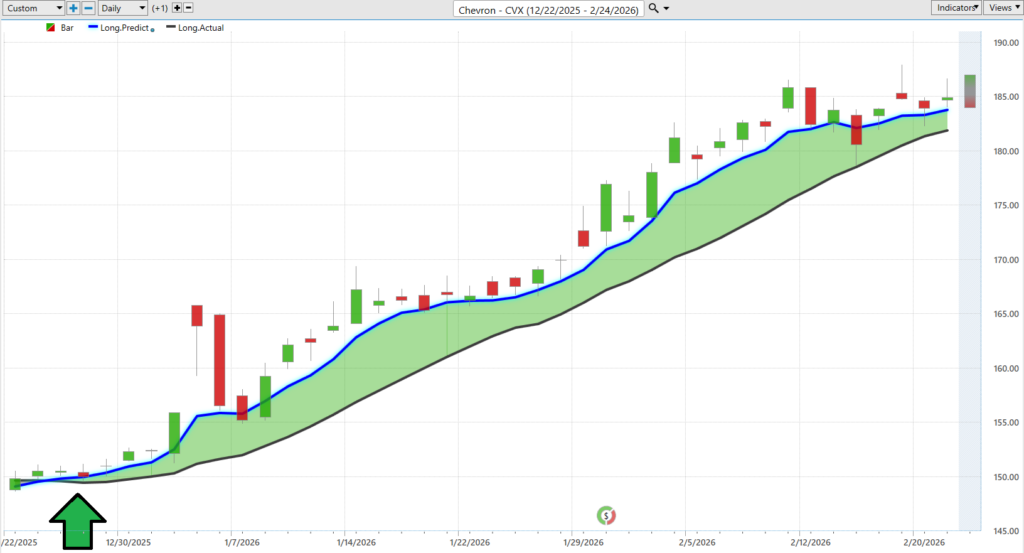
VantagePoint A.I. Predictive Blue Line
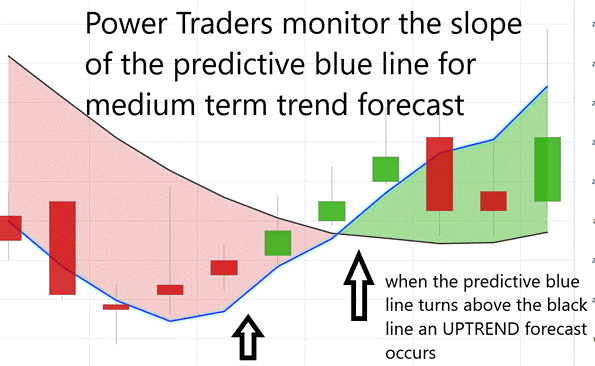
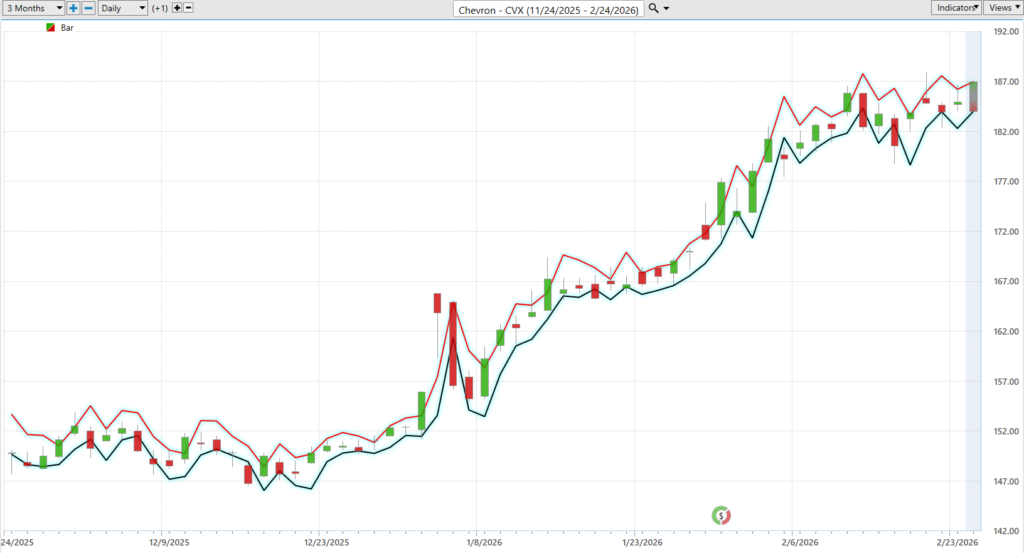
The distinction here is subtle but consequential. The black line, a traditional 10-day moving average, tells us where prices have been. It is descriptive. It reacts to what has already occurred. The blue line, by contrast, is predictive in nature. It attempts to anticipate where prices are likely headed. Now, that predictive blue line is sloping upward with consistency. When its trajectory is rising, the expectation is for higher prices. When it begins to flatten or turn lower, expectations shift accordingly. The slope is not cosmetic. It is the signal.
Equally important is the relationship between the two lines. The predictive blue line is positioned above the black moving average, and both are trending higher. That alignment reflects a market in constructive formation. The model is leading, and the lagging average is confirming. If the blue line were to roll over while the black line continues climbing, that divergence would serve as an early warning that momentum is changing beneath the surface. The predictive component, by design, tends to adjust before the traditional average reacts.
Finally, there is the matter of gravitation. Price has a demonstrated tendency to migrate back toward the predictive blue line when the slope changes. If prices extend too far above a rising blue line, consolidation often follows. If prices dip below it while the slope remains positive, recoveries frequently emerge. The black line documents history. The blue line frames probability. For traders, the distinction between reacting to what has happened and anticipating what may happen next is not academic. It is the difference between following the market and preparing for it.
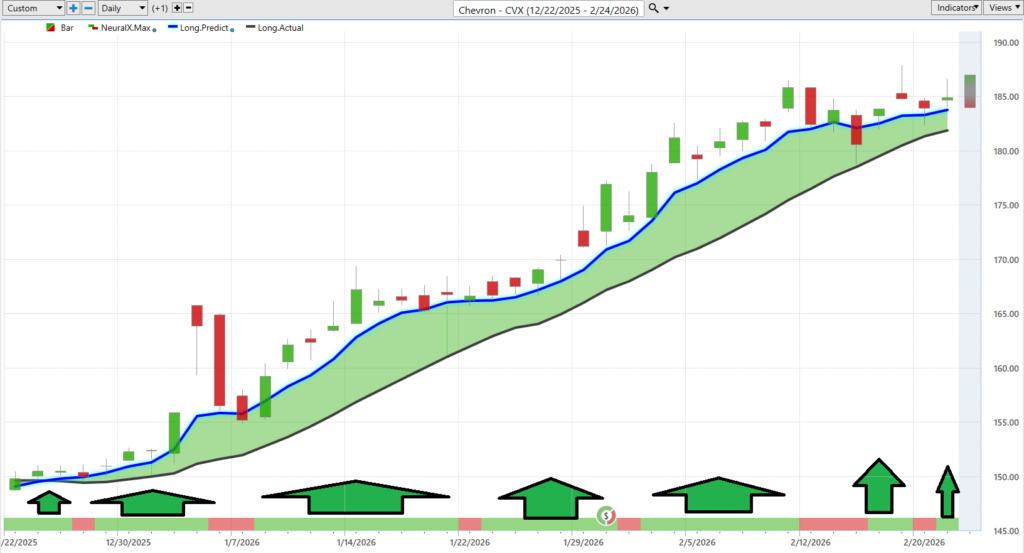
VantagePoint A.I. Neural Index (Machine Learning)
A neural index is a market model built using a neural network, which is a type of artificial intelligence designed to recognize patterns. Think of it like the software used in self-driving cars or medical imaging. Those systems study thousands of past examples to learn what tends to happen next. In trading, the neural network studies historical price data and intermarket relationships to estimate the probability of price direction over the next 48 to 72 hours. It does not react to what just happened. It attempts to anticipate what is likely to happen next.
Neural networks in financial markets were created because traditional indicators only describe the past. A moving average tells you where price has been. A neural network evaluates multiple inputs at once, including price trends, momentum shifts, intermarket correlations, volatility behavior, and other proprietary data relationships. It processes those variables simultaneously and builds a probabilistic model. The objective is not certainty. The objective is to tilt probability in favor of the prevailing direction before the move becomes obvious.
In the VantagePoint A.I. model, the Neural Index signal appears at the bottom of the chart. Green signals an expectation of rising prices over the next 48 to 72 hours. Red signals an expectation of falling prices. In this chart, the Neural Index has largely remained green during the broader advance, aligning with the upward slope of the Predictive Blue Line. That alignment is significant. When both the predictive blue line and the Neural Index are forecasting the same direction, it reflects confirmation between short-term probability and intermediate trend expectation.
Many VantagePoint traders look specifically for that alignment. When the predictive blue line is rising and the Neural Index is green, the model suggests upward price bias. When the predictive blue line turns lower and the Neural Index flips red, the bias shifts. The Neural Index does not guarantee outcome. It provides a forward-looking probability framework. In this case, the visual evidence shows that the majority of recent Neural Index signals have supported the prevailing upward price movement.
VantagePoint A.I. Daily Range Forecast
What traders need every single day is not a headline. They need a map. The Daily Range Forecast provides that map by defining the expected high and low for each session. On the chart, the channel created by the upper and lower boundaries outlines where price is statistically expected to travel during the day. That channel is not random. It frames opportunity at the upper boundary and defines risk at the lower boundary. Instead of guessing where exhaustion might occur, traders can see the projected range before the session unfolds.
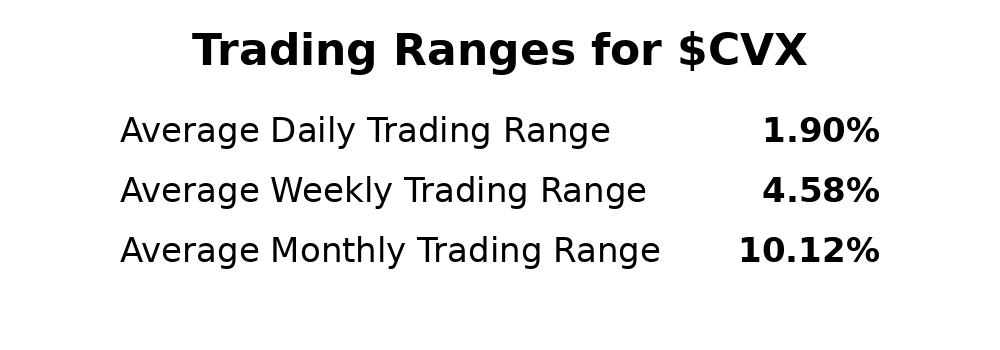
he channel also makes the prevailing trend unmistakable. As price advances, both the upper and lower range boundaries are stair-stepping higher. That structure confirms directional strength. Rather than chasing price after an extended move, traders can look for pullbacks toward the lower boundary within an established uptrend. That is how professionals position within momentum rather than react emotionally to it. The forecasted range allows entries and exits to be planned, not improvised.
The trading range metrics reinforce this framework. The average daily range is approximately 1.90%, the weekly range 4.58%, and the monthly range 10.12%. Those statistics tell us how far price typically moves. But knowing historical averages is not enough. The key question is how to position forward. The Daily Range Forecast answers that by translating volatility into actionable boundaries. This is how volatility is harnessed objectively. Risk is defined in advance, opportunity is quantified, and emotional decision-making is replaced with structure and discipline.
Intermarket Analysis
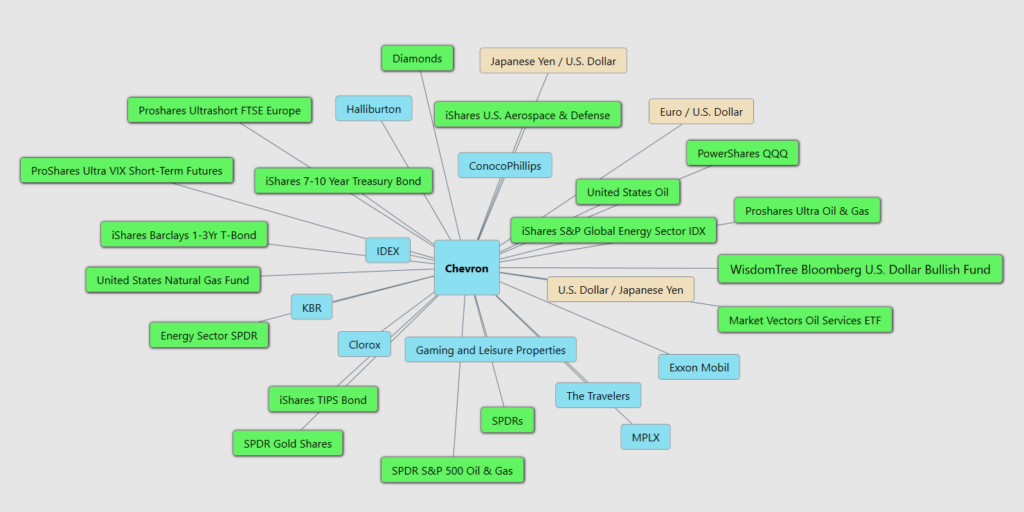
Intermarket analysis is the study of how one asset moves in relation to many others. Think of it like a supply chain map in manufacturing or a patient chart in medicine. A factory does not operate in isolation. It depends on raw materials, transportation, labor costs, and global demand. A doctor does not look at one symptom. They review blood work, heart rate, imaging, and history. Intermarket analysis applies that same systems-based thinking to markets. Chevron operates in the Energy sector, specifically integrated oil and gas. Its price does not move alone. It is connected to commodities, currencies, bonds, sector ETFs, and peer companies. The web in this graphic visually represents that ecosystem.
From a macro perspective, the traditional drivers of integrated energy companies are crude oil prices, natural gas prices, refining margins, the U.S. dollar, Treasury yields, and broader energy sector flows. The graphic confirms these relationships. United States Oil, the iShares S&P Global Energy Index, the Energy Sector SPDR, and oil services ETFs sit directly connected to Chevron. Currency pairs such as the U.S. Dollar / Japanese Yen and Euro / U.S. Dollar are included because energy is priced globally in dollars. When the dollar strengthens, commodity pricing dynamics shift. Treasury instruments and TIPS appear because interest rates influence capital flows, inflation expectations, and discount rates. Peers like Exxon Mobil and ConocoPhillips reinforce that Chevron trades within a competitive industry structure, not in isolation.
Intermarket analysis answers a question traders often ignore. Is this move supported by the larger financial ecosystem? When crude oil, energy ETFs, oil services, and related equities move in the same direction, capital is rotating into the sector broadly. When currencies, bonds, and commodities align, that agreement tends to strengthen trends. If Chevron rises while crude oil, energy ETFs, and oil services lag, that divergence suggests weaker confirmation. Trends supported across asset classes tend to persist. Trends lacking confirmation often weaken. The purpose of this framework is not prediction in isolation. It is confirmation through capital flow alignment.
At a 10,000-foot view, the key drivers for Chevron remain energy commodity pricing, sector-wide ETF flows, global currency dynamics, and interest rate conditions. These forces affect revenue expectations, cost structures, and investor appetite for cyclical assets. Intermarket analysis makes those relationships visible. It reframes the central question as a capital flow problem. Where is the money going? If capital flows into energy broadly, Chevron’s moves are ecosystem-supported. If money rotates away from commodities and into defensive bonds or non-cyclical sectors, pressure increases. Everything begins with understanding the ecosystem. Price is simply the final output.
Our Suggestion
Chevron’s last two earnings calls show management largely hitting its stated production and capital discipline targets. Output in the Permian and other key regions has remained stable to modestly higher, and leadership continues to emphasize cost control, free cash flow, and shareholder returns through dividends and buybacks. Their tone has been steady and confident, not promotional. The biggest concern expressed has been commodity price volatility and global demand uncertainty. In simple terms, they are running the business efficiently, but they cannot control oil prices.
The next earnings call is expected in late April 2026. Wall Street is looking for continued profitability with stable cash flow, not explosive growth. Expectations are moderate. This matters because we already know that analysts disagree by roughly 24% between the highest and lowest price targets. We also know that Chevron’s 52-week range has been closer to 30%. That tells us volatility is normal here. The opportunity exists because price moves. The risk exists for the same reason.
Near term catalysts include earnings guidance, capital spending updates, commentary on oil prices, and broader sector flows. Energy stocks often move together when crude oil, the dollar, and sector ETFs align. If those drivers confirm strength, trends tend to persist. If they weaken, reversals can come faster than expected. Intermarket alignment will be key.
For traders, the lesson is simple. Respect volatility and manage position size accordingly. Do not fall in love with the ticker. Use disciplined money management and tools like the VantagePoint Daily Range Forecast to define daily risk and opportunity. When you know where the expected high and low live, you stop reacting emotionally and start operating with structure. In a stock that regularly moves 20% to 30% within a year, discipline is not optional. It is survival.
Let’s Be Careful Out There.
It’s not magic.
It’s machine learning.
Disclaimer: THERE IS A HIGH DEGREE OF RISK INVOLVED IN TRADING. IT IS NOT PRUDENT OR ADVISABLE TO MAKE TRADING DECISIONS THAT ARE BEYOND YOUR FINANCIAL MEANS OR INVOLVE TRADING CAPITAL THAT YOU ARE NOT WILLING AND CAPABLE OF LOSING.
VANTAGEPOINT’S MARKETING CAMPAIGNS, OF ANY KIND, DO NOT CONSTITUTE TRADING ADVICE OR AN ENDORSEMENT OR RECOMMENDATION BY VANTAGEPOINT AI OR ANY ASSOCIATED AFFILIATES OF ANY TRADING METHODS, PROGRAMS, SYSTEMS OR ROUTINES. VANTAGEPOINT’S PERSONNEL ARE NOT LICENSED BROKERS OR ADVISORS AND DO NOT OFFER TRADING ADVICE.


