


This week’s stock analysis HF Sinclair ($DINO)
HollyFrontier Corp. is an independent petroleum refiner and marketer. It specializes in gasoline, diesel fuel, jet fuel, and modified asphalt. The company was founded in 1947 and is headquartered in Dallas, TX.
The very first thing you will notice about $DINO is that it is a counter-cyclical stock. This means that it moves inversely to the broader stock market. A key question to ask when the broader stock market indexes are down is: “who is winning?” When we ask that question the answer unmistakably is the oil and gas sector is performing very well in comparison to the broader stock market indexes. Trading stocks that are highly correlated to Crude Oil is where a great deal of the profits on the long side have been.
In this weekly stock study, we will look at and analyze the following indicators and metrics as are our guidelines which dictate our behavior in deciding whether to buy, sell, or stand aside on a particular stock.
- Wall Street Analysts’ Estimates
- 52-week High and Low Boundaries
- The Best Case and Worst-Case Scenarios Over the Last Year
- Vantagepoint A.I. Forecast (Predictive Blue Line)
- Neural Network Forecast
- Daily Range Forecast
- Intermarket Analysis
- Our Trading Suggestion
We don’t base decisions on things like earnings or fundamental cash flow valuations. However, we do look at them to better understand the financial landscape that a company is operating under.
Analysts’ Ratings
Based on 10 Best Performing Wall Street analysts offering 12-month price targets for HF Sinclair Corporation in the last 3 months. The average price target is $51.80 with a high forecast of $62.00 and a low forecast of $38.00. The average price target represents a -8.77% change from the last price of $56.78.
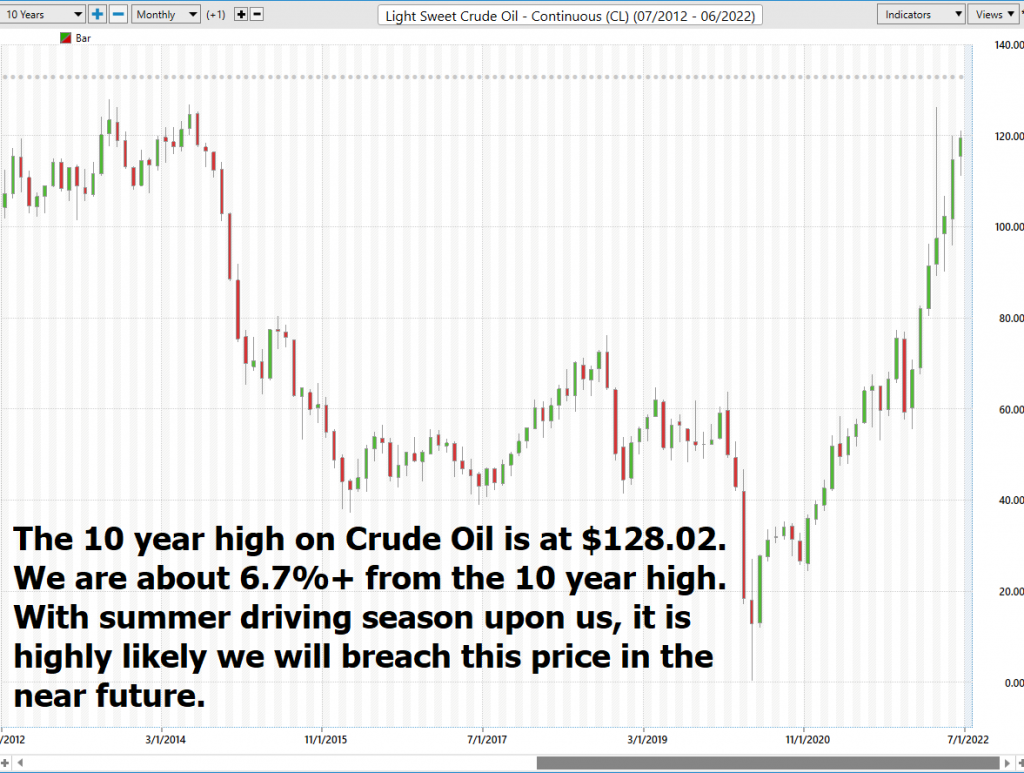
These estimates are quite large in their divergence. The difference between the low estimate of $38 and the high estimate of $62 is $24 which represents 46% of the current stock price. Wall Street Analysts have been revising their estimate upward and we expect them to continue to do so. Particularly is we see Crude Oil prices breach the 10 year high at $128.02.
Whenever we see Wall Street estimates this divergence it is a sign that we should expect increased volatility in the asset.
We love to see this heavily divergent opinion as it tells us that volatility is baked into the mix.
52-Week High and Low Boundaries
Over the past year we have seen $DINO trade as low as $27.16 and as high as $56.85. This tells us that the annual trading range is $29.69.
When we divide the annual trading range by 52 weeks, we come up with an expected weekly trading range of .57.
We also like to divide the annual trading range of $29.69 by the current price of $56.85 to get a broad-based estimate of trading volatility. This tells us that the volatility of $DINO over the past year has been 52.5%. This value also provides us a basic estimate in letting us know that if the future is like the recent past, it would be normal for $DINO to trade in a range that is 52%% higher and lower from the current price over the next year.
Based upon this volatility estimate it would be statistically normal to see $DINO trade as high as $86.17 and as low as $26.81 over the next 52 weeks.
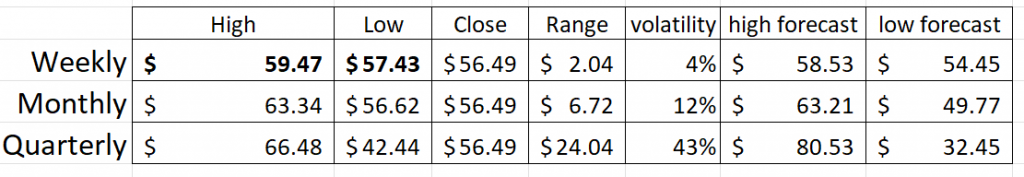
Using this same logic here are the volatility boundaries for the next week, month, and quarter. In the following table we’re simply taking the range for the period indicated and adding and subtracting it from the most recent close.
Here is the annual 52-week chart of $DINO so that you can see the powerful price journey it has taken over the last few months.
Power Traders will compare the Wall Street Analysts estimates with these broad volatility estimates to get a broad sense of price action in $DINO.
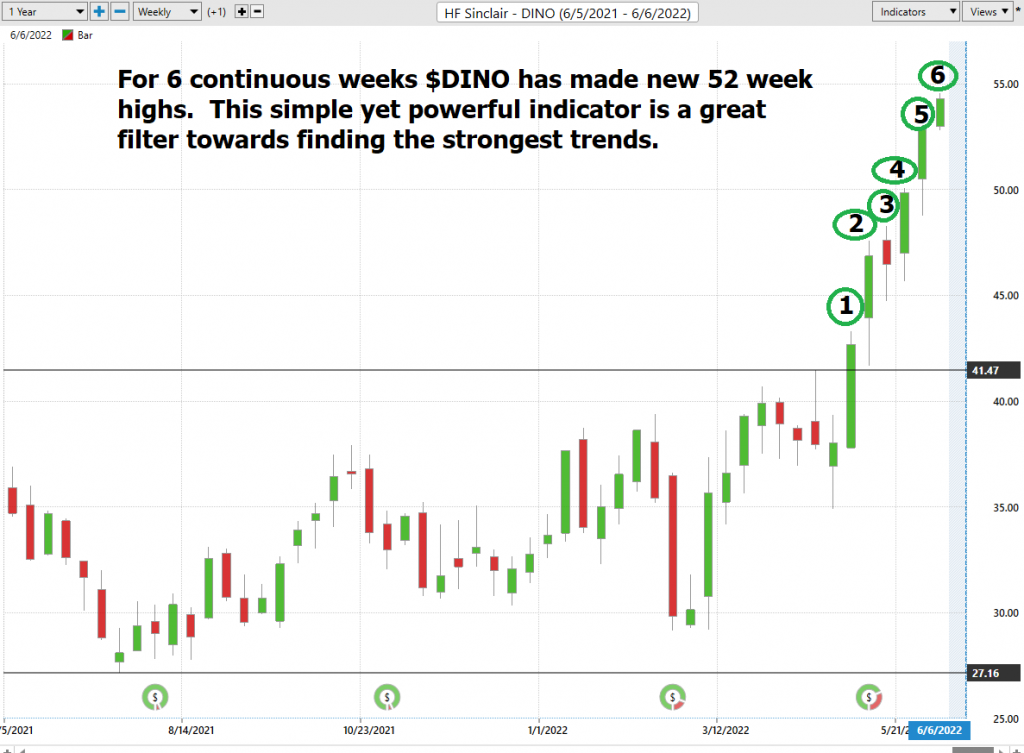
One of the most powerful trend indicators is simply a stock that continues to make new highs repeatedly. For the last 6 weeks $DINO has continued to make new 52-week highs and has rallied over 35% from the moment it breached its original 52-week boundary.
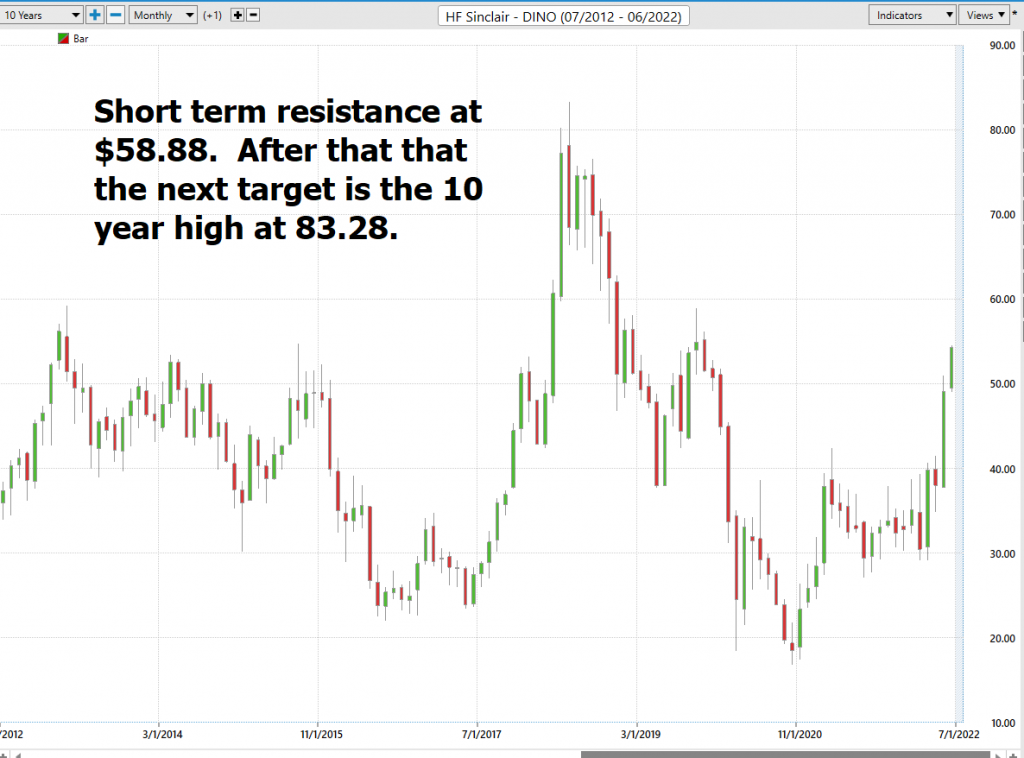
Next, we compare the annual trend in $DINO to the 10-year monthly chart. $DINO is trading in the 86th percentile of its 10-year range.
So, in $DINO we see a countercyclical asset that is attracting interest from Wall Street primarily because it is moving counter to the broader stock market indexes.
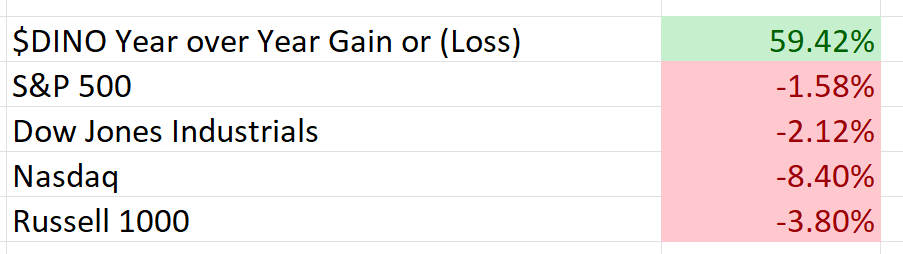
Now we compare $DINO to other opportunities in the broader market indexes.
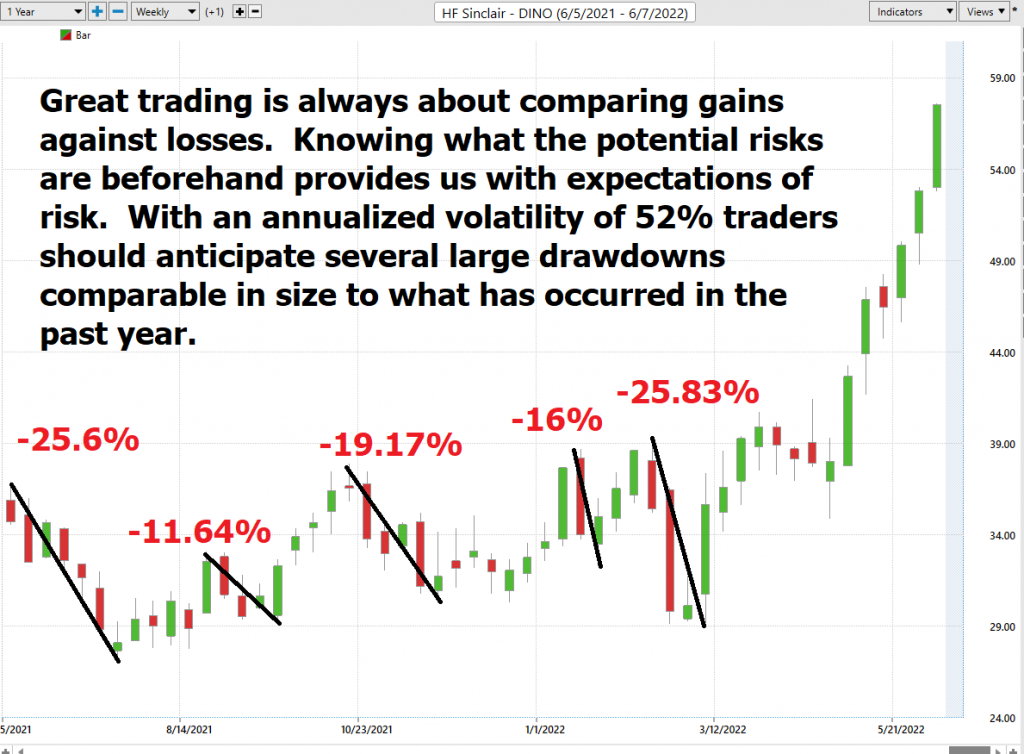
Best Case – Worst Case Scenario
Whenever we look at a trade or long-term investment opportunity to really understand what we are dealing with we need to compare the performance of the asset we are considering with the returns of the major market indexes.
But we also want to get an idea of the best case and worst-case scenarios have been in the asset.
$DINO has traded inverse to the broader stock market indexes.
So, we can see that in $DINO we have a countercyclical asset that historically has traded inverse to the broader stock market indexes.
More importantly, the drawdowns have been quite large as well. The largest drawdowns were 25.83% peak to trough.
The Vantagepoint A.I. Analysis
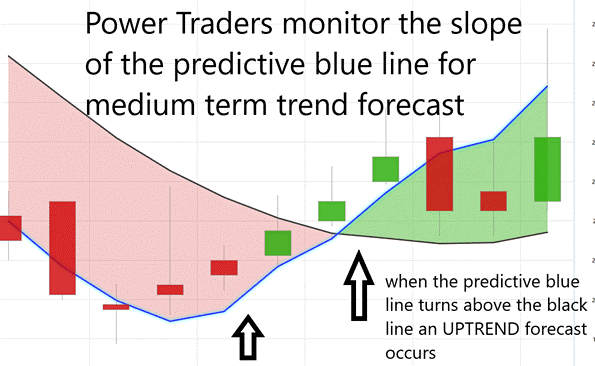
Let’s do some basic trend forecasting analysis based upon looking at the VantagePoint predictive blue line over the last year. On the following chart you will see the power of the VantagePoint Predictive blue line which determines the medium term trend price forecast.
The guidelines we abide by are as follows:
- The slope of the predictive blue line determines the trend and general direction of $DINO
- When the blue line turns above the black line an UP opportunity occurs
- When the blue line turns below the black line a DOWN opportunity occurs
- Ideally, the VALUE ZONE is determined to try and buy the asset at or below the predictive blue line
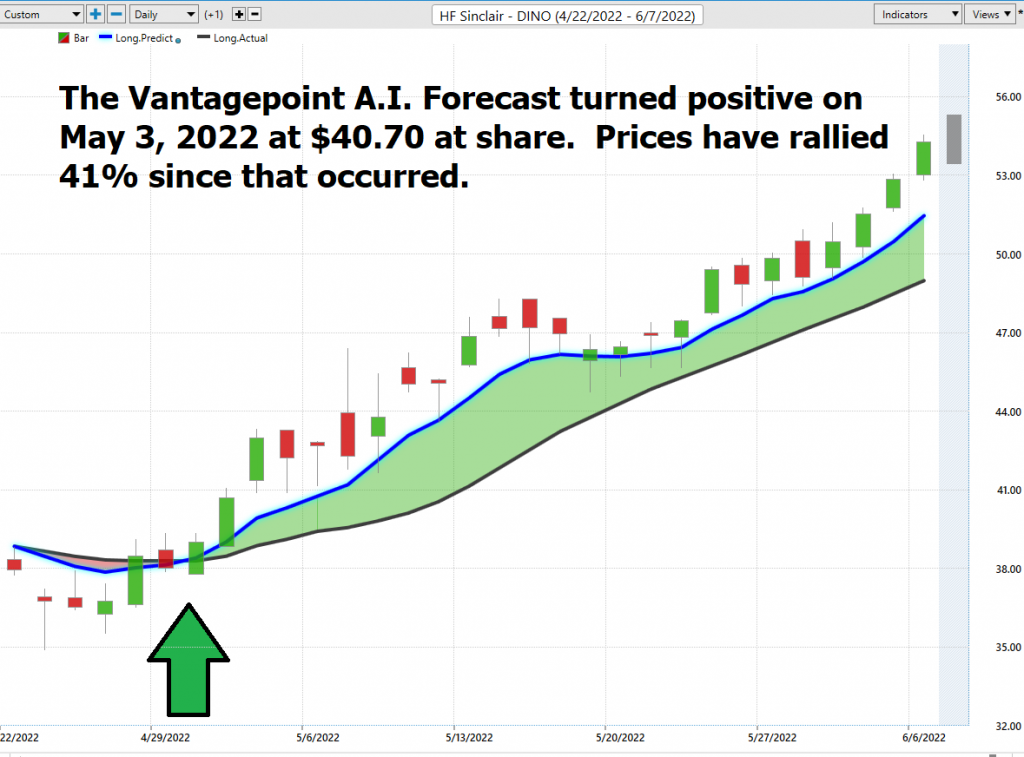
This is the power and effectiveness of the Vantagepoint A.I. forecast in assisting traders to stay on the right side of the trend at the right time.
The predictive blue line is the initial indicator which Power Traders use to monitor and navigate the trend.
Next traders cross-reference this signal with the historical pattern recognition available with machine learning.
Neural Network Index (Machine Learning)
At the bottom of the chart is the Neural Network Indicator which predicts future short-term strength and/or weakness in the market. When the Neural Net Indicator is green it communicates strength. When the Neural Net is red it is forecasting short term weakness in the market.
A neural network is a computing system that is modeled after the brain. neural networks are composed of input nodes, output nodes, and hidden nodes. Input nodes receive information from the outside world, while output nodes send information to the outside world. Hidden nodes are neither input nor output nodes; rather, they process information internally. neural networks learn by adjusting the weights of the connections between the nodes.
The stronger the connection between two nodes, the more influential that connection is. neural networks can be used for a variety of tasks, including pattern recognition and data classification.
At its essence, a Neural Net is a computational learning system that uses a network of functions to understand and translate massive amounts of data into a desired output, consistently monitoring itself and improving its performance.
Whenever Power Traders are looking for statistically valid trading setups, they look for a DOUBLE confirmation signal. This signal occurs whenever the blue predictive line and the Neural Net at the bottom of the chart suggest the same future expected outcome.
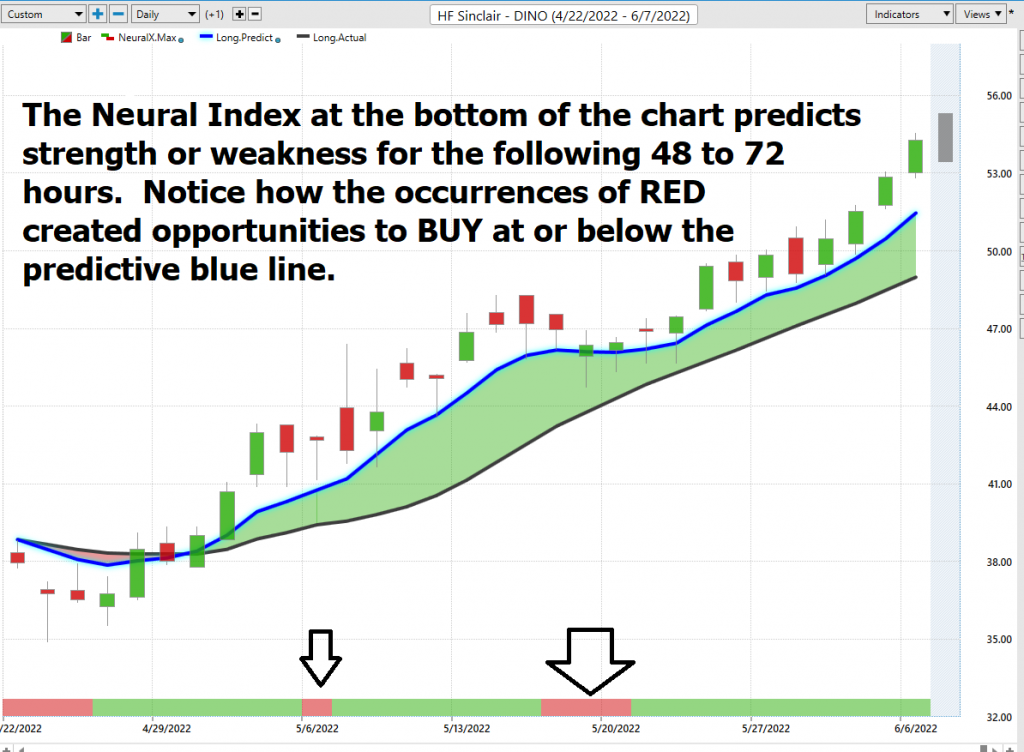
We advocate that Power Traders cross-reference the chart with the predictive blue line and neural network indicator to create optimal entry and exit points.
Traders look for confirmation on the Neural Net to position themselves for LONG or SHORT opportunities in the market. In other words, when the A.I. forecast is green, and The Neural Net is green, that presents a buying opportunity.
The inverse is also true, when the A.I. forecast is red and the Neural Net is red, that is a selling opportunity. The arrows on the chart below highlight the trading zones where Power Traders would’ve been using double confirmation to find a buying opportunity in cross-referencing the A.I. forecast with the Neural Net.
Power Traders are always looking to apply both the Neural Network and A.I. to the markets to find statistically sound trading opportunities.
Daily Range Forecast – Fine Tuning Entries and Exits
One of the powerful features in the VantagePoint Software which Power Traders use daily is the Price Range prediction forecast.
This forecast is what permits Power Traders to truly fine tune their entries and exits into the market.
Every day traders are faced with the anxiety and frustration of wondering where they should be looking for opportunities to buy and sell the market. VantagePoint’s A.I. makes this decision super easy with the Daily Price Range Forecast. This is where the rubber meets the road.
Many factors can affect the daily price range of stocks, from global political events to the weather. As a result, forecasting the daily price range is a complex task that requires careful analysis.
There are a number of methods that can be used to forecast daily price ranges, including technical analysis, fundamental analysis, and news-based analysis. Technical analysis involves studying past price movements to identify patterns that may provide clues about future price behavior. Fundamental analysis focuses on economic indicators such as company earnings and interest rates. News-based analysis involves tracking breaking news stories that could have an impact on the stock market. Vantagepoint A.I. uses a proprietary algorithm that combines the power of a.i., neural networks and machine learning to provide a daily price range forecast. By using a combination of these methods, it is possible to develop a more accurate forecast of the daily stock market price range.
Here is the price chart of $DINO during the most recent uptrend. The software very clearly delineates the daily forecast by providing an exact lower and upper boundary and delineates the trend.
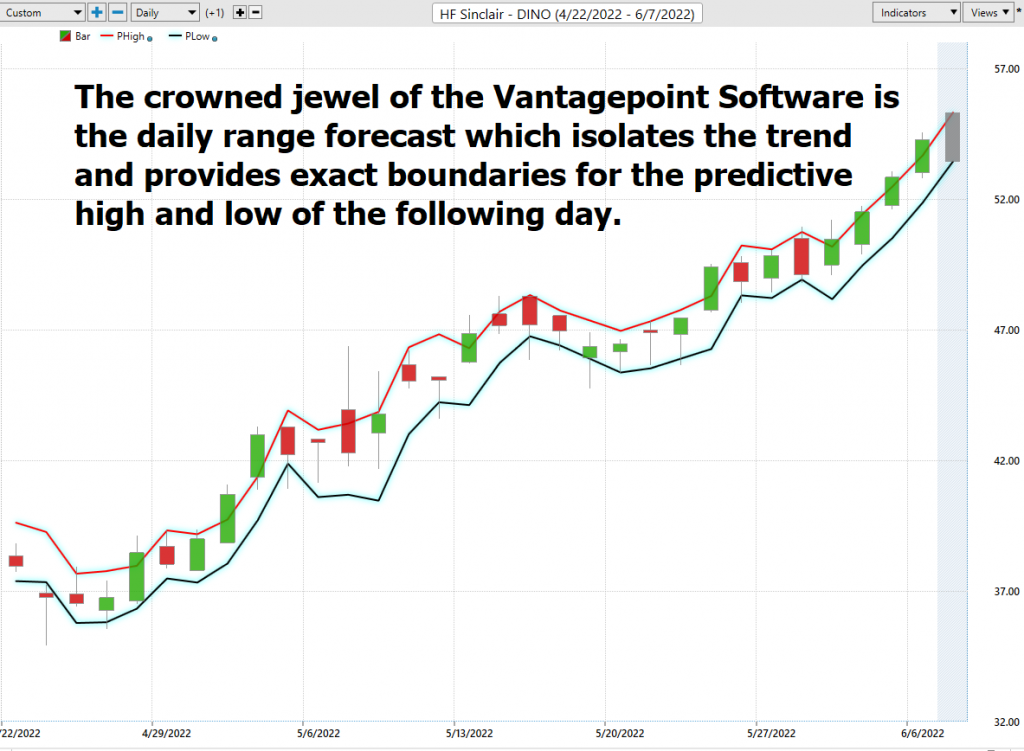
This chart helps traders decide where stop placement should occur. Observe how placing protective sell stops below the dark line on the chart was a powerful way to minimize risk on this trade.
See how the upper and lower bands of the price range forecast for a clear channel of trading activity as well. Swing traders are always looking for opportunities to buy towards the bottom of the predicted channel and selling opportunities above the top band.
Intermarket Analysis
Power lies in the way we respond to the truth we understand.
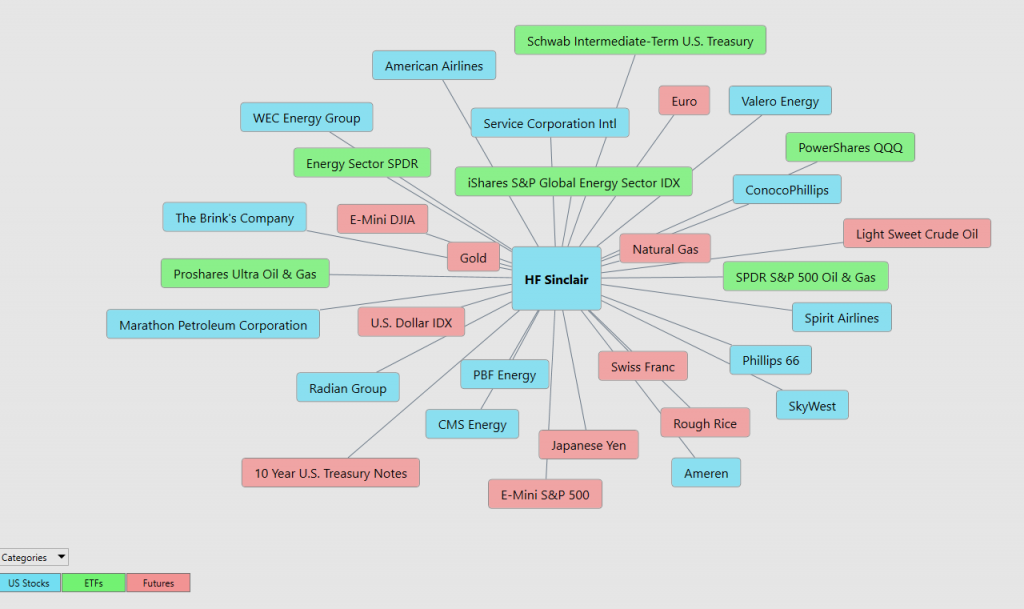
$DINO is 77% correlated to the price of Crude Oil over the last 3 months.
That is a powerful fact that traders use effectively in their decision-making process.
One of the supremely important questions in trading is what is driving the price? Headlines often create interesting narratives. But these “stories” only capture the imagination. Traders want and need to understand the cause and effect of price movement.
The only way to get an answer to this important question is through Intermarket analysis which looks at statistical price correlations of assets.
Intermarket analysis is the study of relationships between different financial markets. It looks at how these markets affect each other, and how they can be used to predict future market movements.
By understanding these relationships, traders can make informed decisions about where to allocate their capital. Intermarket analysis can be used to trade a variety of asset classes, including stocks, bonds, commodities, and currencies. There are a number of Intermarket indicators that can be used to identify opportunities, such as price correlations and momentum indicators. By taking the time to understand Intermarket dynamics, traders can give themselves a significant edge in the market.
So, a study of the relationship(s) will prove to be beneficial to a trader.
We live in a global marketplace.
Everything is interconnected.
Interest rates, Crude Oil Prices, and the volatility of the Dollar amongst thousands of other variables affect the decisions companies must make to flourish and prosper in these challenging times. Trying to determine what these factors are is one of the huge problems facing investors and traders.
You always have a choice. You can tune in to the talking heads in the media who spin talking points which promote fear. Or you can rely on facts to base your decision making on.
Within the following Intermarket Analysis graphic, you will see the 31 markets that are the key drivers to $DINO’s’s price.
Our Suggestion
While the last 4 months have been incredibly positive for $DINO, over the last 5 years the company has massively underperformed the broader market – in a BIG, BIG way.
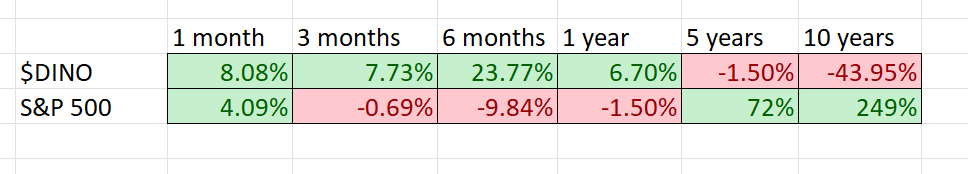
Our thesis proves itself in the graphic above. You can clearly see that as the S&P suffers, $DINO recruits those who fear a market selloff.
Over the past few weeks, we have focused on companies like $CPE and $RRC which have been doing well during a market downturns. We are following in the same vein with $DINO.
On Wall Street countercyclical stocks do very well in market downturns.
We like that $DINO is 77% correlated to the price of Crude Oil.
The average weekly range over the past 4 months has been about 8% of the closing price. We think that a good discriminating trader can look to use the daily range forecast risk 2% to buy near an expected low and sell after several sessions targeting 6% or slightly better. The risk/reward ratio could be considered very healthy with this volatility.
We like the price action in $DINO. Our expectation is that volatility will increase as we approach the 52-week high in Crude Oil.
The Weekly and monthly trends are UP.
PUT $DINO on your radar and allow the a.i. to guide your trading decisions.
Practice solid money management on all your trades.
We will re-evaluate based upon:
- New Wall Street Analysts’ Estimates
- New 52-week high and low boundaries
- Vantagepoint A.I. Forecast (Predictive Blue Line)
- Neural Network Forecast
- Daily Range Forecast
Let’s Be Careful Out There!
Remember, It’s Not Magic.
It’s Machine Learning.
Disclaimer: THERE IS A HIGH DEGREE OF RISK INVOLVED IN TRADING. IT IS NOT PRUDENT OR ADVISABLE TO MAKE TRADING DECISIONS THAT ARE BEYOND YOUR FINANCIAL MEANS OR INVOLVE TRADING CAPITAL THAT YOU ARE NOT WILLING AND CAPABLE OF LOSING.
VANTAGEPOINT’S MARKETING CAMPAIGNS, OF ANY KIND, DO NOT CONSTITUTE TRADING ADVICE OR AN ENDORSEMENT OR RECOMMENDATION BY VANTAGEPOINT AI OR ANY ASSOCIATED AFFILIATES OF ANY TRADING METHODS, PROGRAMS, SYSTEMS OR ROUTINES. VANTAGEPOINT’S PERSONNEL ARE NOT LICENSED BROKERS OR ADVISORS AND DO NOT OFFER TRADING ADVICE.


