| This week’s a.i. Stock Analysis is Dick’s Sporting Goods ($DKS) |
Dick’s Sporting Goods ($DKS) is one of the nation’s largest sporting goods retailers. Founded by Richard “Dick” Stack in 1948, the company has grown from a single bait-and-tackle shop in Binghamton, NY to over 850 stores nationally. The company’s journey from its modest beginnings to becoming a publicly traded entity on the New York Stock Exchange in 2002 is a testament to its enduring appeal.
$DKS generates its revenue through the sale of a wide range of sporting goods and apparel, including sports equipment, footwear, and clothing. The company operates through various profit centers, including its brick-and-mortar stores, online sales through its website, and specialty stores such as Golf Galaxy and Field & Stream.
The company is headquartered in Coraopolis, Pennsylvania, which serves as the central hub for its operations and strategic planning.
In terms of competition, Dick’s Sporting Goods faces challenges from a variety of retailers, including big-box stores, specialty sporting goods stores, and online retailers. Companies such as Walmart, Target, and Amazon, along with specialized competitors like Academy Sports + Outdoors and REI, vie for market share in the competitive sporting goods space. Despite this, Dick’s has managed to maintain a strong position through its focus on customer service, product variety, and community involvement.
The biggest opportunities for Dick’s Sporting Goods lie in its ability to capitalize on the growing trend towards health and fitness, the expansion of its e-commerce platform, and the exploration of new markets and product categories. However, these opportunities also come with risks, including the highly competitive nature of the retail industry, the potential for economic downturns affecting consumer spending, and the challenges of managing a large and diverse inventory and workforce.
The keen-eyed analysts of Wall Street have cast their gaze upon Dick’s Sporting Goods, divining that its revenue will increase by 5.3% year-over-year in the fourth quarter, concluding January 2024, amassing a robust $3.79 billion. Yet, as the fiscal wheel turns to the first quarter ending April 2024, these same Wall Street analysts foresee a contraction, a 10.7% retreat year-over-year, dwindling to $3.04 billion. A tale of growth and decline, starkly drawn in the numbers that chart $DKS’s economic destiny.
$DKS is now celebrating its impressive 76th year in business. What started as a humble retailer has evolved into the premier destination for all things sports-related in the United States. From fishing gear to athletic apparel, Dick’s has you covered.
Their shelves are stocked with a vast array of outdoor essentials, catering to every member of the family. Whether you’re in need of sturdy hiking boots, reliable camping equipment, or top-of-the-line sporting gear, Dick’s has it all. They’ve truly become the go-to spot for anyone gearing up for a weekend adventure or a serious outdoor excursion.
Now, let’s talk about numbers. While we eagerly await the fourth-quarter results, let’s reflect on the stellar performance in the third quarter of ’23. Dicks reported a robust top-line figure of $3.04 billion, showcasing a steady 2.8% year-over-year increase and surpassing initial forecasts by a staggering $90 million.
The biggest opportunity for Dick’s Sporting Goods lies in its ability to adapt to evolving consumer preferences and market trends. With a focus on innovation, digital transformation, and customer experience, the company can capitalize on emerging opportunities in the retail landscape.
However, like any business, Dick’s Sporting Goods faces inherent risks including economic downturns, changes in consumer behavior, and increasing competition.
In this stock study we will look at the following metrics and indicators.
- Wall Street Analysts’ Estimates
- 52-week high and low boundaries
- Vantagepoint A.I. Triple Cross Forecast
- The Best Case – Worst Case Scenarios
- Neural Network Forecast
- Daily Range Forecast
- Seasonal Analysis
- Intermarket Analysis
- Our trading suggestion
We don’t base decisions on things like earnings or fundamental cash flow valuations. However, we do look at them to better understand the financial landscape that a company is operating under.
Wall Street Analysts’ Estimates
Based on 19 Wall Street analysts offering 12-month price targets for Dick’s Sporting Goods in the last 3 months. The average price target is $150.94 with a high forecast of $190.00 and a low forecast of $120.00. The average price target represents a -10.77% change from the last price of $169.15.
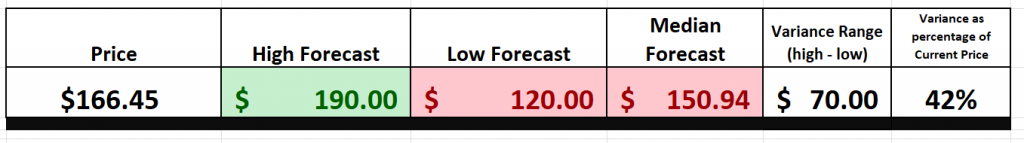
We typically like to look at the variance between the most bullish and bearish forecasts and use that as a gauge for future expected volatility. Currently this variance is 42% or $70. This represents the difference between the most bullish and most bearish forecasts.
We find this variance valuable as often rallies and declines are confined to this level of volatility.
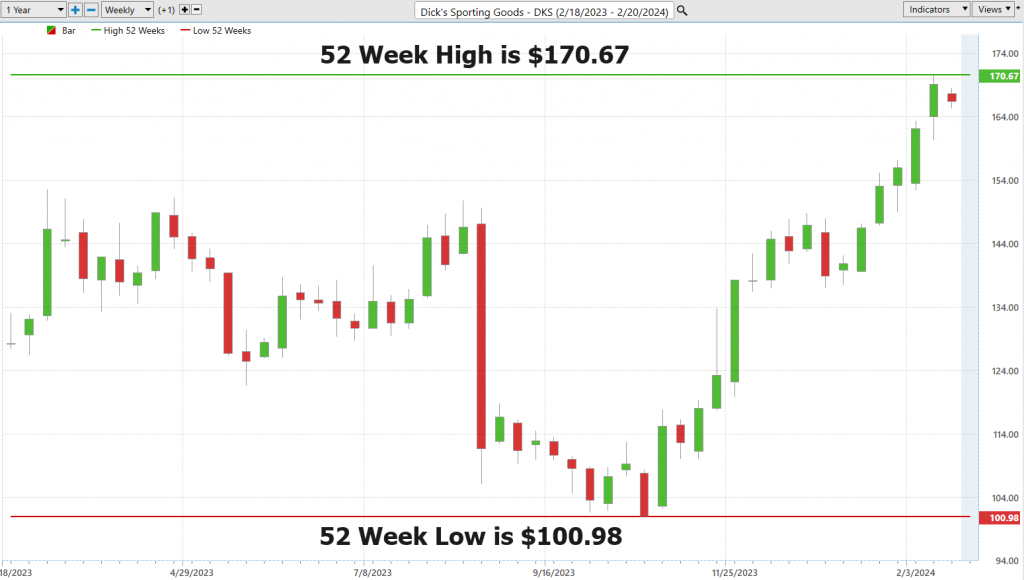
52-Week High and Low Boundaries
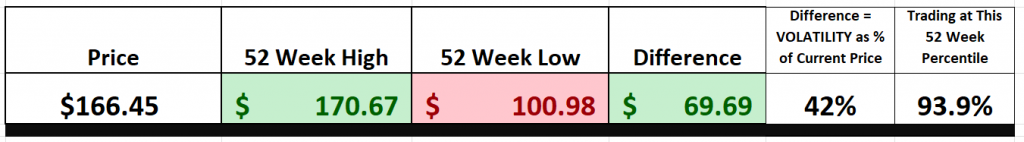
Over the past 52 weeks $LLY has traded as high as $170.67 and as low as $100.98. The annual trading range was $69.69. These numbers provide us with an accurate perspective of historic volatility which we can calculate by comparing the annual trading range and comparing that value to the current price Over the last 52 weeks the historic volatility was 42% which is moderately high. This value tells us that based upon the recent past it would be perfectly normal to expect prices to trade 42% higher and or lower over the next 52 weeks.
Also, $DKS is currently trading at its 93.9% percentile of its last 52-week range.
Think of the stock market as a vast, ever-changing ocean. Navigating these waters requires more than just a compass; it requires understanding the currents and the weather patterns that have preceded your journey. The 52-week high and low of a stock serve as buoys in this vast financial ocean, marking the extremes of a stock’s journey over the past year.
Why, you might ask, do these markers matter? It’s simple. They provide a snapshot of a stock’s performance, offering insights into investor sentiment and potential market trends. When a stock approaches or surpasses its 52-week high, it’s akin to a sailor spotting land on the horizon. There’s excitement, there’s potential, and above all, there’s confidence. This level acts as a beacon, signaling to traders that the stock may have the wind in its sails for further gains.
Conversely, when a stock dips to its 52-week low, it’s as if storm clouds are gathering. It may signal underlying issues or a change in market sentiment, prompting traders to brace for potential turbulence or even reconsider their course entirely.
Moreover, these metrics aren’t just about highs and lows; they’re about understanding the psychological terrain of the market. They function as critical points of support and resistance, guiding traders in setting their strategies, managing risks, and identifying opportunities for entry or exit.
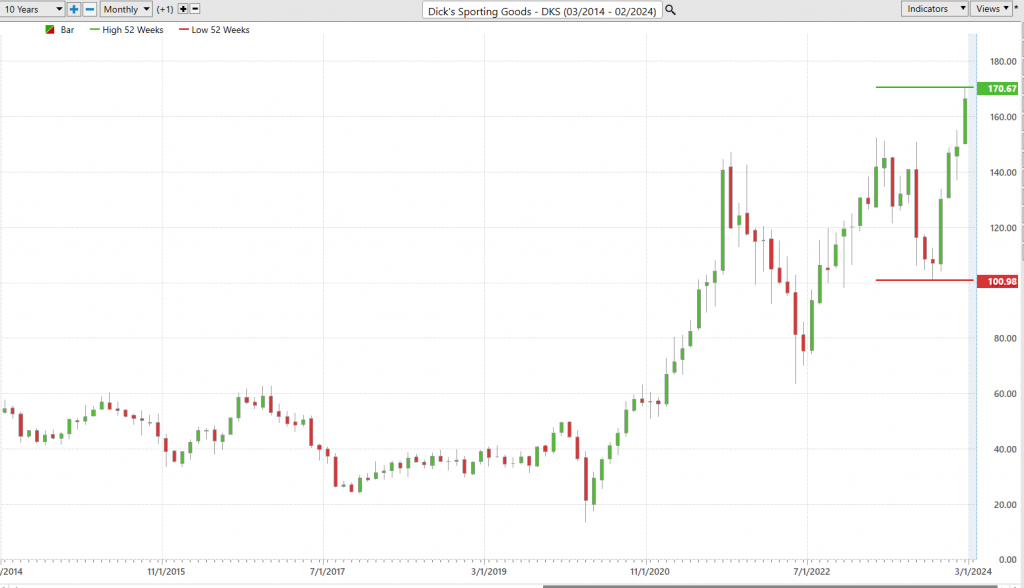
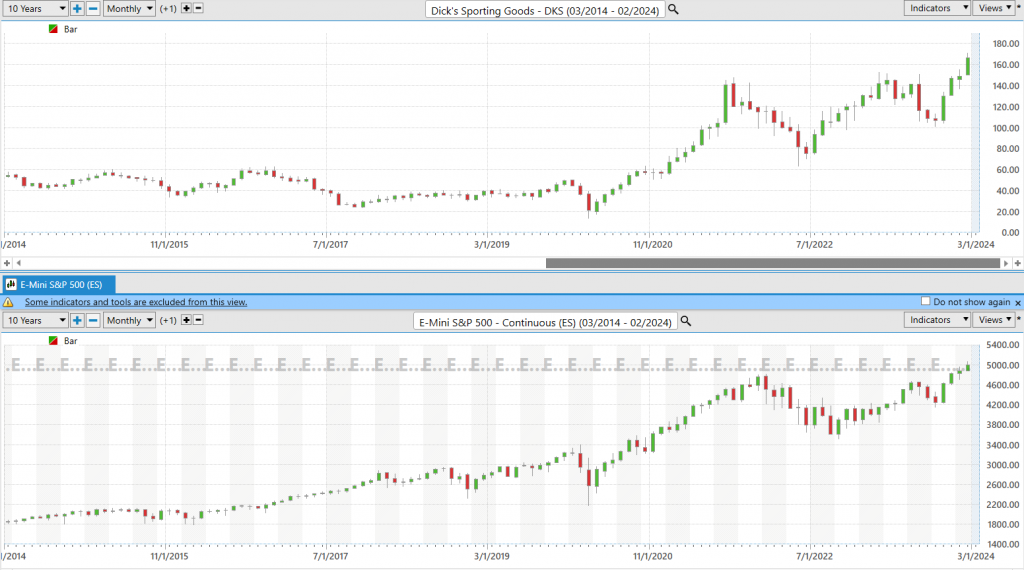
But let’s not be myopic. The savvy navigator looks beyond the immediate horizon. Incorporating a broader view, such as a 10-year chart, helps distinguish between fleeting squalls and the prevailing winds of change. This broader perspective is indispensable for distinguishing between a temporary setback and a fundamental shift.
In essence, monitoring the 52-week highs and lows equips traders and investors with a map and compass for the stock market, providing essential cues for navigating the complex and shifting landscapes of investment with confidence and insight.
Understanding the 52-week highs and lows of a stock isn’t just smart; it’s critical for anyone looking to make their mark in the trading world. Think of it as the ultimate guidebook for the financial major leagues. Why? Because these metrics give you a front-row seat to a stock’s performance story over the last year.
When a stock breaks past its 52-week high, it sends up a flare of confidence, sparking a rush among buyers. Conversely, slipping below the 52-week low sets off alarm bells, signaling potential trouble ahead.
But here’s the kicker – these 52-week markers are more than just numbers. They’re psychological milestones, acting as the stock market’s own brand of support and resistance levels. They’re your defense against risk and your guidepost for setting those all-important price targets.
Don’t just stop there, though. Broaden your horizon. A glance at a 10-year trend can spell the difference between reacting to a blip on the radar and recognizing a true shift in market direction. It’s about separating the wheat from the chaff, identifying whether you’re dealing with a momentary slip or a long-distance runner.
By keeping a vigilant eye on these 52-week markers and adding a dash of long-term perspective, you’re not just trading or investing. You’re navigating the market with precision, armed with the insight to make decisions that are both informed and strategic. It’s like having a GPS for navigating the financial markets, guiding you towards those lucrative destinations. So, remember, understanding your 52-week highs and lows is your ticket to mastering market strengths and weaknesses.
When we zoom out on $DKS we observe something equally impressive. The stock is simultaneously making new 10-year highs accompanied by new 52-week highs. This is one of our favorite trading opportunity setups as it communicates that the stock is overcoming all obstacles related to its success. This is where we pay extra close attention to the buy forecasts generated by the ai as they can be extremely explosive.
Best Case – Worst Case Analysis
One of the most fundamental principles in trading and investing is understanding the implications of risk versus reward. While there are numerous techniques that can assist with this challenge, the most practical and obvious technique is what we refer to as the best-case/worst-case analysis. What we do here is we assume the best and worst scenarios and measure them on the chart over the past year.
We can quickly accomplish this objective by simply connecting the high points and low points of all rallies and declines. By doing so, we can measure the rallies against the declines.
When it comes to understanding real-world volatility, there’s a simple trick – look at the size of the rallies versus the declines on a chart. It’s like measuring waves in a stormy sea, and it tells you all you need to know about the risk and reward potential.
So, here’s the deal: you’ve got to gauge those rallies against the downturns. It’s like assessing the turbulence in that stormy sea, giving you a clear view of what you’re dealing with – risk and volatility, plain and simple.
Now, this isn’t just some fancy maneuver; it’s a strategic philosophy. By looking at both the good times and the tough times, you get the full picture of a stock’s potential. It’s not just about future gains; it’s about knowing the risks too. This is your compass through market ups and downs, revealing the essence of asset dynamics.
So, don’t just look at charts; understand them. It’s not just tactics; it’s a strategy that empowers you to make informed decisions, manage your exposure, and craft a resilient investment plan that balances risk and reward. And let me tell you, these charts I’m about to show you? They’re your best friends when it comes to defining volatility.
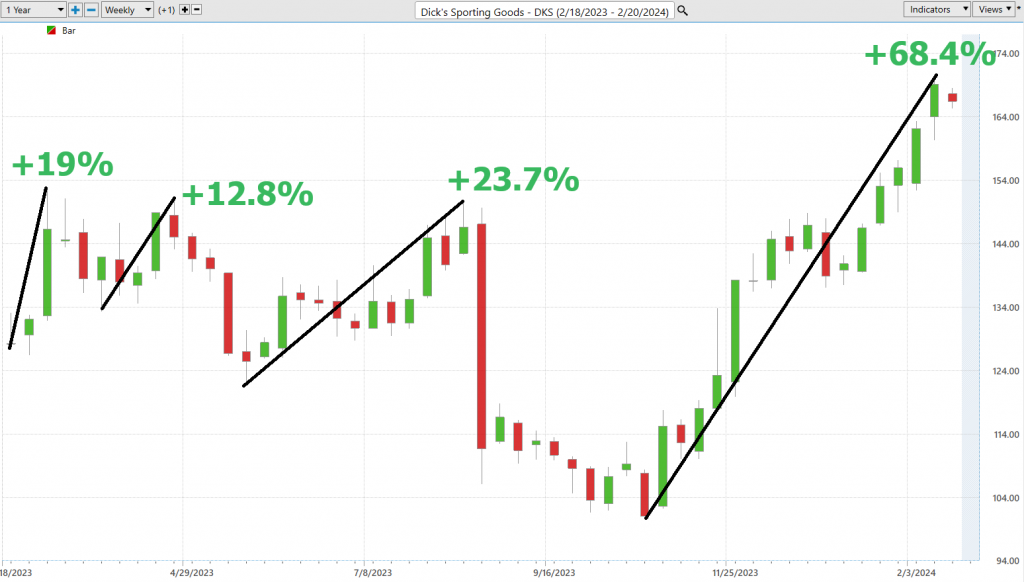
Here is the best-case analysis:
Followed by the worst-case analysis:
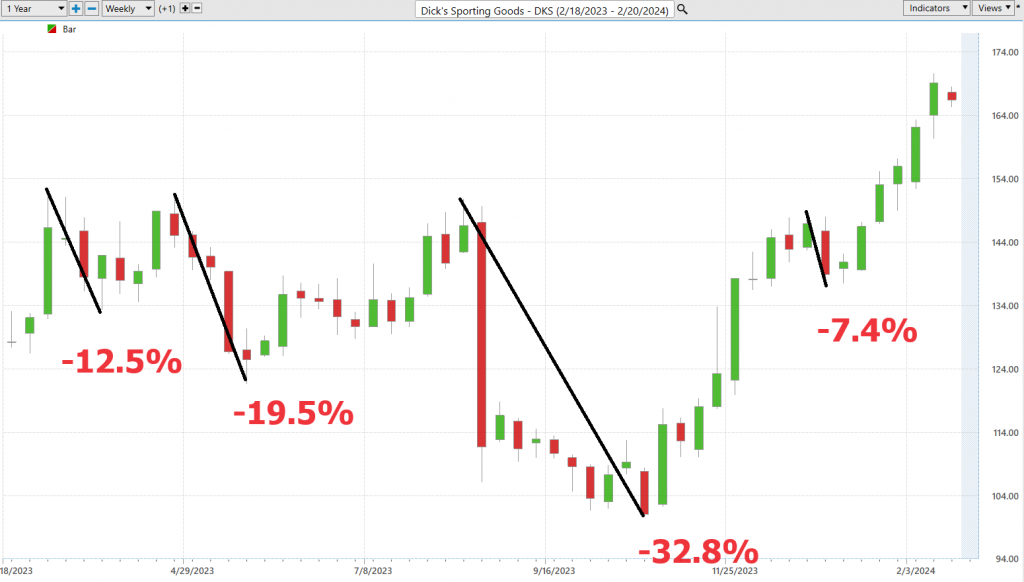
Viewed from this perspective we can immediately see the reward and risk of the past year for $DKS. Clealry the BULLS are in control!
The winning strategy over the past 52 weeks was using pullbacks of 19% or greater to put $DKS on your radar awaiting guidance from the artificial intelligence forecast.
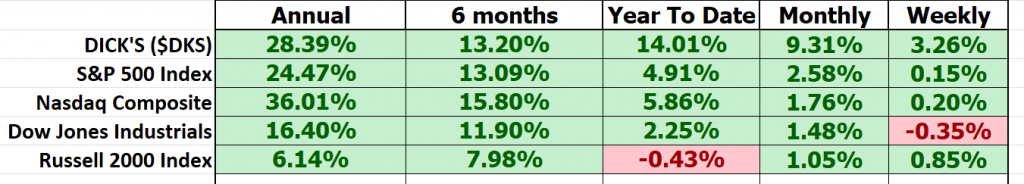
Next, we need to compare $DKS to the broader stock market indices. By doing so we can immediately see that $DKS has massively outperformed the broader market.
Last but not least we need to compare the volatility of $DKS to the broader market. This is done by looking at BETA. Beta is a measure of a stock’s volatility in relation to the overall market. A beta of 1 indicates the stock tends to move in line with the market, while a beta greater than 1 suggests higher volatility, and a beta less than 1 implies lower volatility compared to the market.
Dick’s Sporting Goods ($DKS) has consistently outperformed the broader market indices across various time frames, warranting a closer examination of its volatility, particularly in relation to market heavyweights. In the world of finance, this assessment is encapsulated by the metric known as “BETA.” Amidst the complexities of Wall Street, beta (β) emerges as a financial yardstick akin to the Richter scale for stocks. It quantifies a stock’s sensitivity to the broader market’s movements, offering insights into its behavior during market fluctuations, often benchmarked against major indices like the S&P 500.
Dick’s Sporting Goods ($DKS), over the past 5 years, exhibits a beta of 1.55, indicating it is 55% more volatile than the broader market.
So in $DKS we have a stock that has outperformed the broader stock market indexes with a greater amount of volatility.
The VantagePoint A.I. Predictive Blue Line
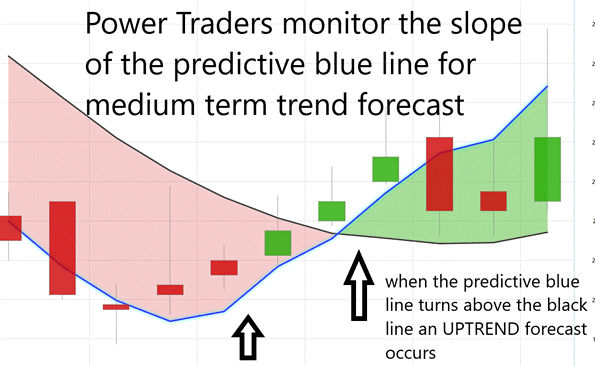
Now, picture this – the predictive blue line. Think of it as your financial North Star, showing you where the market is headed. When it is going up, it means the market is on the rise, and that’s your signal for smart buying. If it is heading down, well, that’s a sign of a market downturn, and it might be time to consider selling.
The essence of this blue line extends beyond mere prediction; it uncovers the ‘value zone,’ a crucial area for traders. As the line ascends, the zone beneath it draws focus, merging price with intrinsic worth to reveal an asset’s true value at that given time.
This analysis isn’t conjured from thin air. It’s the result of VantagePoint’s advanced A.I. technology, employing neural networks, machine learning, and intermarket analysis to unravel the complexities driving asset prices, akin to uncovering the layers to reveal the core.
Accompanying the predictive blue line is the black line, reflecting the 10-day moving average of prices, serving as a historical reference point. It contextualizes the insights provided by the blue line, illustrating the synergy between them to highlight market momentum and emerging opportunities.
The key moment for traders is the crossover of the predictive blue line above the black line, signaling a potential market upswing. This crossover points to where price and potential value converge, indicating an undervalued asset poised for growth.
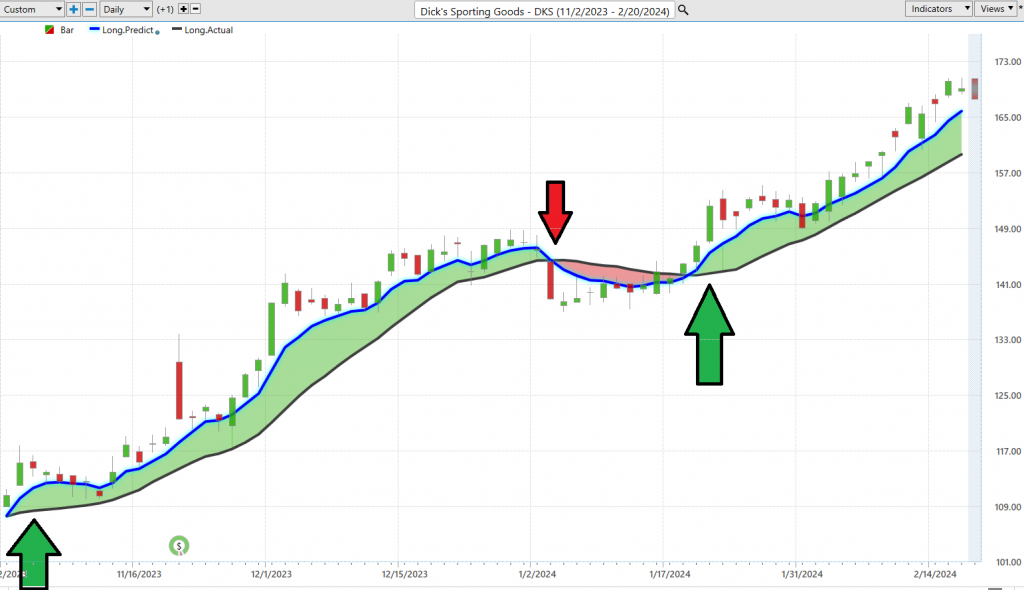
In navigating the market’s fluctuations, the interplay between the predictive blue line and the black line is indispensable. Understanding their relationship equips you with the knowledge to make well-informed decisions, fostering success in your trading endeavors. Remain vigilant, stay informed, and let VantagePoint Software guide you through the dynamic landscape of trading.
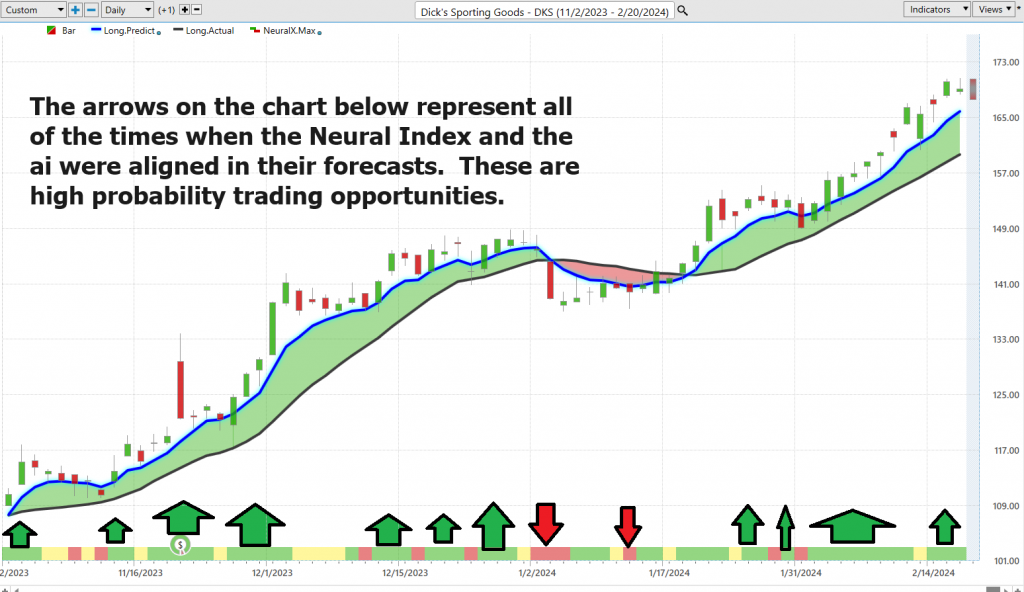
Neural Network Indicator (Machine Learning)
Let’s pivot to the essence of today’s analysis: the Neural Network Indicator, a pivotal tool in forecasting the stock market’s next moves over the shorter term, whether it’s gearing up for a rally or gearing down for a lull. When this indicator shifts to green, it’s essentially flagging a bullish signal, a harbinger of strength. Conversely, a shift to red suggests a cautionary tale of imminent short-term downturns. This isn’t mere speculation; the Neural
Index projects market movements 48 to 72 hours in advance, providing a strategic perspective.
For those unfamiliar, a neural network mimics the human brain’s structure and functionality, incorporating layers of nodes — input, output, and the crucial hidden nodes — that process and relay information. This digital brain evolves, refining its predictive accuracy by adjusting the inter-node connections’ weights, thereby enhancing its interpretive precision over time.
The real intrigue lies in how these neural networks distill vast datasets into actionable insights. It’s about leveraging computational prowess to forecast market dynamics, continuously learning, and adapting to refine those predictions. When traders seek unequivocal high probability signals, they’re often looking for a confluence of indicators — a scenario where both the predictive blue line and the Neural Network align, signaling a robust entry or exit point, as underscored by that conspicuous chart arrow signaling double confirmation.
Why should neural networks command your attention? They embody the cutting-edge intersection of technology and trading, offering a quantitative lens to discern patterns and probabilities that might elude the human eye. It’s akin to having a prescient ally, capable of anticipating market shifts well before they manifest.
So, when dissecting a stock like $DKS, integrating neural network insights with other analytical tools can illuminate the most opportune moments for trading decisions. This is not just about data analysis; it’s about cultivating a strategic edge, empowering traders to act decisively and with confidence.
For those navigating the complexities of today’s markets, embracing neural networks and A.I. technology is not merely advantageous; it’s essential. It’s about enhancing your analytical arsenal, ensuring you’re equipped to seize those fleeting opportunities that differentiate successful trades from missed chances. That, in essence, is the crux of modern trading.
VantagePoint Software Daily Price Range Prediction
In the relentless quest for better trading decisions, savvy Power Traders turn to an indispensable tool: the VantagePoint A.I. Daily Range Forecast. This isn’t just another tool in the arsenal; it’s a cornerstone of strategy, particularly for those who thrive on the adrenaline of fast-paced trading, constantly seeking swift, strategic opportunities.
To appreciate the power of this tool let’s look at the average trading ranges of $DKS over the past year.
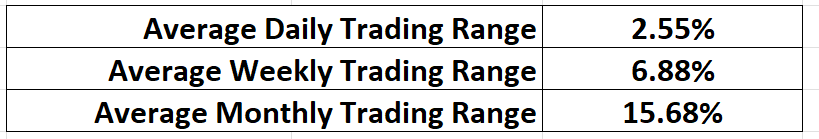
These ranges aren’t just numbers; they’re the pulse of market volatility, a crucial metric for traders. Yet, the pivotal question remains: where do we pinpoint those prime entry and exit points? Every day traders try to determine where the best points are to get in and out of the market.
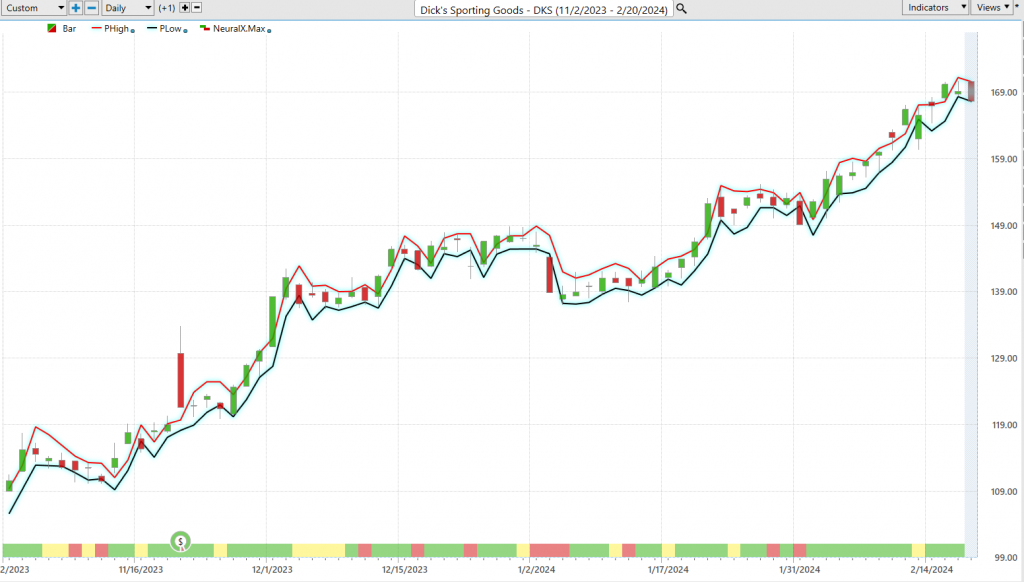
This is where the Daily Range Forecast chart enters the narrative, offering a precision-guided map for short-term swing traders. It delineates what to anticipate each trading day, crafted with the precision that only A.I. and machine learning technologies can provide.
Observe how clearly the trend and trading range is delineated each trading day.
VantagePoint A.I. elevates the game here, integrating the prowess of artificial intelligence, machine learning, and neural networks to deliver a meticulously calculated forecast for each trading session. Imagine it as your market navigator, a sophisticated tool that enables Power Traders to not just follow trends but to master them, ensuring entries and exits are executed with unparalleled precision.
Seasonal Analysis
Seasonal analysis in trading is akin to observing nature’s predictable patterns, applied to financial markets to identify recurring trends at specific times of the year. This approach is grounded in the understanding that various factors—such as weather changes, annual events, and human activities—consistently influence supply and demand across different sectors, from agricultural commodities to energy markets and consumer goods. By studying these seasonal trends, traders gain insights that can improve the timing of their trades, enhance risk management, and inform strategic planning. For instance, knowing that retail stocks may rise ahead of the holiday shopping season or that energy demand spikes during extreme weather can guide traders to make more informed decisions. However, it’s crucial to integrate seasonal analysis with other analytical tools since market dynamics, economic indicators, and unforeseen events can also significantly impact market movements. Thus, while seasonal analysis offers a valuable perspective on potential market behavior, it’s part of a broader toolkit traders use to navigate the complexities of the financial markets.
Observe the Seasonal Analysis chart below:
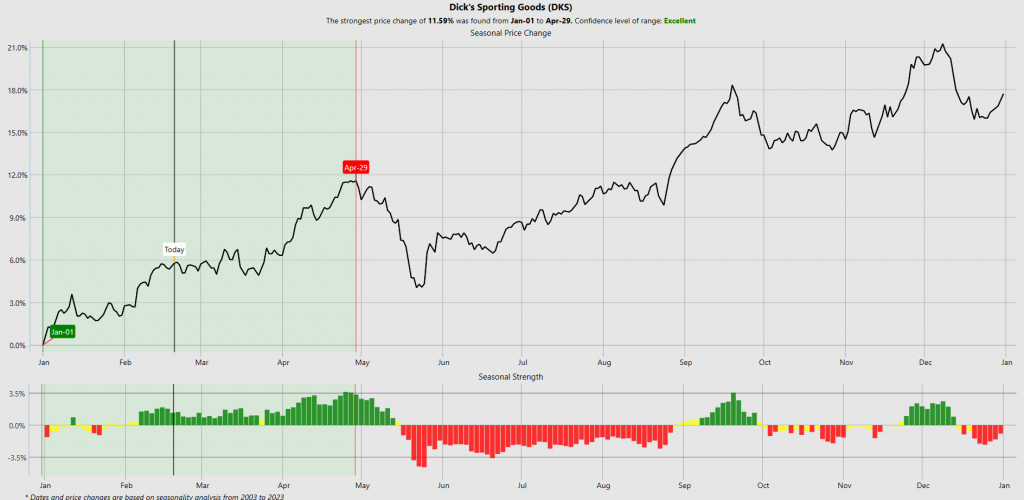
The expectation seasonally is for $DKS to rally mildly between now and April 29th when a seasonal downturn is expected.
Intermarket Analysis
Intermarket analysis is like when you are trying to figure out how different things are connected.
Intermarket analysis is a method used in trading and investing that looks at the relationships between different financial markets, such as stocks, bonds, commodities, and currencies. The basic idea is that these markets do not operate in isolation; they influence and are influenced by each other. For example, a change in interest rates can affect the bond market, which in turn can impact the stock market, while commodity prices can influence the currency values of countries that are major producers or consumers of those commodities.
Here’s a simple analogy to understand intermarket analysis: Think of the financial markets as a complex ecosystem, like a forest. In this forest, different species (markets) interact with and depend on each other for survival. Just as a drought might affect the health of the trees (commodities), which in turn affects the animals that depend on those trees for food (stocks and currencies), changes in one market can lead to reactions in others. By studying these interactions, traders and investors can make more informed decisions, anticipating potential market movements rather than just reacting to them.
Lou Mendelsohn is a significant figure in the development of intermarket analysis as a trading tool. He was among the first to recognize the potential of applying computer technology to study the relationships between different markets systematically. In the 1980s, Mendelsohn developed software that could analyze multiple markets simultaneously, identifying patterns and correlations that would be difficult, if not impossible, for a human to discern unaided. This approach was revolutionary because it moved beyond the analysis of individual markets in isolation, offering a more holistic view of the financial ecosystem.
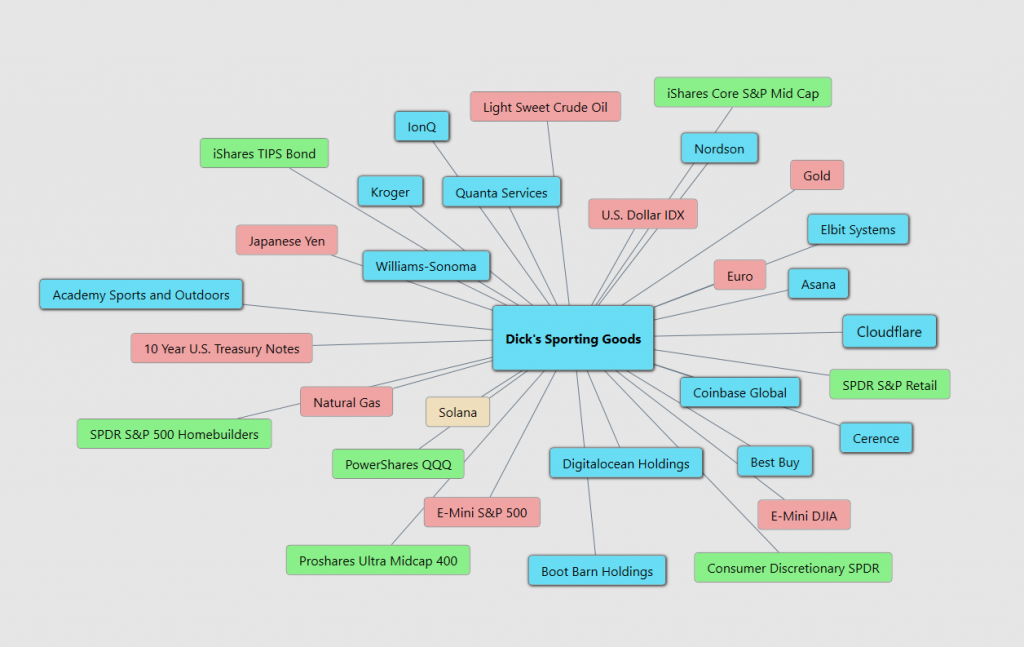
Mendelsohn’s work has paved the way for the development of sophisticated trading strategies that leverage the insights gained from intermarket analysis. His contributions have made it possible for traders and investors to use computers to uncover opportunities and risks across the global financial landscape, marking a significant advancement in the field of technical analysis and trading. In the graphic below are the 31 key drivers of $DKS’s price action. Study them and you will also likely find some gems.
Our Suggestion
Over the last 10 years $DKS is up 192%. Meanwhile the S&P 500 is up 170% over the same time frame.
Dick’s Sporting Goods ($DKS) presents an intriguing case for traders, balancing strong growth prospects against potential market risks. Analysts highlight the company’s impressive earnings growth and efficient asset utilization as key positive factors, suggesting $DKS is well-positioned to outperform industry averages in both respects. Such efficiency in generating sales from assets, coupled with the expected sales growth outstripping that of its industry peers, underscores its attractiveness as a growth investment.
However, $DKS like all retailers would be adversely affected should the economy suffer a recession or prolonged downturn.
Next earnings will be reported on March 14, 2024. This will be a key driver moving forward. In the interim we anticipate a pullback on the stock and will be monitoring the ai for future guidance.
Long term the prospects look very positive here. Short term we expect price action to be quite choppy.
We advise that you practice good money management on all of your trades and that you follow the A.I. forecast for your trend anaysis to determine optimal entries and exits.
Let’s Be Careful Out There!
Remember, It’s Not Magic.
It’s Machine Learning.
Disclaimer: THERE IS A HIGH DEGREE OF RISK INVOLVED IN TRADING. IT IS NOT PRUDENT OR ADVISABLE TO MAKE TRADING DECISIONS THAT ARE BEYOND YOUR FINANCIAL MEANS OR INVOLVE TRADING CAPITAL THAT YOU ARE NOT WILLING AND CAPABLE OF LOSING.
VANTAGEPOINT’S MARKETING CAMPAIGNS, OF ANY KIND, DO NOT CONSTITUTE TRADING ADVICE OR AN ENDORSEMENT OR RECOMMENDATION BY VANTAGEPOINT AI OR ANY ASSOCIATED AFFILIATES OF ANY TRADING METHODS, PROGRAMS, SYSTEMS OR ROUTINES. VANTAGEPOINT’S PERSONNEL ARE NOT LICENSED BROKERS OR ADVISORS AND DO NOT OFFER TRADING ADVICE.