


The A.I. stock spotlight this week is Lockheed Martin ($LMT)
Lockheed Martin occupies a peculiar place in the market. It is both utterly predictable and perpetually surprising. The company has existed, in one form or another, for more than a century, surviving wars, recessions, political cycles, and technological shifts that have erased entire industries. It is not innovative in the Silicon Valley sense, nor fast-moving in the way traders often romanticize. And yet, when uncertainty rises, Lockheed tends to reassert itself with quiet consistency. That is precisely what the stock has been doing.
At its core, Lockheed Martin is a government contractor whose business model is built on long-duration commitments, slow-moving capital allocation, and contracts that stretch across presidential administrations. The company designs and manufactures advanced military aircraft, missile defense systems, helicopters, space assets, and classified technologies that are not easily replaced. Its largest revenue engine remains the F-35 program, a multi-year, multinational fighter jet effort that functions less like a product launch and more like a standing institution. Once a country commits, it rarely walks away.
The company organizes its business across aeronautics, missiles and fire control, rotary and mission systems, and space. Aeronautics drives the largest share of revenue, but missiles and air defense systems have become increasingly important as geopolitical tensions shift military priorities. The U.S. government remains the dominant customer, but allied nations represent a growing and strategically important portion of demand. Lockheed’s customer base is not diversified in the traditional sense, but it is deeply embedded. That embeddedness is the moat.
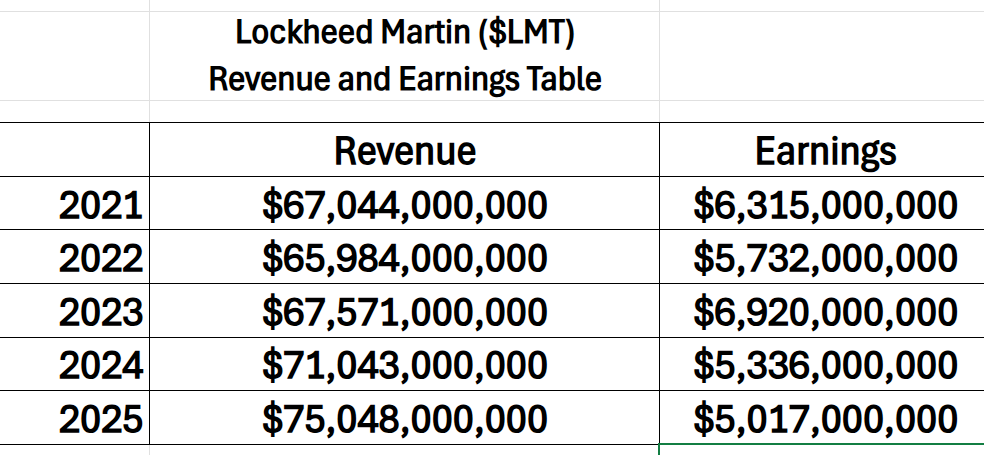
From a financial perspective, Lockheed Martin is best understood as a cash-generating industrial business rather than a growth stock. Revenue has been trending higher over the past several years, driven by backlog conversion rather than explosive demand. Margins are steady but unremarkable, constrained by fixed-price contracts and rising input costs. The company carries a meaningful debt load, which often alarms casual observers, but that leverage is typical for a firm with stable government-backed cash flows. Free cash flow can fluctuate quarter to quarter based on contract timing, which is frequently misinterpreted as operational weakness when it is largely accounting mechanics.
Lockheed Martin’s recent financial trajectory reflects a business defined more by resilience than acceleration, where steady top-line expansion is paired with earnings that move in cycles rather than straight lines. This pattern suggests a company operating inside the realities of long-term government contracting, where revenue visibility is strong, but profitability can shift with program timing, cost pressures, and production mix. Instead of signaling structural weakness, this dynamic highlights the disciplined, capital-intensive nature of defense manufacturing, where stability in demand often coexists with variability in margins. For traders and investors, the broader takeaway is that the underlying engine remains intact, with growth supported by backlog conversion and geopolitical demand, even as near-term earnings fluctuations remind the market that consistency in this industry is measured over years, not quarters.
The balance sheet tells a story of durability rather than elegance. Cash levels are sufficient, debt is manageable, and capital intensity is high but supported by long-term visibility. Traders often misunderstand this structure, expecting quarterly fireworks from a business that operates on multi-year timelines. Lockheed does not surprise to the upside through innovation. It surprises through persistence.
The questions traders are asking now reflect that tension. Is the stock priced too richly after a strong run. Can defense budgets continue to grow at a time when fiscal pressure is mounting. Will the F-35 program remain politically insulated. Are margins vulnerable to cost inflation and tariff risk. And perhaps most importantly, how much geopolitical risk is already embedded in the share price.
Recent news has provided partial answers. Over the past month, Lockheed announced expanded production agreements tied to missile defense systems, reinforcing expectations of sustained demand. Policy signals from Washington have emphasized accelerated delivery and increased capacity investment, suggesting that near-term cash returns may take a back seat to long-term production resilience. Markets have responded positively, pushing the stock to new highs. Some of this optimism is justified. Some of it is anticipatory.
What is genuinely new is the scale and urgency of production commitments. What is already priced in is the assumption that elevated geopolitical tension will persist indefinitely. Wall Street may be underestimating the lag between political intent and budget execution. Defense spending is not an impulse purchase. It is a legislative process with friction.
The stock’s performance over the past year reflects a confluence of factors. Rising defense budgets, earnings that exceeded conservative expectations, backlog growth, and renewed confidence in long-term demand have all contributed. The year-to-date gains are more narrowly driven by contract announcements and sector-wide flows into defense equities. Analysts have largely supported the move, citing earnings visibility and geopolitical tailwinds. Where analysts have historically erred is in assuming linear outcomes in a world shaped by policy negotiation and fiscal tradeoffs.
Looking ahead, the opportunity for Lockheed Martin lies in execution. Converting backlog into cash while maintaining margins would justify current valuations and potentially extend the trend. Additional allied orders would represent a meaningful upside surprise. The risk lies in complacency. A delayed budget, a cost overrun, or a political shift away from large-scale procurement would not destroy the business, but it would challenge the stock’s momentum.
The most significant blind spot for traders is the assumption that geopolitical risk automatically translates into immediate revenue. It often does not. The market prices fear faster than governments approve funding.
For traders, Lockheed Martin is best suited to those who respect trends but understand catalysts. The stock works when defense spending remains predictable and contract execution stays on schedule. Early warning signs would include funding delays, margin compression, or negative revisions tied to program execution rather than headlines.
Lockheed Martin does not trade on hype. It trades on commitment. As long as that commitment remains intact, the stock has room to work. When it weakens, it tends to do so quietly at first. That is where traders should be paying attention.
In this weekly stock study, we will look at an analysis of the following indicators and metrics which are our guidelines which dictate our behavior in deciding whether to buy, sell or stand aside on a particular stock.
- Wall Street Analysts Ratings and Forecasts
- 52 Week High and Low Boundaries
- Best-Case/Worst-Case Analysis
- Vantagepoint A.I. Predictive Blue Line
- Neural Network Forecast (Machine Learning)
- VantagePoint A.I. Daily Range Forecast
- Intermarket Analysis
- VantagePoint A.I. Seasonal Analysis
- Our Suggestion
While our decisions are ultimately guided by artificial intelligence forecasts, we still take a brief look at the fundamentals to understand the financial landscape in which Lockheed Martin is operating under.
Wall Street Analysts Price Forecasts
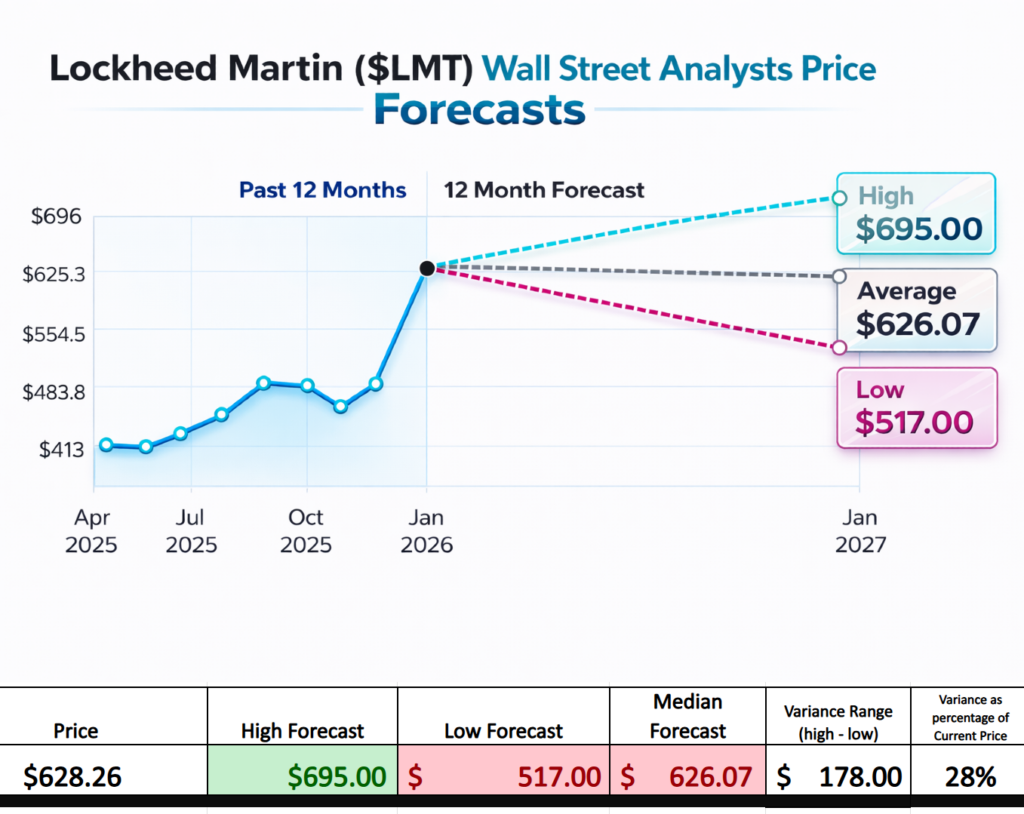
Fifteen Wall Street analysts have taken their best swing at predicting Lockheed Martin, producing a tidy little consensus that looks calm until you read the fine print. The average 12-month price target comes in at $626.07, which sounds reassuring in the way a weather report does right before you pack the wrong jacket. The most enthusiastic optimists see the stock climbing to $695.00, while the pessimists, ever loyal to their inner gloom, see it drifting down toward $517.00.
That spread between optimism and despair happens to be $178, which is not pocket change unless you are a defense contractor or a senator. That number is the market quietly admitting it has no firm idea what will happen next, only that it could happen with enthusiasm in either direction. Wall Street likes to call this “price discovery,” which is a polite phrase meaning educated guesswork dressed in a suit.
This is why expectations are not really set by the average forecast at all. They are set by the distance between the most bullish and most bearish opinions. That $178 range is the market’s expectation of motion, risk, and opportunity wrapped into one tidy number. When that range widens, confidence shrinks. When it narrows, conviction grows. And when it stays wide, as it does here, Wall Street tells you one thing very clearly while pretending not to. Buckle up.
52 Week High and Low Boundaries
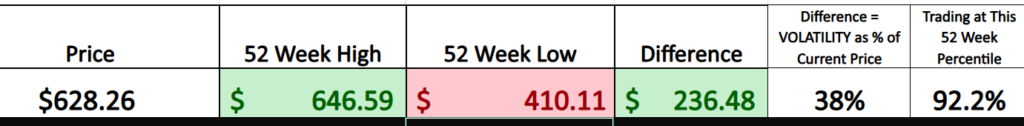
Lockheed Martin is not whispering strength. It is declaring it. The stock is pressing near the top of its yearly range, trading in the upper tier of its twelve-month battlefield where only the strongest names tend to survive. Volatility exists, but it is controlled volatility, the kind that accompanies accumulation rather than panic. What matters to traders is simple. Institutions are paying higher prices, momentum is building instead of fading, and the trend is pointing up with conviction. Until proven otherwise, this is the behavior of capital seeking security, stability, and sustained demand in an uncertain world. And in markets like these, strength at the highs is not a warning. It is a message.
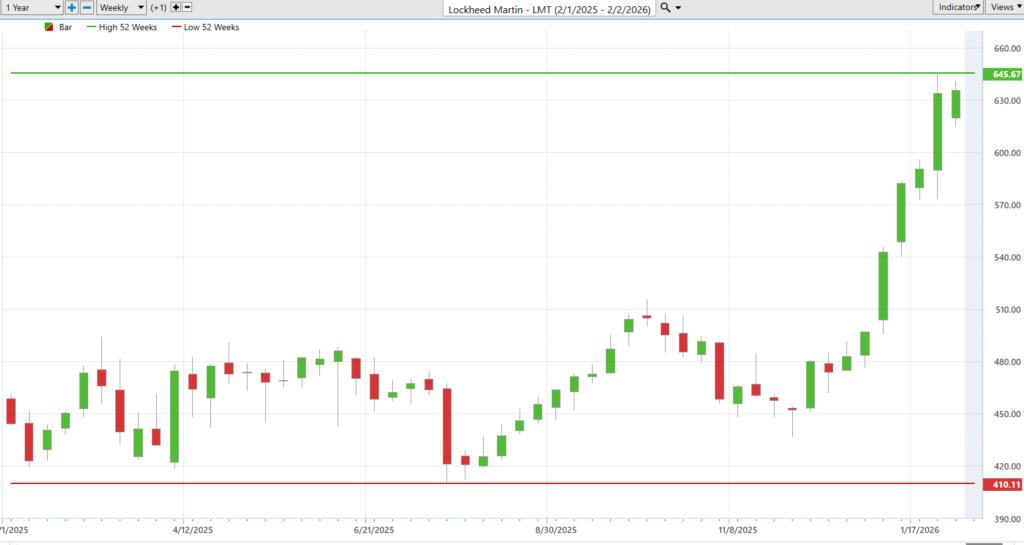
When you step back and look at the long-term chart, the noise disappears and the truth gets very simple. Lockheed Martin is not just strong in the moment. It is doing something far more important. It is pushing into new territory across multiple time horizons at the same time. New 52-week highs. New 10-year highs. That combination always deserves attention because it signals persistent demand, not temporary excitement.
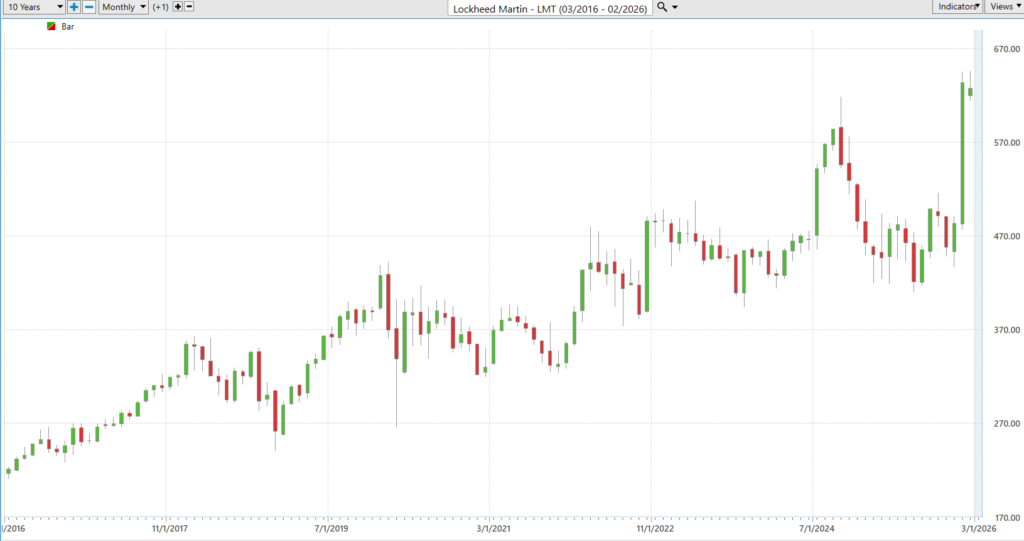
Stocks do not reach these levels by accident. They get there because large, patient capital keeps showing up. Institutions are not chasing headlines. They are positioning for durability, visibility, and trend. When a stock begins making new all-time highs, history shows that money often continues to flow in the same direction. Strength tends to feed on itself.
This is why moments like this matter. Not because of prediction, but because of evidence. The chart reveals where conviction already exists. And when conviction aligns with long-term highs, disciplined traders pause, focus, and watch closely.
Best-Case/Worst Case Analysis
Volatility, in markets, is often discussed with the kind of reverence normally reserved for quantum physics or central banking. In practice, it is much simpler. It is the distance between confidence and regret, measured in price. The two charts in front of us strip the concept down to something almost uncomfortably clear. Instead of indicators, models, or narratives, we are looking at uninterrupted moves. Straight lines of fear. Straight lines of enthusiasm. Nothing more complicated than that.
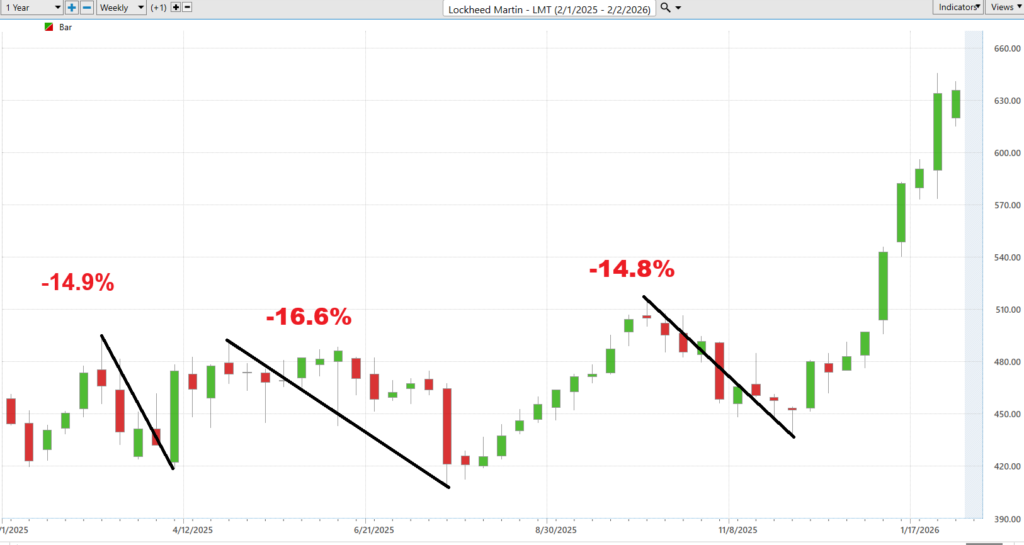
Starting with the declines… The largest downward runs matter because they define the real cost of being wrong. Each pullback marks a stretch of time when sellers controlled the tape long enough to force weak hands out. Seen together, they establish the recent worst-case experience of simply holding the stock without timing. Not theoretical risk. Lived risk. And importantly, those declines are finite. They end, they reverse, and they often become the fuel for the next advance.
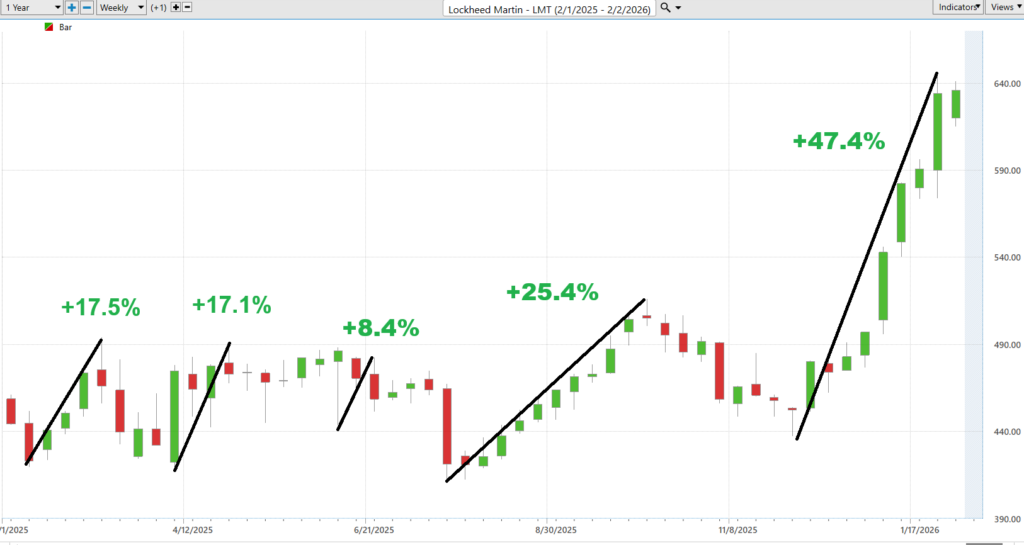
Now look at the rallies. These uninterrupted advances are more than recoveries. They are proof of persistence. Buyers return with enough conviction to push price meaningfully higher before the next pause. When the distance traveled on the way up begins to exceed the distance traveled on the way down, the character of volatility changes. It stops feeling random and starts looking directional. Volatility itself is neutral, but the side whose moves are larger is the side in control. In other words, the real question inside volatility is simple: are buyers or sellers ultimately being rewarded.
Placed side by side, the comparison becomes the lesson. Volatility is not just how much price moves. It is the relationship between downside distance and upside distance across repeated cycles. In the most recent stretch, the rallies have reached farther than the declines. That single observation reframes the entire risk conversation. The issue is no longer whether the stock is volatile, but whether that volatility is working in favor of those who own it.
This is where the exercise becomes useful for traders and investors. By measuring the largest uninterrupted moves, expectations become grounded in evidence rather than emotion. Position sizing, stop placement, and time horizon begin to anchor themselves to reality. The market stops being a story and becomes a set of observable probabilities. Put the two together and you get something far more useful than a prediction. You get a risk-reward profile you can trade. You can see how bad it got when things went wrong. You can see how good it got when things went right. You can see how long both took to play out. That’s the real lesson here. Volatility is not about how scary the candles look. It’s about the size and duration of the moves. And when the rallies are consistently larger than the drawdowns, the math starts doing the heavy lifting for you. That’s what these charts quietly prove about $LMT.
In that sense, volatility is less about chaos and more about memory. The charts simply remind us what the stock has recently been capable of doing in both directions. Once you understand the distance of pain and the distance of opportunity, you are no longer guessing. You are calibrating.
Nest we compare $LMT to the broader stock market averages.
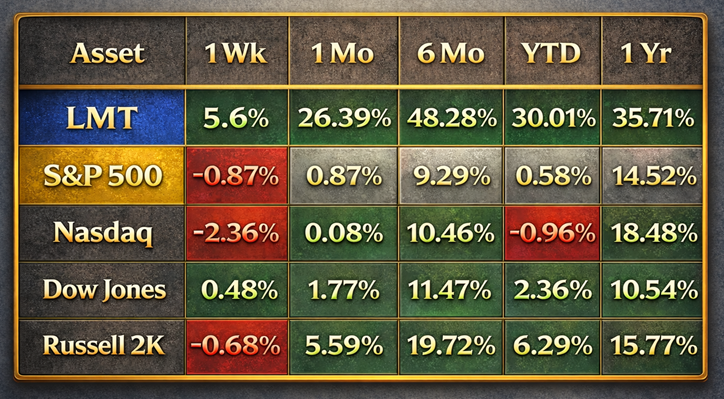
What jumps out of this table is not subtlety. $LMT is not quietly edging ahead or winning on a technicality. It is dominating across every visible timeframe and doing so by margins that make the comparison almost unfair. One week, one month, six months, year to date, one year. Pick a window. $LMT is on top, and it is not particularly close. This is not a single lucky stretch. It is a pattern.
Look at the context. The S&P 500, Nasdaq, Dow Jones, and Russell 2K are all doing what broad markets tend to do. Some green here, some red there, progress that depends heavily on timing and patience. $LMT, by contrast, is behaving like an asset with its own gravity. A 26% move in one month. Nearly 50% over six months. Over 30% year to date. These are not index-like returns. These are leadership returns.
And this is where the performance grid stops being a scorecard and starts being information. Outperformance across all time frames tells you something about consistency, not just opportunity. It tells you where capital is choosing to stay, not just visit. Markets rotate, narratives change, and headlines come and go. But when one stock keeps winning every race regardless of distance, the message is simple. The market has decided, and right now, $LMT is the decision.
Vantagepoint A.I. Predictive Blue Line
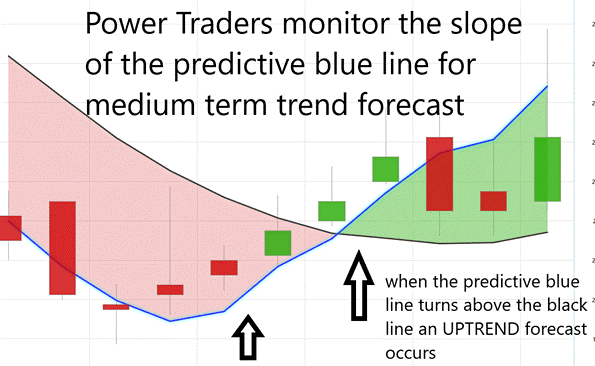
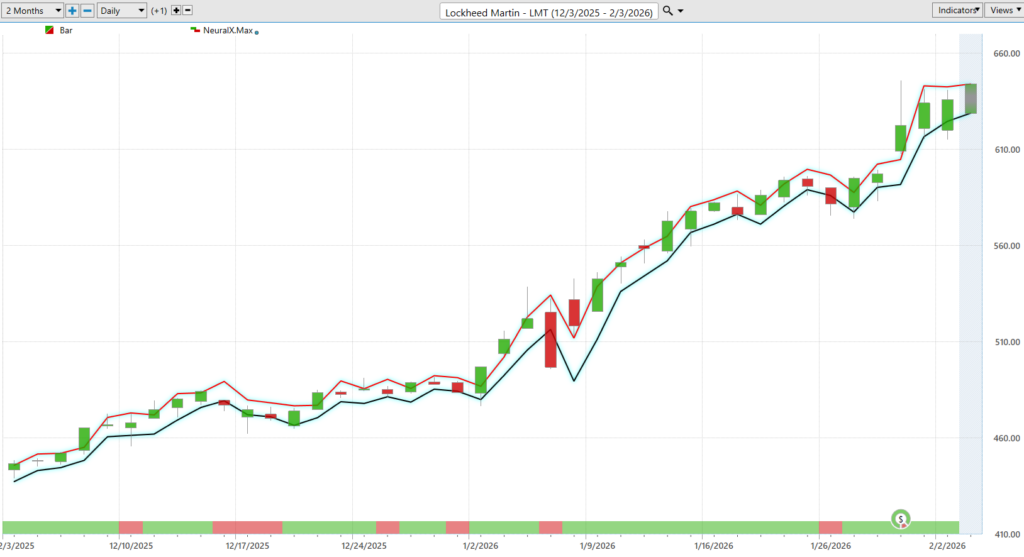
In a market increasingly defined by the tension between hindsight and anticipation, the chart of $LMT presents a disciplined framework rather than a hopeful guess. The VantagePoint A.I. predictive blue line functions as a forward-looking gauge of where the market is leaning, while the black line, a ten-day simple moving average, quietly records where price has already been. When the slope of that blue line rises and holds above the black baseline, the implication is straightforward: momentum is organizing to the upside, and the favorable posture is long. When it falls below, advantage and caution move in the opposite direction. Even the distance between the two lines carries meaning, reflecting the strength and conviction behind the trend rather than serving as decoration.
The most recent confirmation of this alignment appeared just after 12/04/25, marked by the green arrow. From that point forward, prediction led history. Over the next 36 days, price advanced 38.9%, translating the abstract idea of forward expectation into tangible performance. The move reinforces a simple professional rule set: trade in the direction of the predictive slope, respect sustained separation above the moving average, and resist arguing with acceleration once it becomes visible.
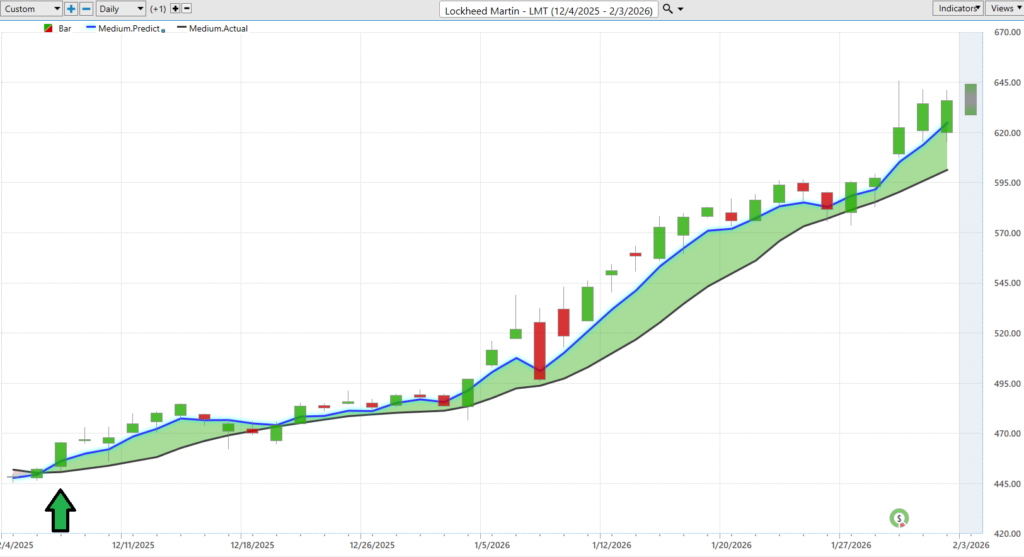
What emerges is structure. You are not reacting to yesterday’s tape; you are positioning around an A.I.-driven expectation of tomorrow’s direction. If the predictive slope trends upward and remains above the historical baseline, the burden of proof shifts away from the rally and toward any thesis betting against it.
VantagePoint A.I. Neural Index (Machine Learning)
In modern markets, the phrase “neural network” can sound either grandiose or opaque. In practice, it is neither. It is simply a mathematical system designed to do what humans struggle to sustain: observe enormous amounts of historical market behavior, detect recurring structure, and update its expectations without ego. Built in layers, the model absorbs raw inputs such as price, volume, volatility, intermarket relationships, and money flow. Hidden computational layers process the nonlinear complexity beneath the surface. The final output distills that complexity into something traders can act on, not poetry but probability.
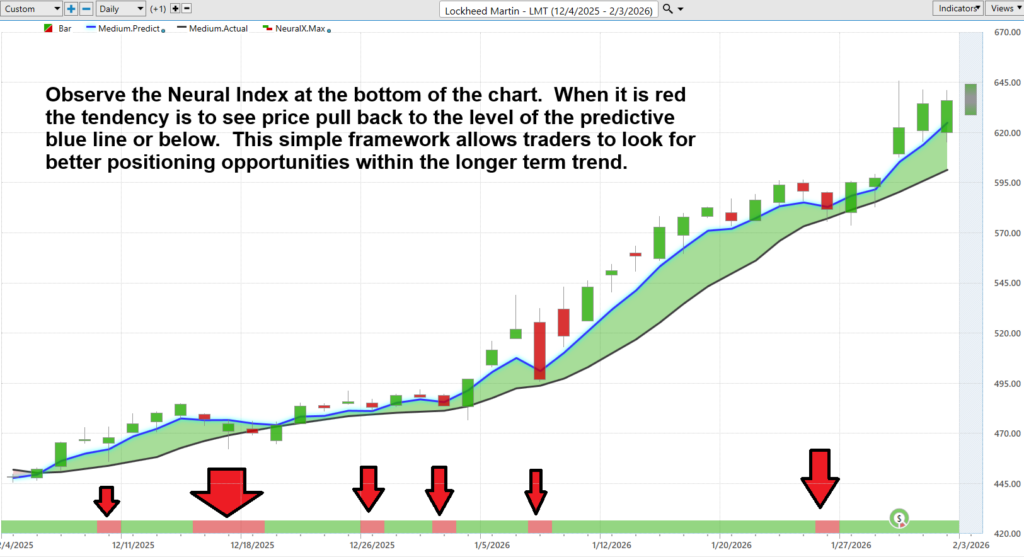
The chart of $LMT offers a practical illustration of that translation from abstraction to behavior. The neural index at the bottom turns red at several points, each instance coinciding with a tendency for price to retrace toward the predictive blue line or slightly below it. These are not dramatic reversals so much as moments of statistical gravity, brief pullbacks occurring within a broader upward structure defined by a rising predictive slope above the ten-day historical baseline. In that sense, the indicator is less about calling tops than about refining timing, allowing traders to reposition during weakness without losing sight of the dominant trend.
This is where the advantage becomes behavioral as much as analytical. Human traders oscillate between urgency and hesitation, often reacting to the most recent candle rather than the underlying probabilities. A neural network does not experience fear of missing out or discomfort during drawdowns. It recalibrates. The value, therefore, is not mysticism but consistency: a probabilistic framework that highlights when risk is expanding, when opportunity is re-emerging, and when alignment between prediction and price suggests the trend remains intact.
VantagePoint A.I. Daily Range Forecast
Here’s the uncomfortable reality of short-term trading, delivered without the usual motivational music: either you have a rational expectation of where price is likely to travel next… or you are essentially sightseeing in the casino district with better lighting. Charts are wonderful décor. Precision is what pays the rent.
That is where the VantagePoint A.I. Daily Range Forecast quietly does the job every trader claims to want but rarely gets. It does not argue politics, debate narratives, or consult your feelings about defense spending. It focuses on the one question that matters when money is on the line: What is tomorrow’s probable trading range? Not philosophy. Boundaries. Distance. The measurable space where profit and risk negotiate their terms before the opening bell. In civilized markets, this is called preparation. In uncivilized markets, it is called luck. The forecast is an attempt to stay on the civilized side of history.
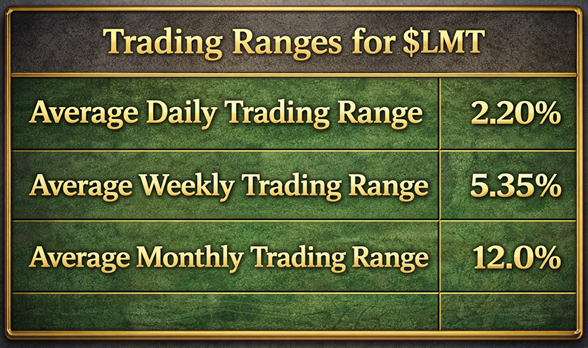
Now place that precision beside the chart of $LMT’s historical movement, the tidy little reminder that this stock tends to travel about 2.20% daily, 5.35% weekly, and 12% monthly when left to its own devices. Suddenly the future is not a foggy battlefield but a mapped hiking trail with elevation markers. You begin to see why professionals stop asking whether price will go up or down and start asking the only question that keeps the lights on: how far can it reasonably move? Because distance, not direction alone, is where the profit hides… and where discipline stops gambling from wearing a necktie and calling itself strategy.
Intermarket Analysis
Here is the clear, quiet truth hiding inside this web of connections around $LMT.
Nothing in markets moves alone. Every price is part of a conversation.
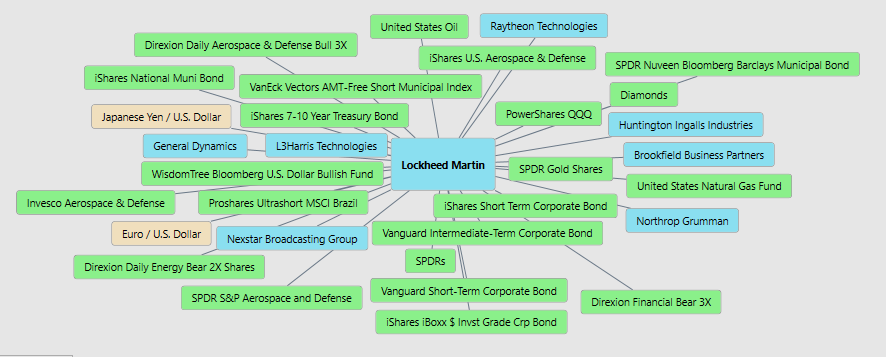
The graphic places Lockheed Martin at the center, with lines stretching outward into oil, gold, bonds, currencies, defense peers, and broad risk assets. This is not decoration. It is cause and effect made visible. Markets are ecosystems, and the position of $LMT in the middle of so many relationships tells you something important before a single headline appears.
Step back and three forces keep revealing themselves.
First is tension in the world. Defense spending rises when uncertainty rises. You can see this echoed in the connections to oil, gold, and other aerospace and defense names. When fear quietly enters the room, capital does not panic. It is reallocated. And it often reallocates toward protection. That is the environment where $LMT tends to live and breathe.
Second is the cost of money. Bonds of every variety — Treasuries, municipals, short-term corporates — cluster around the center of the map for a reason. When borrowing is easy, governments spend more freely. When borrowing tightens, budgets feel heavier and priorities get scrutinized. Defense stocks are not immune to gravity. They simply experience it differently.
Third is the dollar and the direction of global flow. Currencies sit on the outer edge of the diagram like quiet referees. A softer dollar can make U.S. defense exports marginally easier. A stronger dollar can narrow that channel. It is rarely the dominant force, but it is never irrelevant.
The lesson, then, is simple enough to remember and serious enough to matter. Watch fear. Watch money. Watch flow. Because when uncertainty rises, when liquidity still exists, and when capital begins searching for safety, the center of this map, $LMT tends to become more important, not less.
Our Suggestion
Here is the simple truth about the last two $LMT earnings calls.
Management sounds mostly optimistic. They continue to talk about strong demand, a very large backlog of future orders, and steady growth in critical programs like fighter jets and missile systems. In plain English, they believe the business has plenty of work ahead and clear visibility into future revenue. That confidence matters because it suggests stability in an industry where long-term contracts drive performance.
Are they hitting their goals? Mostly yes, but not perfectly. Revenue is growing and demand remains strong, which checks one of the most important boxes for a defense contractor. At the same time, profits and margins have faced some pressure because large defense programs are expensive, complex, and difficult to execute without cost surprises. The company is moving in the right direction, just with a few operational bumps along the way.
The real story sits in the balance between risk and opportunity. Most of Lockheed Martin’s revenue depends on U.S. government spending, which means political budgets always matter. Large, complex programs can also run over cost, and rapidly increasing production can create supply chain or execution challenges. Yet the opportunities are equally clear. Rising global tensions are pushing defense budgets higher, demand for missile defense and advanced technology is expanding, and the company’s enormous backlog already provides years of future revenue visibility.
Wall Street expects the next earnings report in late April 2026, likely before the market opens. Expectations are not dramatic, but they are constructive. Analysts are looking for steady growth, continued strong demand, and careful management of costs and margins.
The takeaway is straightforward. Management is confident. The business is growing. But investors are still watching the fine print. That balance between visible strength and lingering risk is what truly defines $LMT right now.
Our practical suggestion is simple. Place $LMT on your watchlist and monitor it closely. Leadership, resilience, and visible demand make it worthy of attention, but discipline must always come first. Practice sound money management and thoughtful position sizing on every trade, because protecting capital is what allows opportunity to matter in the long run.
We expect $LMT will offer numerous trading opportunities in 2026. Use the VantagePoint A.I. Daily Range Forecast to isolate short term trading opportunities.
It’s not magic.
It’s machine learning.
Disclaimer: THERE IS A HIGH DEGREE OF RISK INVOLVED IN TRADING. IT IS NOT PRUDENT OR ADVISABLE TO MAKE TRADING DECISIONS THAT ARE BEYOND YOUR FINANCIAL MEANS OR INVOLVE TRADING CAPITAL THAT YOU ARE NOT WILLING AND CAPABLE OF LOSING.
VANTAGEPOINT’S MARKETING CAMPAIGNS, OF ANY KIND, DO NOT CONSTITUTE TRADING ADVICE OR AN ENDORSEMENT OR RECOMMENDATION BY VANTAGEPOINT AI OR ANY ASSOCIATED AFFILIATES OF ANY TRADING METHODS, PROGRAMS, SYSTEMS OR ROUTINES. VANTAGEPOINT’S PERSONNEL ARE NOT LICENSED BROKERS OR ADVISORS AND DO NOT OFFER TRADING ADVICE.


