


This week’s ai stock spotlight is Micron Technology ($MU)
Micron Technology was our Stock of the Week on November 6, 2025. In that analysis we stated that the big reason $MU has been strong is that its memory chips are essential for A.I. servers, data centers, and cloud computing, which are all growing quickly. When demand for A.I. grows, Micron sells more chips and makes more money. The main risks are that the memory chip business goes through big boom-and-bust cycles, meaning prices can fall fast if too many chips are made, and that political tensions, especially with China, could hurt sales. You can read that analysis here.
Today, after years of being treated as a commodity manufacturer with unreliable earnings, Micron has reemerged as a central player in the infrastructure of artificial intelligence, cloud computing, and data-intensive workloads.
The company’s history is best understood as one of survival and adaptation. Micron was founded by a group of engineers including Ward Parkinson, Joe Parkinson, Dennis Wilson, and Doug Pitman, and grew steadily through the 1980s and 1990s by focusing on dynamic random-access memory and later NAND flash storage. It expanded largely through internal manufacturing expertise and selective acquisitions, becoming one of the only U.S.-based memory manufacturers capable of competing at global scale. After enduring repeated boom-and-bust cycles that punished margins and tested investor patience, Micron is now benefiting from a structural shift in demand that is fundamentally different from past cycles.
Micron today employs roughly 48,000 people worldwide, with manufacturing and research facilities across the United States, Asia, and Europe. Its business is organized around four primary markets: computer and networking, mobile, embedded solutions, and storage. While these are technically distinct end markets, they share a common dependency on increasingly sophisticated memory solutions. The largest and fastest-growing contributor is data center and AI-related memory, particularly high-bandwidth memory used alongside advanced processors.
The company generates revenue almost entirely from selling memory products rather than branded consumer devices. That distinction matters. Micron is not competing for consumer loyalty but for design wins inside servers, smartphones, automobiles, and industrial systems. Its largest revenue generators are DRAM products, followed by NAND-based storage. These products are highly capital-intensive to manufacture, technologically complex, and deeply cyclical. For decades, that cyclicality defined how Wall Street viewed Micron: profitable at the top of the cycle, painful at the bottom, and rarely deserving of a premium valuation.
That perception is now being challenged. Over the past 52 weeks, Micron shares have risen more than 350%, with a 31% gain year to date. The rally has been driven by a convergence of forces that rarely align so cleanly in the semiconductor industry. Demand for memory tied to artificial intelligence workloads has surged while supply discipline across the industry has improved. Years of underinvestment following previous downturns have left the market tighter than expected just as hyperscalers are racing to build data centers capable of training and running large A.I. models.
Recent news underscores this shift. In the past month, Micron announced plans to invest approximately $24 billion in a new advanced memory manufacturing facility in Singapore, signaling confidence that elevated demand will persist well into the next decade. The company also moved to acquire additional fabrication capacity in Taiwan, strengthening its position in DRAM manufacturing. At the same time, Micron confirmed it would wind down its Crucial-branded consumer memory business, a decision that reflects a deliberate pivot away from lower-margin retail products toward enterprise and AI-focused customers.
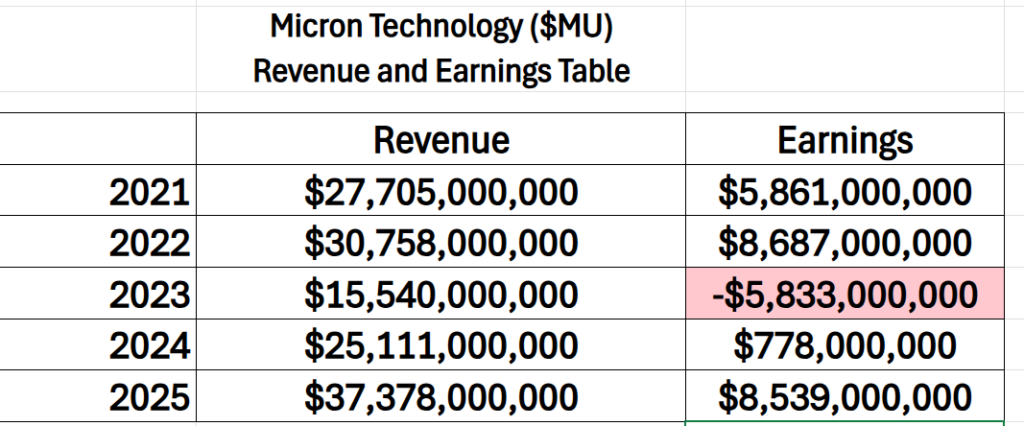
Financially, Micron is in a stronger position than at any comparable point in previous upcycles. Revenues for the most recent fiscal year approached $37.4 billion, with gross margins in the mid-40 percent range and operating margins approaching the high 20s. The company holds more than $10 billion in cash and manages a debt load that, while significant, is reasonable given its capital-intensive business and current profitability. Importantly, Micron’s balance sheet appears capable of supporting continued investment without excessive dilution or financial strain.
Revenues have detonated, margins are thick, and Wall Street suddenly cares about the memory chipmaker it once ignored. But here’s the honest twist — this thing swings wildly: big profits on the upside, brutal drawdowns on the downside. If you’re in it for thrills, $MU delivers. If you’re after safety, you might as well buy government bonds and take a nap. The chip business is cyclical, geopolitical risks loom large, and one wrong headline can send the stock spinning.
Wall Street’s view of Micron has historically oscillated between cautious optimism and outright skepticism. Analysts have long struggled with the company’s earnings volatility, often extrapolating past cycles into the future. Several of the more pessimistic forecasts over the past two years assumed memory oversupply would return quickly and cap profitability. Those assumptions have proven premature. Pricing for advanced memory, particularly high-bandwidth products used in A.I. accelerators, has remained firm, and demand visibility has improved.
Still, Micron’s current position is materially different from past cycles. The company is not simply riding a rebound in PC or smartphone demand. It is supplying a foundational component of A.I. infrastructure, a market that is still in the early stages of development. That distinction helps explain why investors have been willing to re-rate the stock and why traditional valuation frameworks have struggled to keep pace with price action.
For traders, Micron is best understood as a high-conviction cyclical leader rather than a speculative momentum play. The stock remains sensitive to earnings guidance, memory pricing data, and capital expenditure trends from hyperscale customers. Volatility should be expected. But the underlying narrative, at least for now, is one of constrained supply meeting durable demand.
The central question facing investors today is not whether Micron is a good company. It is whether the current cycle represents a temporary spike or a longer-lasting structural shift. The answer will determine whether Micron’s recent rally is merely impressive or genuinely transformative.
In this analysis we will review and evaluate forecasts using the following set of indicators and tools.
- Wall Street Analysts Ratings and Forecasts
- 52 Week High and Low Boundaries
- Best-Case / Worst-Case Scenario Analysis
- VantagePoint A.I. Predictive Blue Line
- Neural Network Forecast (Machine Learning)
- VantagePoint A.I. Daily Range Forecast
- Intermarket Analysis
- Our Suggestion
While we make our trading decisions based upon the artificial intelligence we also believe context is important and study of the fundamentals to see if they align with the technical trading narrative.
Wall Street Analysts Forecasts
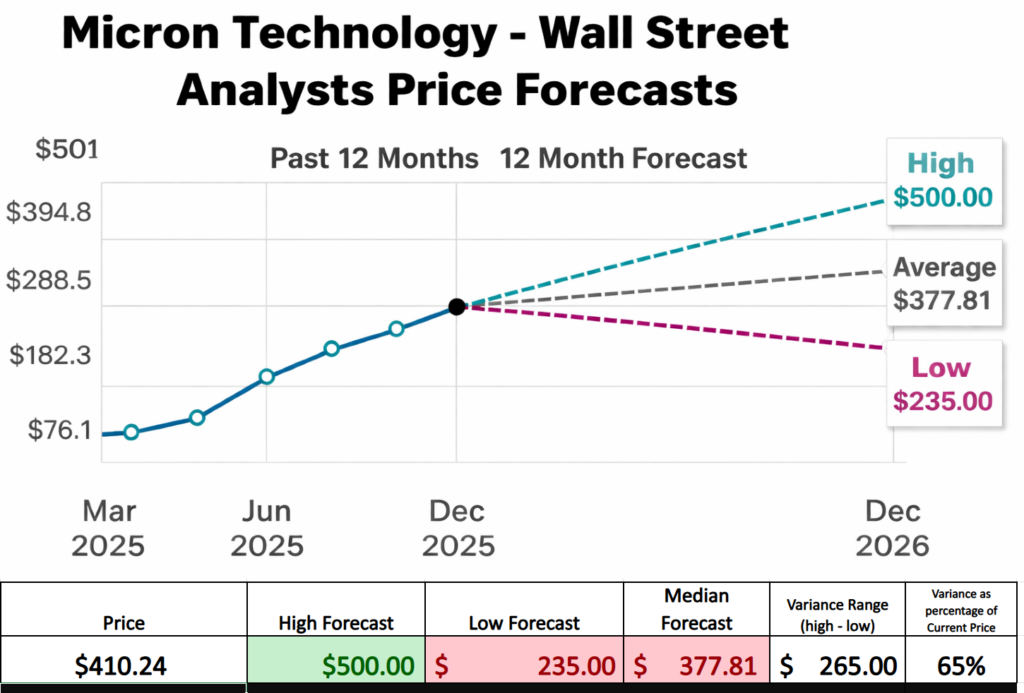
What this chart really illustrates is not confidence, but disagreement, and disagreement at scale.
At first glance, the analyst forecasts look like a familiar Wall Street exercise: a high case, a low case, and a neat-looking average tucked safely in the middle. But that framing misses the most important signal embedded in the graphic. The story is not where analysts think Micron might land. The story is how far apart those opinions are. The gap between the most bullish forecast at $500 and the most bearish forecast at $235 is $265, a spread that amounts to roughly 65 percent of the current share price. That is not a rounding error. That is a statement about volatility.
This variance is best understood as the market’s forward-looking estimate of turbulence. In effect, it defines the range of outcomes that Wall Street considers plausible over the next twelve months. A move of $265 in either direction is not being treated as an extreme scenario. It is being treated as normal. That alone tells you this is not a stock operating in a stable, predictable environment.
What makes this particularly noteworthy is who is doing the disagreeing. These forecasts come from analysts who spend their professional lives immersed in Micron’s fundamentals. They track memory pricing, inventory cycles, capital expenditures, A.I. demand, competitive capacity, and geopolitical risks continuously. They listen to earnings calls, model supply and demand curves, and update assumptions in real time. When that group of observers lands on such a wide dispersion of outcomes, it reflects genuine uncertainty about how powerful the current forces shaping the business will ultimately be.
That uncertainty cuts both ways. On one hand, it signals substantial risk. A business tied so closely to cyclical pricing and capital-intensive manufacturing can see sentiment shift quickly if demand softens or supply expands faster than expected. On the other hand, it highlights why Micron continues to attract speculative and momentum-oriented capital. Large disagreement creates large price moves, and large price moves create opportunities for traders willing to tolerate volatility.
In that sense, the average forecast is almost beside the point. The median price target provides comfort, but the variance provides information. It tells investors that Micron is operating at the intersection of powerful structural growth drivers and historically unstable industry dynamics. Artificial intelligence has changed the demand profile for memory, but it has not eliminated the cyclicality that has defined this industry for decades.
The chart, then, functions less as a prediction and more as a warning label. It suggests that Micron’s future will not unfold quietly. When analysts who watch the company around the clock disagree this sharply, the result is rarely a smooth path. It is a setup for sharp advances, abrupt pullbacks, and rapid reassessments of value. For investors, that combination spells both significant risk and significant opportunity, often at the same time.
52 Week High and Low Boundaries
What this graphic makes clear, almost uncomfortably so, is that Micron’s recent success comes with a very specific cost: volatility on a scale that demands respect.
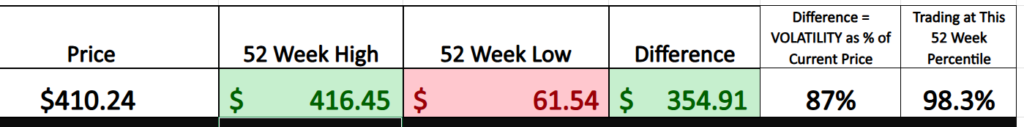
The first instinct most investors have when they see a stock pressing new 52-week highs is optimism. And for good reason. Stocks that make new highs are, by definition, winning. Capital is flowing toward them, fundamentals are being rewarded, and the market is confirming the underlying business momentum. Micron fits that profile cleanly. Trading near its 52-week high of $416.45, the stock sits in the 98th percentile of its annual range. That is not accidental. It reflects a company benefiting from powerful forces, including A.I.-driven memory demand and tightening supply dynamics.
But the second graphic introduces a critical layer of nuance. When we step back and examine not just where Micron is trading, but where it has traded over the last year, the picture becomes more complex. The 52-week low sits at $61.54. The difference between the high and the low is $354.91. When that range is measured against the current price of roughly $410, it represents about 87% of today’s value. In other words, over the last year, Micron has traveled nearly the equivalent of its entire current price from low to high.
That statistic is not an abstract math exercise. It is a real-world expression of how this stock behaves. It tells us that large moves are not anomalies for Micron. They are normal. And that insight aligns almost perfectly with what we observed earlier in the Wall Street analyst forecast data. Analysts who study Micron full time, tracking memory pricing, capacity expansion, capital spending, and AI demand, collectively projected a forward price variance of $265, or roughly 65% of the current price.
When two independent measures arrive at similar conclusions, it is worth paying attention. The historical trading range says this stock routinely moves hundreds of dollars. The analyst forecasts say the market expects that behavior to continue. Different inputs, same message.
The conclusion is straightforward and difficult to ignore. Micron may be winning, but it is winning loudly. This is not a low-volatility compounder easing its way higher. It is a stock that advances in powerful surges and corrects with equal force. The upside potential is real, but so is the risk of sharp reversals along the way.
For traders, that reality does not argue against owning the stock. It argues for discipline. Position-sizing matters. Risk management matters. And expectations matter most of all. When a company shows a $354 annual trading range and analysts disagree by $265 on future value, the market is effectively telling you to buckle your seat belt. The opportunity is significant, but so is the ride.
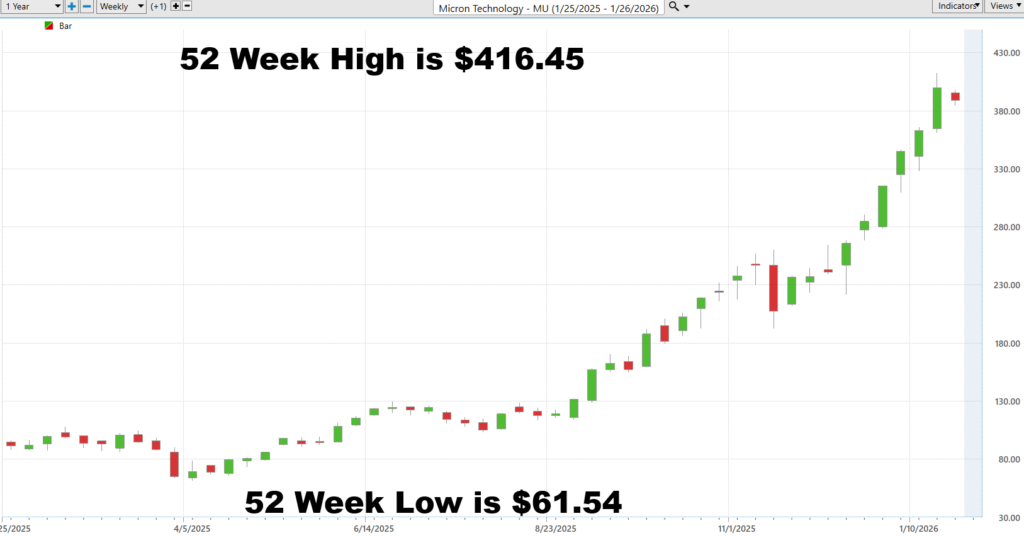
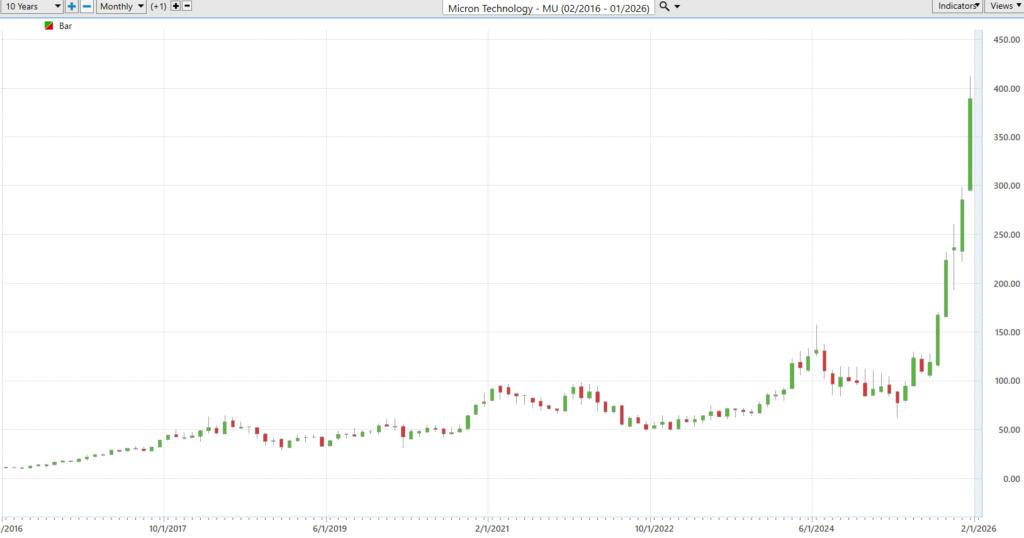
When we zoom out further and study the 10 year monthly chart we see an equally powerful trend.
Best-Case/Worst-Case Analysis
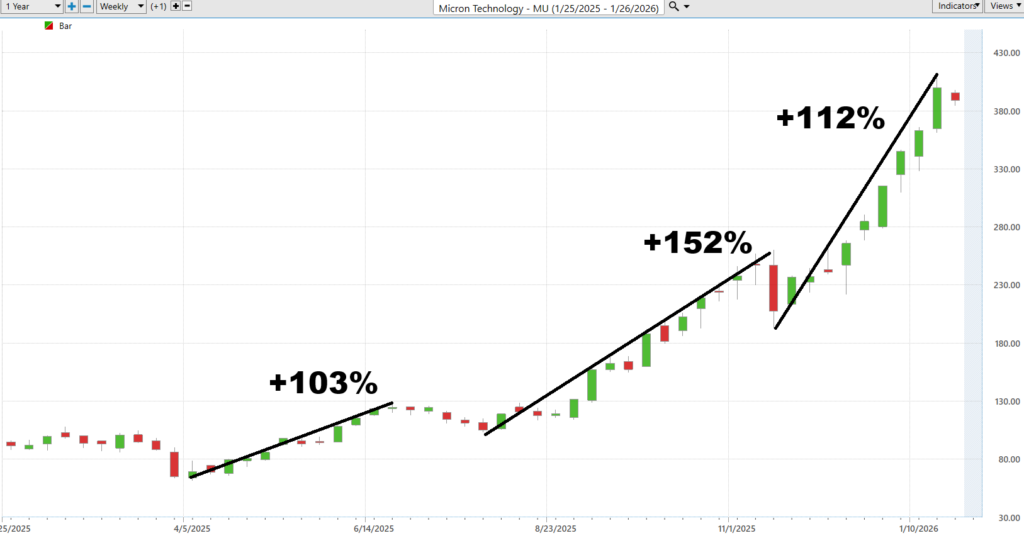
One of the most common mistakes traders make when thinking about volatility is to rely solely on forward-looking estimates or abstract measures. A simpler and often more revealing approach is to look backward with precision. By examining the last 52 weeks and measuring the magnitude of uninterrupted rallies and declines, we get a clearer picture of how a stock behaves when capital is committed and emotions are involved.
Start with the best-case scenarios. The lower chart highlights a series of sustained advances where Micron rose more than 100%, 150%, and in one case over 110% without meaningful interruption. These are not short-term spikes driven by a single headline. They are extended, disciplined rallies that unfolded over weeks and months. They tell us that when momentum aligns with fundamentals, this stock has demonstrated the ability to compound gains aggressively and reward investors who stay with the trend.
Then consider the worst-case analysis chart, which documents the other side of the experience. Over the same period, Micron experienced multiple sharp declines of 14 percent, 18%, 24%, and in one instance more than 40%. These drawdowns occurred within a broader uptrend and often without any dramatic change in the company’s long-term outlook. They were driven by shifts in sentiment, profit-taking, and recalibration of expectations, not existential threats to the business.
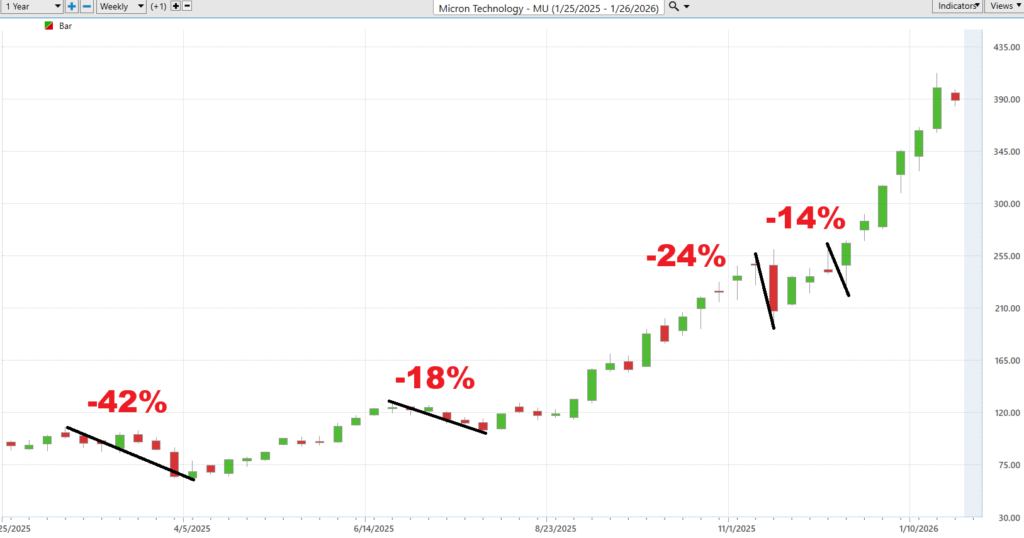
Taken together, these two perspectives provide a practical framework for understanding volatility. The stock’s recent history shows that large moves in both directions are not anomalies. They are features. By measuring uninterrupted rallies and declines, traders can develop realistic expectations about what participation in this market entails. Gains can be substantial, but they are rarely smooth. Pullbacks can be abrupt, but they have historically been survivable for those positioned appropriately.
The key insight is not that history will repeat exactly, but that behavior tends to rhyme. If the future resembles the recent past, then similar magnitude moves should be expected going forward. That understanding allows traders to approach the stock with eyes open, sizing positions accordingly and avoiding the shock that often accompanies normal volatility in a name like Micron.
In this sense, the charts serve as a reminder that volatility is not something to fear or ignore. It is something to study. By grounding expectations in what the stock has already done, traders replace surprise with preparation.
Next, we compare the performance of $MU to the broader stock market averages.
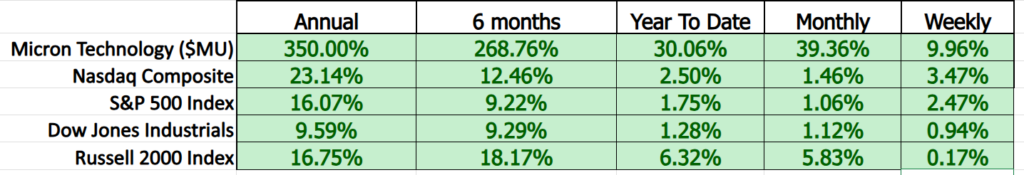
Very little interpretation required. Micron ($MU) is not merely participating in the market’s advance; it is defining it. Across every meaningful time frame, Micron’s performance stands apart from the major equity benchmarks. A 350% gain on an annual basis, nearly 270% over six months, and a 30% move year to date are not incremental improvements over the Nasdaq or the S&P 500. They are orders of magnitude different. Even on shorter horizons, the pattern holds. Monthly and weekly returns show Micron continuing to lead, suggesting that this is not just a legacy effect of a past rally, but an active, ongoing reallocation of capital toward the stock.
Leadership, in markets, is rarely subtle. Capital tends to concentrate where results are most compelling, and this comparison illustrates exactly that dynamic. While broad indexes grind higher at single-digit rates, Micron is delivering returns that signal institutional conviction and sustained demand. This level of outperformance typically reflects a confluence of strong fundamentals, favorable industry dynamics, and positive expectations about the future. For traders, the message is straightforward. Micron is not following the market. It is leading it, and that leadership is visible across every relevant time frame.
Vantagepoint A.I. Predictive Blue Line
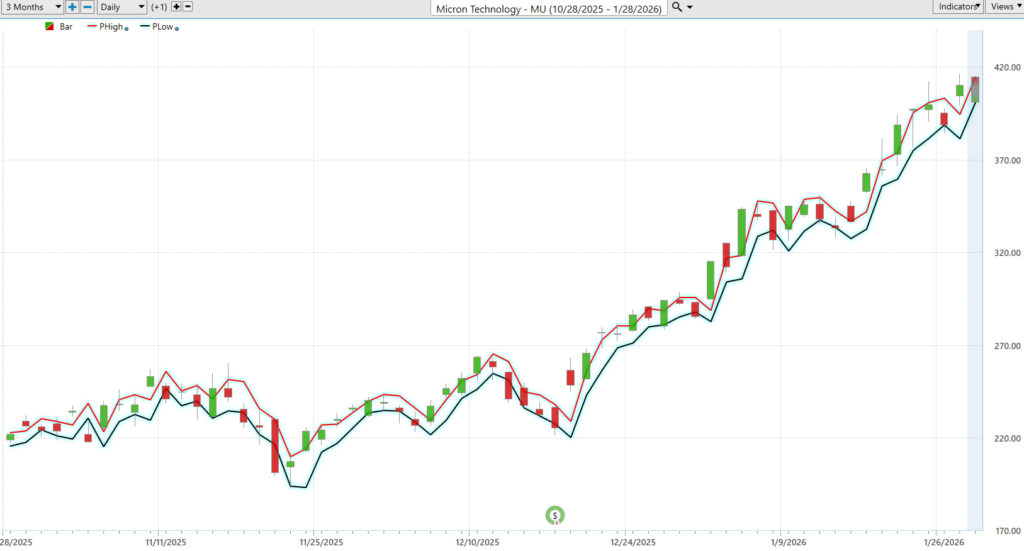
If you want a reminder that the market does not care about your feelings, this chart will happily provide it.
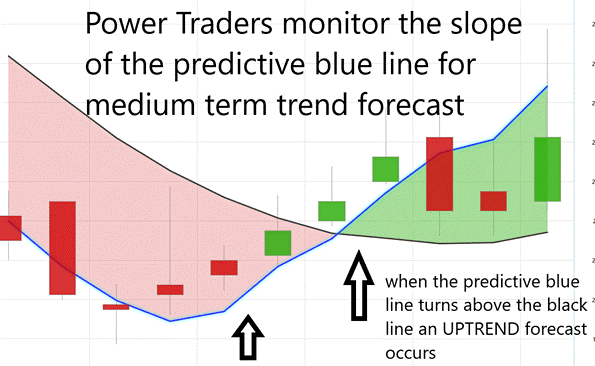
The black line is a humble, honest 10 day moving average. It tells you where price has been, which is useful in the same way a rearview mirror is useful. You can see what you just ran over. The blue line is something else entirely. That predictive blue line is where VantagePoint A.I. says price is going next. And trading it is less about philosophy and more about obedience. You do not argue with it. You observe the slope. You observe the direction. And most importantly, you observe its relationship to the black line.
When the predictive blue line turns up and crosses above the black line, that is an up forecast. It is the market saying, politely but firmly, “Get on board or step aside.” When the blue line rolls over and crosses below the black line, that is a down forecast. That is not a debate. That is the exit sign lighting up. VantagePoint traders do not guess tops, bottoms, or headlines. They follow the slope. An upward sloping blue line above the black line means the trend is intact. A downward sloping blue line below the black line means the party is over.
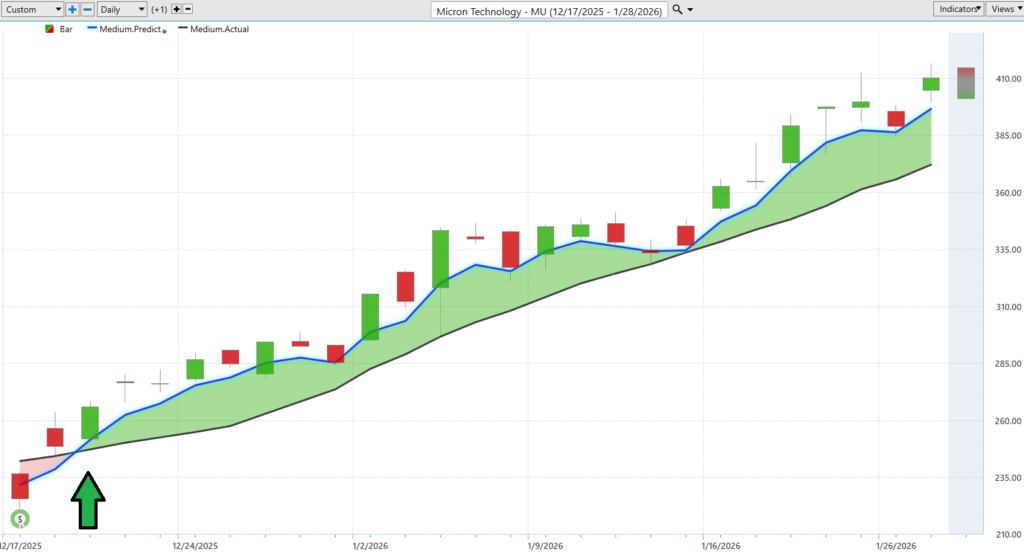
Now here is the part that tends to upset people who enjoy overthinking. The last up forecast occurred on November 17th. Since then, Micron has rallied roughly 60 percent. Not because of luck. Not because of vibes. But because the predictive blue line turned up, stayed up, and never looked back. The chart shows a series of pullbacks that looked scary to anyone watching price alone. But the blue line kept sloping higher, staying above the black line, calmly telling traders to stay seated and keep their hands inside the vehicle.
This is not magic. It is discipline. The black line tells you where price has been. The predictive blue line tells you where it is statistically likely to go next. The trader’s job is not to argue with either one. It is to respect the relationship between them. And if that sounds boring, good. Boring is how trends make money while excitement usually shows up right before the losses.
Neural Network Forecast (Machine Learning)
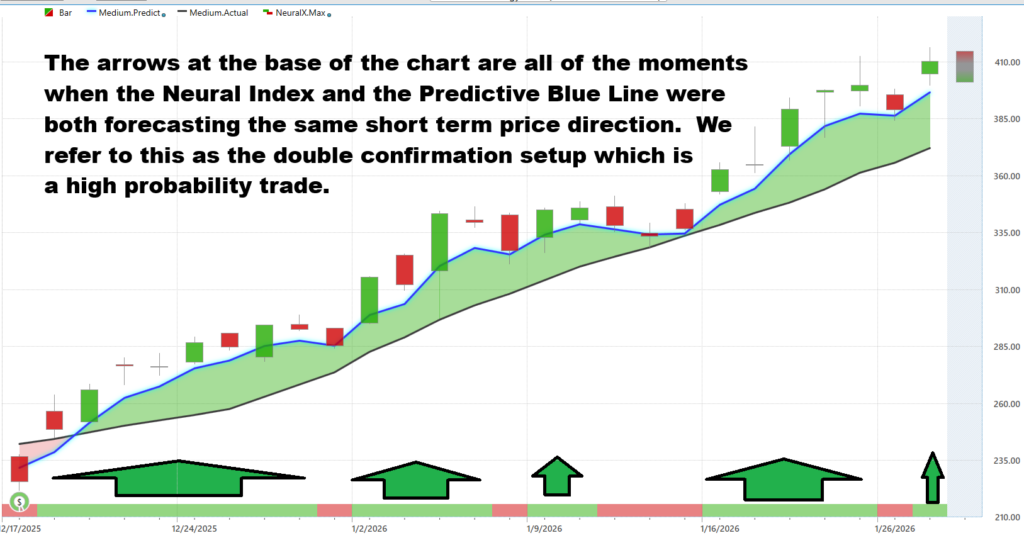
At its core, a neural network is a pattern-recognition engine. It is designed to study large amounts of historical market data, identify recurring relationships between price, time, and momentum, and then adapt as new information comes in. Unlike traditional indicators that rely on fixed formulas, a neural network continuously learns. It asks a simple question over and over: when conditions looked like this in the past, what happened next? In the context of this chart, the Neural Index is focused on short-term direction, specifically the next 48 to 72 hours. When the Neural Index turns green, it is signaling short-term strength aligned with the broader trend. When it turns red, it is not predicting a collapse. It is warning of a counter-trend pullback, a pause, or a digestion phase within an existing move.
What stands out in this graphic is how consistently those red signals line up with temporary weakness. Each time the Neural Index turns red, price has a clear tendency to drift lower over the next several sessions and, importantly, to gravitate below the predictive blue line. That behavior reinforces the role of the predictive blue line as a dynamic reference point for trend strength. Pullbacks do not negate the trend, but they do create short-term pressure that traders can anticipate rather than react to emotionally. When the Neural Index and the predictive blue line are viewed together, they provide a framework for distinguishing between normal, healthy retracements and meaningful trend changes. The takeaway is simple: short-term weakness is often signaled in advance, and price behavior around the predictive blue line offers confirmation of that temporary shift in momentum.
VantagePoint A.I. Daily Range Forecast
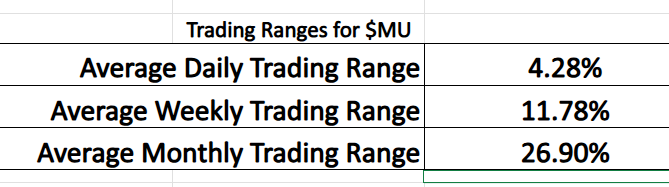
At the most basic level, what traders are trying to answer every day is not a philosophical question about valuation or a long-term debate about cycles. They want to know where opportunity and risk are likely to show up tomorrow. The graphic above makes clear why that question matters so much for a stock like Micron. An average daily trading range of more than 4%, a weekly range near 12%, and a monthly range approaching 27% tell you this is not a quiet market. Volatility is not occasional here; it is structural. Large moves are embedded in the stock’s behavior, which creates opportunity for disciplined traders and danger for those who underestimate the magnitude of potential swings.
This is where the daily range forecast becomes practical rather than theoretical. The chart below, shows how VantagePoint A.I. translates that volatility into actionable expectations by forecasting a probable high and low for the following trading day. Instead of reacting after price moves, traders can frame decisions in advance, identifying where risk is elevated and where opportunity may emerge within the expected range. The goal is not to predict the close, but to anticipate the battlefield. In a stock this volatile, knowing the likely boundaries of tomorrow’s price action can be the difference between trading with intention and simply absorbing whatever the market delivers.
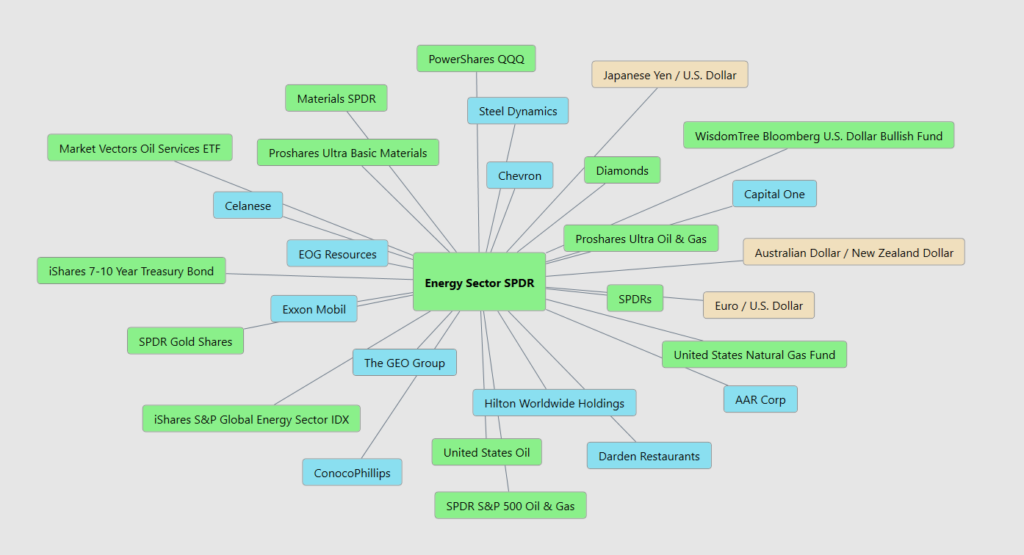
Intermarket Analysis
Micron is not moving by itself. It is connected to many other parts of the market, especially energy, materials, currencies, and big stock indexes. Think of it like a spiderweb. When one strand moves, the whole web shakes. The Energy Sector, oil prices, materials stocks, and even the U.S. dollar all pull on Micron at the same time. If energy and materials are strong, it usually means factories are running, demand is rising, and Micron benefits. If currencies or interest rates move the wrong way, that pressure can quickly flow into Micron’s stock price.
What this tells us is simple. Micron sits at the center of many powerful forces, not just tech. It is influenced by oil, metals, global trade, interest rates, and money moving between countries. When those forces line up, Micron can move fast and far. When they fight each other, the stock can turn just as quickly. This is why traders watch relationships, not just the stock itself. By watching what is happening around Micron, traders can better understand what is likely to happen next instead of being surprised after the move already happens.
Here are the 31 key drivers of $MU’s price action:
Our Suggestion
Across the last two earnings calls, Micron’s management team comes across as confident, but more importantly, consistent. The tone is measured rather than promotional, and the messaging aligns closely from one quarter to the next. Management repeatedly emphasized that results came in at or above the high end of guidance and framed recent performance as the outcome of deliberate decisions made earlier in the cycle. They pointed to tight supply conditions, improving pricing, and a growing contribution from data center and high-bandwidth memory as evidence that the business is executing against its stated objectives. The message was not that conditions are perfect, but that Micron is operating from a position of strength and control.
That said, management has not tried to eliminate uncertainty from the narrative. The core risk remains the same one that has always defined the memory business: cyclicality. Supply discipline is working now, but it is not permanent. As capacity eventually comes online, pricing power can weaken. Another risk lies in execution, particularly around advanced memory products where yields, timelines, and customer qualification matter. These risks are trackable. Investors can monitor memory pricing trends, changes in capital spending plans across the industry, and any shift in management’s language around supply tightness versus balance. Subtle changes in those signals often precede larger moves in the stock.
Market calendars currently estimate an earnings report in the second half of March 2026, but that date should be treated as provisional until Micron issues an official release through its investor relations channel.
The reality is that the artificial intelligence boom is built on memory. Every system that appears intelligent on the surface depends on enormous amounts of high-bandwidth memory to function behind the scenes. Nvidia may dominate the headlines, but Micron plays a critical supporting role, supplying the infrastructure that allows these systems to operate at scale. That dynamic helps explain why the stock’s recent performance reflects sharp reappraisal rather than gradual appreciation.
At the same time, this remains a cyclical business. Periods of strong demand can drive exceptional profitability, but history suggests those conditions do not last indefinitely. When supply catches up or demand softens, pricing can reset quickly. The opportunity is real, but so is the volatility.
This is a stock that rewards discipline, particularly around position sizing and risk management. For active traders, tools like the VantagePoint A.I. Daily Range forecast are designed for precisely this environment, helping define probable short-term boundaries so decisions are made proactively rather than in response to market noise. The takeaway is not caution for its own sake, but preparation.
Practice great money management on all your trading.
It’s not magic.
It’s machine learning.
Disclaimer: THERE IS A HIGH DEGREE OF RISK INVOLVED IN TRADING. IT IS NOT PRUDENT OR ADVISABLE TO MAKE TRADING DECISIONS THAT ARE BEYOND YOUR FINANCIAL MEANS OR INVOLVE TRADING CAPITAL THAT YOU ARE NOT WILLING AND CAPABLE OF LOSING.
VANTAGEPOINT’S MARKETING CAMPAIGNS, OF ANY KIND, DO NOT CONSTITUTE TRADING ADVICE OR AN ENDORSEMENT OR RECOMMENDATION BY VANTAGEPOINT AI OR ANY ASSOCIATED AFFILIATES OF ANY TRADING METHODS, PROGRAMS, SYSTEMS OR ROUTINES. VANTAGEPOINT’S PERSONNEL ARE NOT LICENSED BROKERS OR ADVISORS AND DO NOT OFFER TRADING ADVICE.


