


This week’s ai asset spotlight is Newmont Goldcorp ($NEM)
Newmont, the world’s largest gold miner, is navigating the turbulence in gold prices with the resilience of a seasoned heavyweight. Its stock has surged on the back of climbing gold prices, stronger-than-expected earnings, and a bold push to streamline through asset sales. Competitors like Barrick, Agnico Eagle, and Franco-Nevada are in the same arena, but Newmont’s recent execution has set it apart. The company’s balance sheet tells the story — rising cash reserves, steady debt reduction, and a focus on its most profitable assets. For traders, the message is clear: the setup is powerful, the volatility is real, and while opportunity is abundant, so is the need for discipline on the downside.
Newmont has roots stretching back to 1921, but what matters today is its headquarters sits in Greenwood Village, Colorado, and it employs tens of thousands (employees + contractors) across continents. Leadership is in flux: CEO Tom Palmer is set to retire by end of 2025, and rising through the ranks is Natascha Viljoen, who’s already president and COO. The company swallowed Goldcorp in 2019 and then Newcrest in 2023, aiming to be the biggest, boldest gold name out there.
So, what does Newmont do, and how? They dig gold — and along the way, dig for copper, silver, zinc, lead. They run huge mines, extract ore, refine it, manage environmental regulation, and sell into world markets. Their strategy nowadays is “focus on tier-1 assets, get rid of the distractions, optimize cost structure, reduce debt, and return capital to shareholders.” The merger with Newcrest came with a promise: scale, more reserves, geographic diversification, and long mine lives.
Let’s talk competitors. Here are the big names jostling in the gold mining pit:
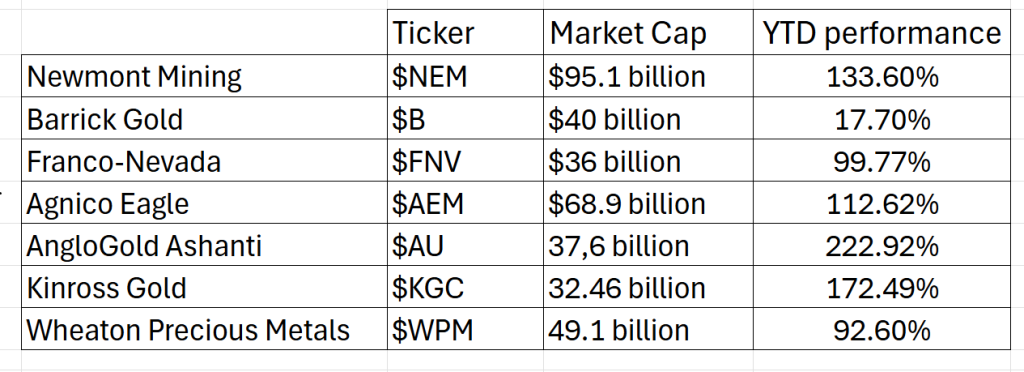
The key contrast: Newmont is operator + owner + risk taker. Royalties/streamers like Franco-Nevada get paid while avoiding many operational headaches; miners like Newmont take all the upside and all the risk.
Now look at the revenue and earnings table and you can quickly see the financial journey $NEM has had over the last 5 years, and it certainly has not been easy.
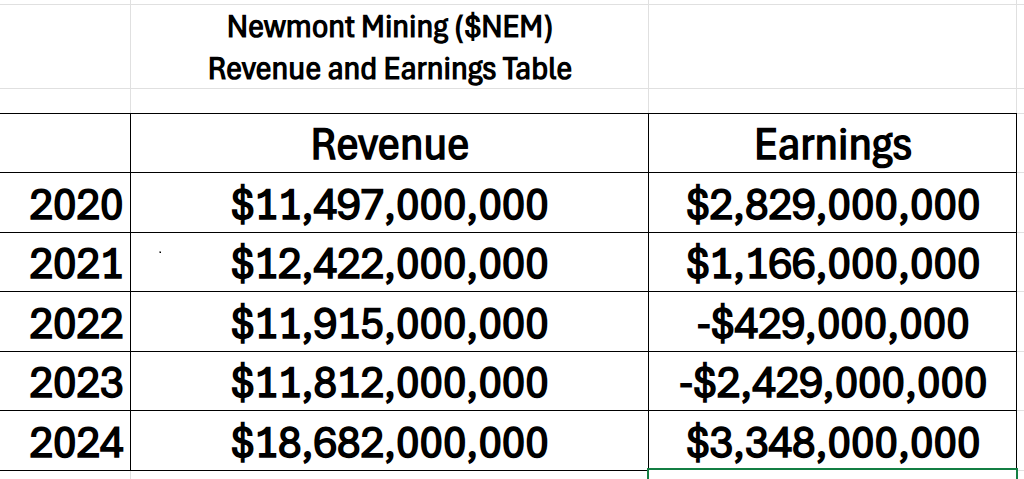
Look at that grid and tell me this isn’t a heavyweight slugging its way through a financial bar fight. From 2020 to 2023, Newmont’s earnings bounced around like a drunk boxer — up big, down hard, even taking a knockout punch in 2023 with a $2.4 billion loss. But then 2024 rolls in like a comeback movie — revenue blasting up to $18.7 billion, profits swinging back to $3.3 billion. That’s not luck, that’s leverage — higher gold prices, tighter cost control, and the Newcrest acquisition firing on all cylinders. Traders, this is what a turnaround looks like when the biggest gold miner in the world gets its groove back and decides it’s not done yet.
So, what’s going right for Newmont? Gold is on a tear. Macro uncertainties, inflation fears, central bank jitteriness — all feed the safe-haven appeal of gold. Because Newmont is one of the largest scale miners, it can ride that wave better than many. The merger acquisitions give it more reserves and optionality. The divestment program (selling non-core mines, trimming equity stakes) frees cash to pay down debt and repurchase stock. The CEO succession plan is clean. The mood in the mining sector is bullish.
But there are snags. Costs are volatile — fuel, energy, labor, regulatory expenses, environmental compliance. If gold price collapses (it happens), mining margins can evaporate. Integrating Newcrest’s operations may bring unforeseen hiccups. Divesting assets means giving up future optionality. Political risk in mining jurisdictions (Peru, Ghana, etc.) can hit operations. Leadership transitions always carry execution risk.
Here’s the verdict for traders: Newmont is not a sleepy dividend yield stock anymore — it’s become a semi-aggressive momentum play with safety features. The gold price tailwind gives it room to run; the balance sheet and divestitures give downside protection. It’s a textbook trade candidate for those who like directional exposure in the commodities space but want a heavyweight stock that can move. Keep your eyes on gold price, production figures, cost per ounce (all-in sustaining cost), and upcoming catalysts like mine expansions or asset sales. With proper risk control, $NEM can serve as both a trend play and a hedge in turbulent macro regimes.
In this stock study, we dig into the key indicators and metrics that shape our decisions on whether to buy, sell, or sit out a trade. These measurements aren’t random guesses — they form our framework and behavioral compass, grounded in clean data and supercharged by predictive intelligence.
- Wall Street Analysts Price Forecasts
- 52 Week High and Low Boundaries
- Best-Case / Worst-Case Scenario Analysis
- VantagePoint A.I. Predictive Blue Line
- Neural Network Forecast (Machine Learning)
- VantagePoint A.I. Daily Range Forecast
- Intermarket Analysis
- Our Suggestion
While our decisions rest firmly on artificial intelligence forecasts, we still give the company’s fundamentals a quick once-over to understand the financial playing field it’s competing in. For $NEM, this broader context helps us judge how strong the A.I. signal really is, by comparing it against the economic and industry-winds blowing around it.
Wall Street Analysts Price Forecasts
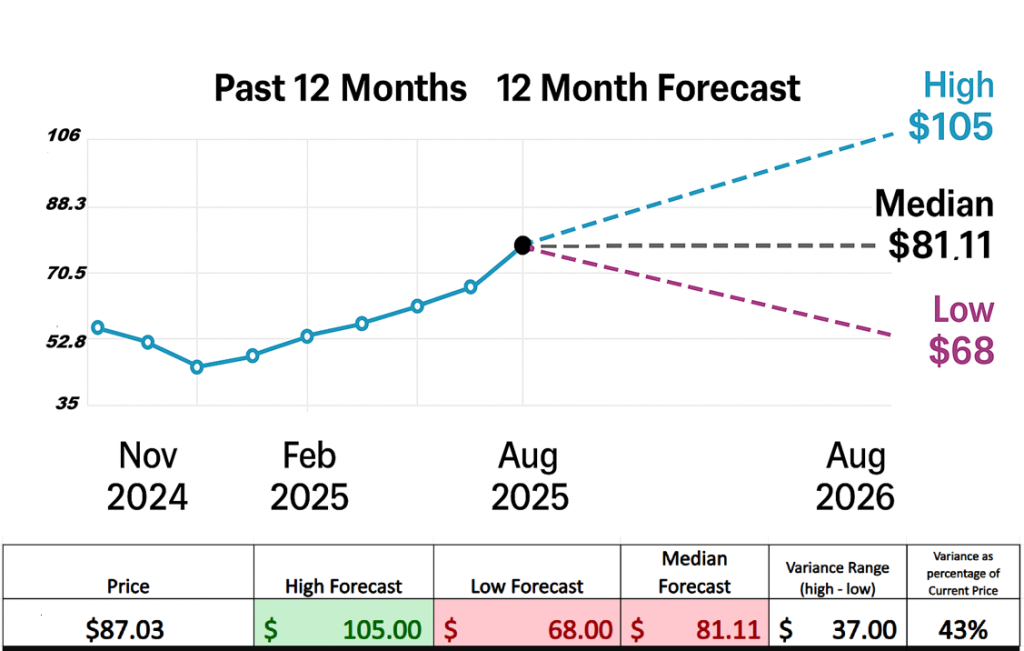
The chart above is where the big dogs bare their teeth. Every trader worth their caffeine wants to know two things before jumping into the pit: how high the bulls think this thing can run and how deep the bears think it can crash. These price targets aren’t pulled out of thin air — they come from analysts who eat, sleep, and breathe this stock like its oxygen. They’ve got Bloomberg terminals glowing at 3 a.m. while you’re drooling on your pillow.
Here’s the deal: fifteen of those hotshots have put their reputations on the line. The high forecast sits at $105, the low down at $68, with the middle ground hanging around $81.11. That spread — thirty-seven bucks of daylight between the dreamers and the doomsayers — is your volatility clue. It’s the size of the boxing ring you’re stepping into.
And the chart? It tells the whole story without saying a word. You’ve got the past trailing like a bruised fighter catching his breath, and the forecast lines slicing into the future — one soaring, one diving, one dead steady in between. It’s not fortune-telling; it’s Wall Street’s version of mood swings, and the variance tells you exactly how wild the ride might get.
52 Week High and Low Boundaries
Traders understand the power of the 52-week high and low — it’s the market’s scoreboard for who’s winning and who’s getting clobbered. The low marks the place where optimism goes to die, where losses stack up and confidence collapses. The high? That’s victory territory — the zone where momentum builds, portfolios swell, and the crowd rushes in pretending they knew it all along. When a stock trades near its high, it’s signaling strength and conviction. When it hugs the low, it’s waving a flag of surrender.
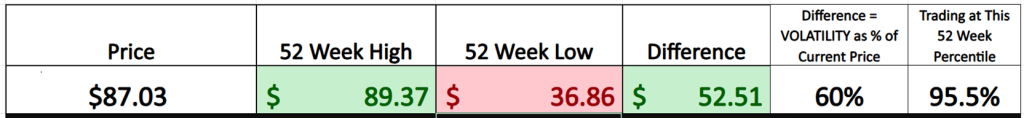
You’re looking at a textbook breakout story — and the kind of chart that gets traders fired up. Over the last 52 weeks, Newmont Mining has gone from the basement to the penthouse, blasting off from a low of $36.86 to a new high at $89.37. That’s a 60% volatility range — plenty of energy for active traders who thrive on movement.
What’s really striking here is where we are now: sitting at the 95th percentile of the 52-week range. That’s not just momentum — that’s conviction. It tells us the market believes in this rally, that big money is rotating back into gold and the miners are reaping the benefits.
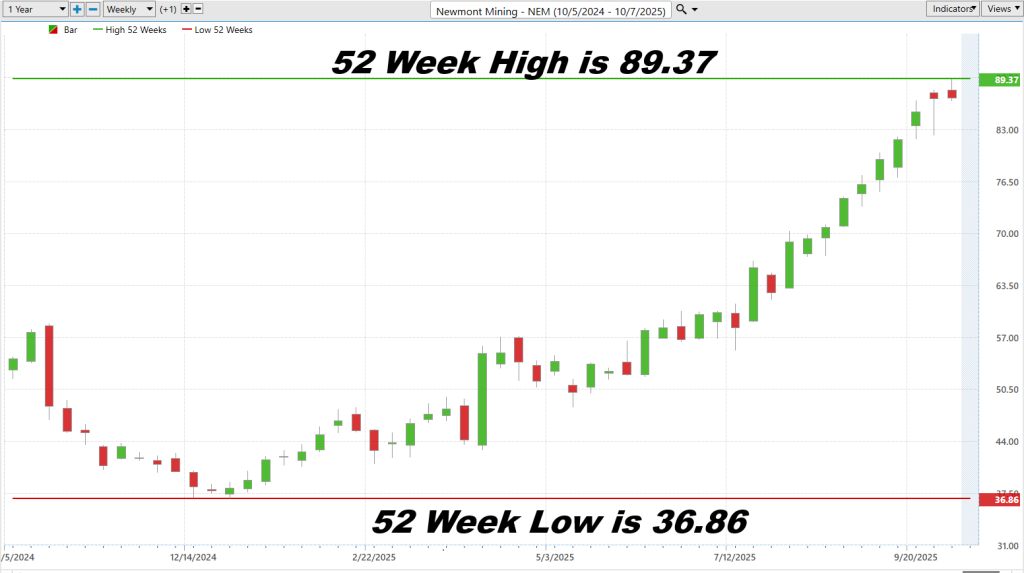
And look at that price action. Week after week, the bulls kept pushing, chewing through resistance levels like they weren’t even there. This isn’t a tired grind higher — it’s a power trend. As long as gold stays strong and real yields stay soft, traders will keep seeing opportunity here.
Bottom line? $NEM isn’t drifting — it’s leading. If you’re a trader, you don’t fade strength like this. You track it, respect it, and look for the next setup to ride the wave.
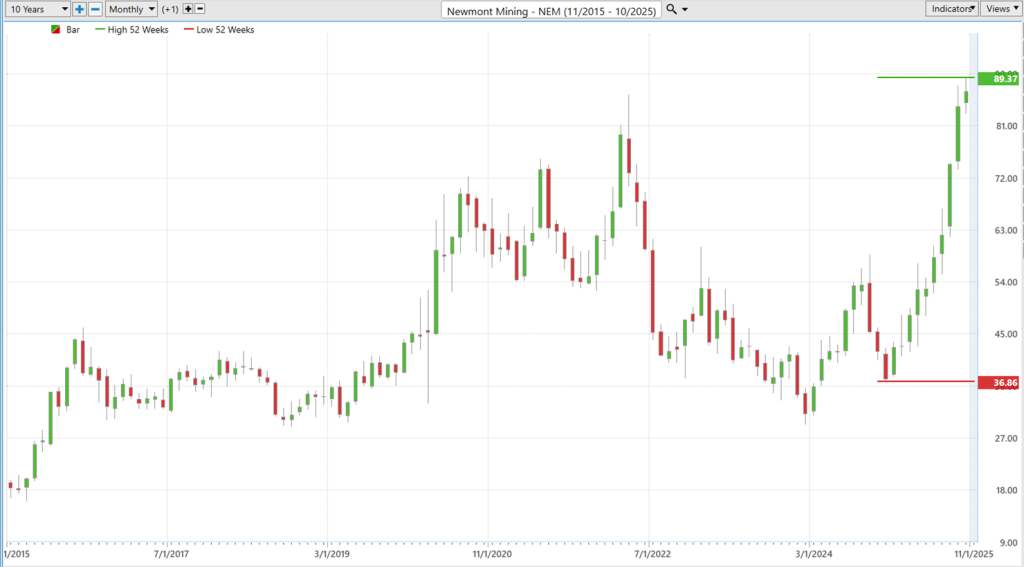
What you’re seeing on this 10-year chart of Newmont Mining is a declaration. When a stock simultaneously breaks through both its 52-week and 10-year highs it’s rewriting its own narrative. These moments are rare, and when they happen, they speak volumes about conviction — from the boardroom to Wall Street trading desks.
This kind of breakout tells us that the company isn’t just surviving the cycles of gold, inflation, and central bank policy — it’s dominating them. It means the market has reassessed its risks, re-rated its potential, and is now pricing in a new chapter of growth.
In a world where most companies stumble before scaling new peaks, Newmont’s ability to surge beyond both short- and long-term resistance levels signals something profound: it’s clearing the obstacles that held it back for years. And when that happens, traders don’t just chase the move — they study it, because leadership like this doesn’t come along often.
Best-Case / Worst-Case Scenario Analysis
Years ago, I met a trader who’d seen it all — bull markets, crashes, everything in between. We were talking about risk and reward, and he said something that’s stayed with me ever since: “The only thing we can know with 100% certainty is what’s already happened.”
It was a deceptively simple insight. If the future behaves like the recent past, then the data behind those rallies and declines becomes more than history — it becomes a map. For traders, understanding that magnitude isn’t optional. It’s the foundation for every calculated move that follows.
Volatility, he said, isn’t noise — it’s a message. And in today’s markets, where speed and leverage amplify every tick, that message is louder than ever. Volatility tells you where the pressure points are. It shapes conviction, position sizing, and ultimately, survival.
The higher the volatility, the sharper the edge. But that edge cuts both ways. A 10% move in a mega-cap makes headlines; in a high-beta stock, it’s Tuesday. That’s the scale traders live and die by — one misstep, and even a good thesis can unravel before you blink.
That’s why the 52-week range matters. It doesn’t tell you the future, but it quantifies emotion — greed, fear, relief, denial — the full psychological bandwidth of the market. When a company’s fundamentals remain intact, that range becomes more than a statistic; it’s a strategic lens for seeing where opportunity and danger intersect.
So, before you put capital at risk, look at the biggest uninterrupted moves on the weekly chart. Markets move like elastic — stretch too far, too fast, and something snaps. Magnitude matters because it turns chaos into context. It’s what separates trading with clarity from trading on faith.
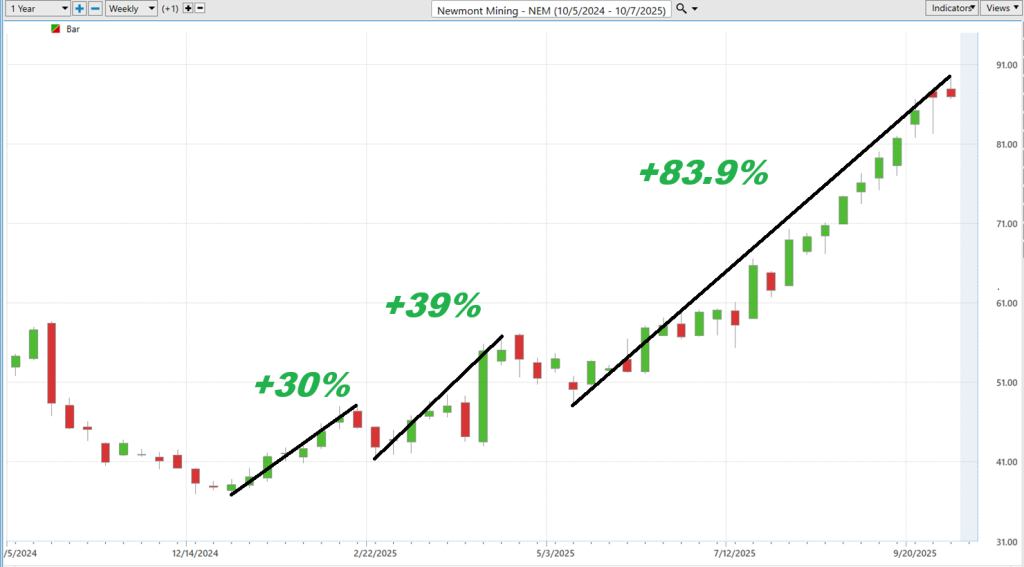
First, we look at the best-case scenario:
Next, we study the worst-case scenario:
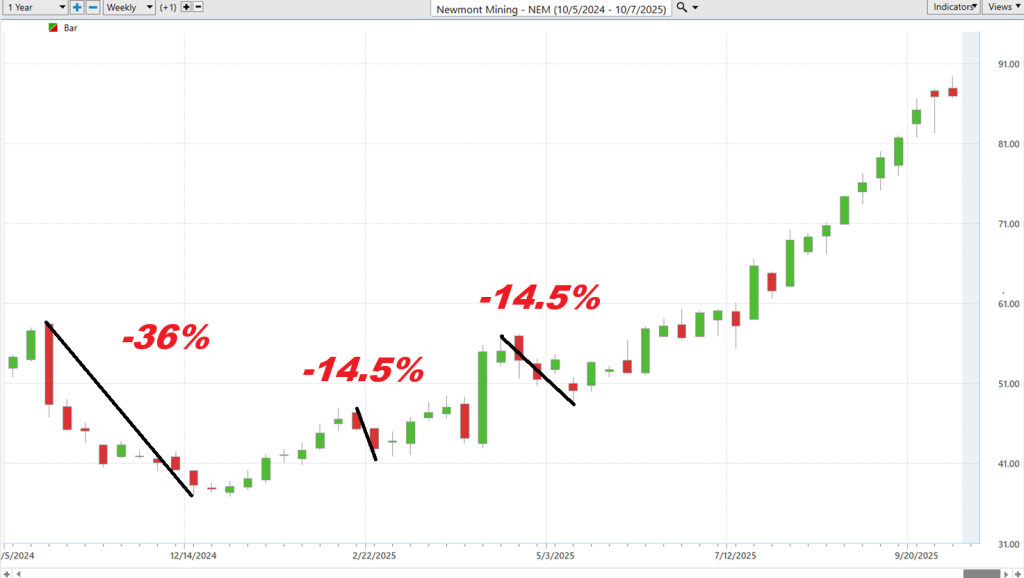
When you look at these two charts side by side, you’re seeing volatility turned into something tangible — not chaos, but rhythm. The first chart shows the power of conviction: rallies of 30%, 39%, and a staggering 83.9% remind us why traders chase momentum and why timing matters more than theory. The second chart, with declines of 36% and 14.5%, is the other side of that same coin — the price you pay for opportunity in a market that never moves in straight lines.
We perform this kind of exercise with every trade because it takes volatility out of the abstract. It’s not just a statistic — it’s a lived experience of price movement, showing traders where conviction builds and where confidence cracks.
Together, these charts give us a full picture. Analysts tell us what they think volatility means, the market tells us how it feels. By measuring both the largest rallies and deepest drawdowns, we’re not guessing at the risk — we’re defining it. And in doing so, we fine-tune our understanding of where the next big move might come from.
Lastly, we compare $NEM to the broader stock market averages.
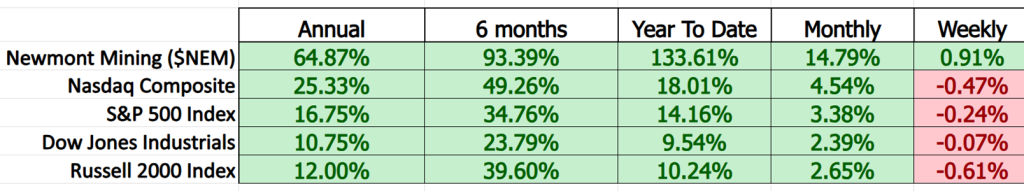
Across every major time frame — weekly, monthly, six-month, and annual — Newmont Mining has done something few stocks can claim: it has outpaced every major benchmark on the board. The Nasdaq, S&P 500, Dow, and Russell 2000 all look sluggish by comparison. Year-to-date, Newmont’s 133.6% gain isn’t just impressive — it’s a statement of dominance.
This isn’t the kind of move that happens by accident. It reflects a shift in market psychology, where capital is rotating toward hard assets and balance sheet strength. Traders watching the data know that when a stock like Newmont consistently outperforms across multiple time frames, it’s not just momentum — it’s leadership.
In a market where indexes are grinding higher on mixed signals, Newmont’s chart looks decisive. The story here isn’t just about gold — it’s about conviction. And right now, Newmont is writing its own script, one outperforming headline at a time.
VantagePoint A.I. Predictive Blue Line
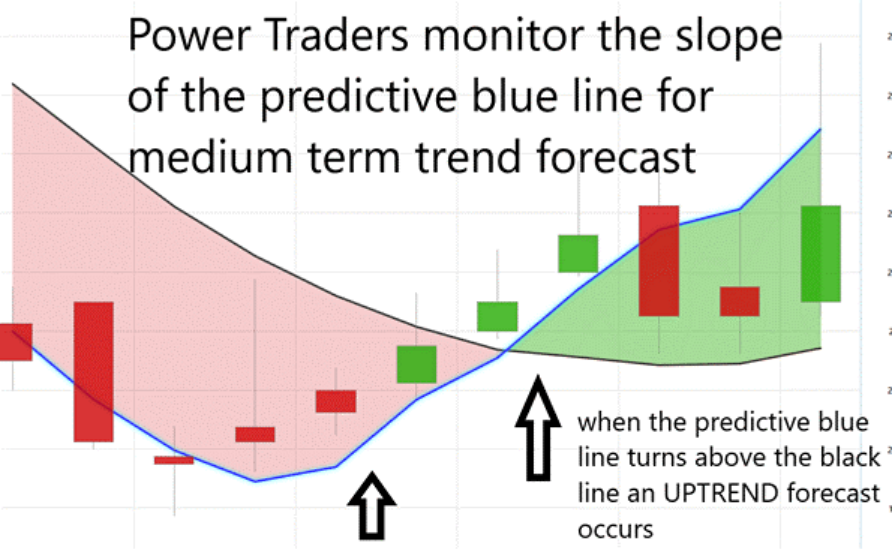
In a market where volatility has become the rule, not the exception, the VantagePoint A.I. Predictive Blue Line stands out as one of the few tools that brings order to the chaos. It doesn’t just follow the trend — it forecasts it. Every day, the Blue Line recalculates where the market should be heading, giving traders a forward-looking perspective instead of relying on yesterday’s price action. When the predictive line crosses above the actual price, it’s signaling strength; when it falls below, caution is warranted.
The real power of this A.I.-driven indicator isn’t in its complexity, but in its clarity. It translates layers of intermarket data — interest rates, commodities, currencies, and related stocks — into a single actionable signal. For traders, that means a defined framework for entry, exit, and risk management, all driven by probabilities instead of emotion.
In an age when headlines can swing markets faster than earnings reports, the Predictive Blue Line acts as a compass — recalibrating daily, filtering out noise, and offering a disciplined edge. It doesn’t claim perfection, but it offers something arguably more valuable: consistency in a world addicted to chaos.
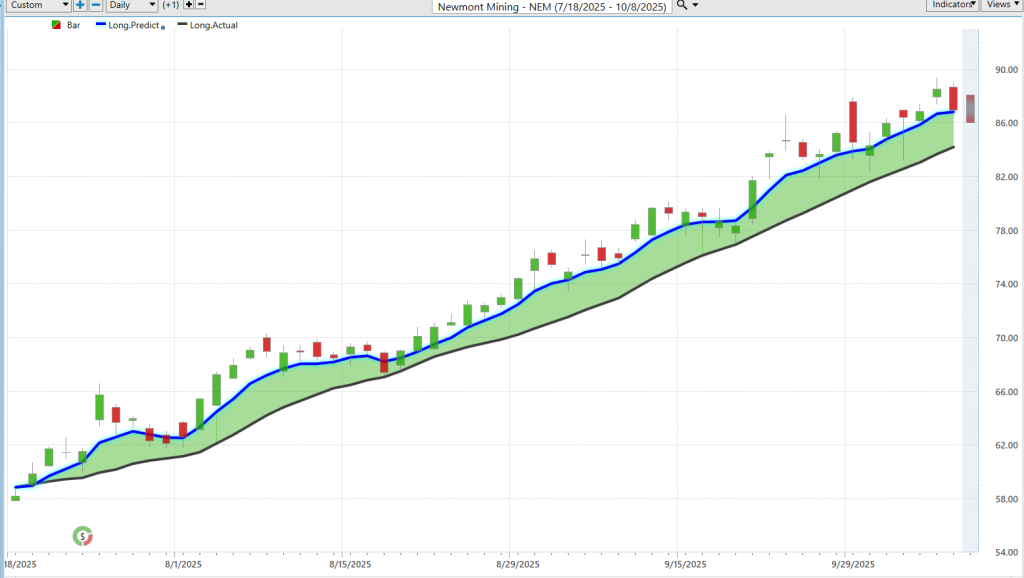
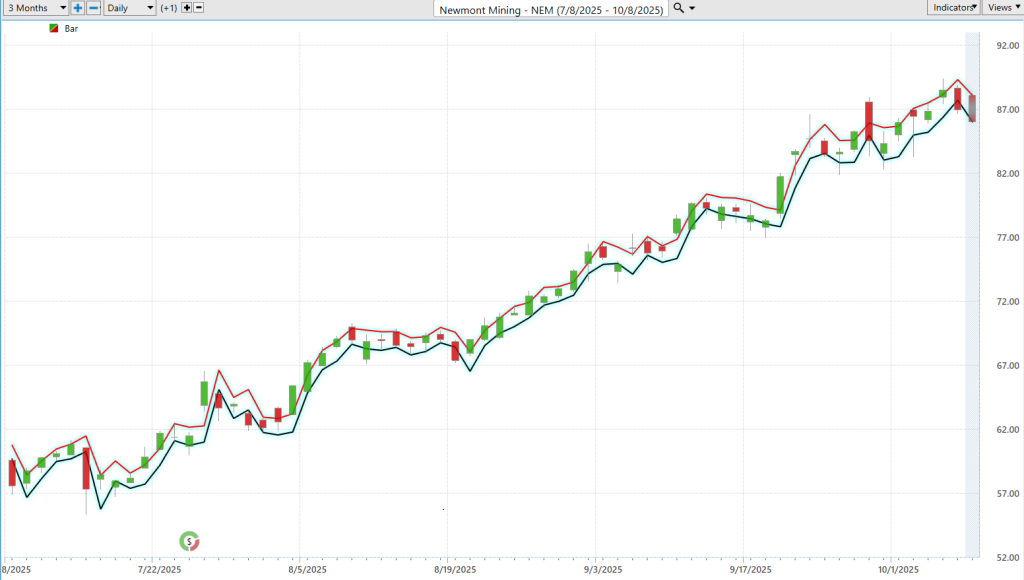
Over just 55 trading sessions, Newmont Mining’s predictive blue line delivered a remarkable 48% move — and the chart tells the story. What sets VantagePoint A.I. apart is how it empowers traders to look beyond the noise. The slope of that blue line isn’t just a visual cue — it’s a forward-looking signal of momentum. When it steepens, strength is building. When it flattens, the market’s pulse is slowing.
VantagePoint family members watch that slope like pilots monitor altitude — not reacting to turbulence but reading the instruments that forecast it. In an environment defined by volatility and speed, the predictive blue line gives traders what most never have: the confidence to anticipate, not just react.
Neural Network Forecast (Machine Learning)
A neural network is one of the most astonishing creations in modern finance — a digital brain trained not by textbooks or intuition, but by experience. It’s built from layers of interconnected “neurons” that work just like ours: they take in information, process it, recognize patterns, and get smarter over time. Except unlike a human trader, it doesn’t get greedy, tired, or swayed by headlines. Feed it millions of price points, volume data, global correlations, and it learns — not just to see trends, but to anticipate them. That’s what makes it the ultimate secret weapon in today’s markets.
In trading, neural networks strip away the noise that drives most people to make bad decisions. They aren’t fortune tellers — they’re probability machines. They weigh what matters most and tell you where the pressure’s building before the chart even shows it. That’s how they turn volatility from chaos into clarity. You’re no longer reacting to what just happened — you’re preparing for what’s likely next.
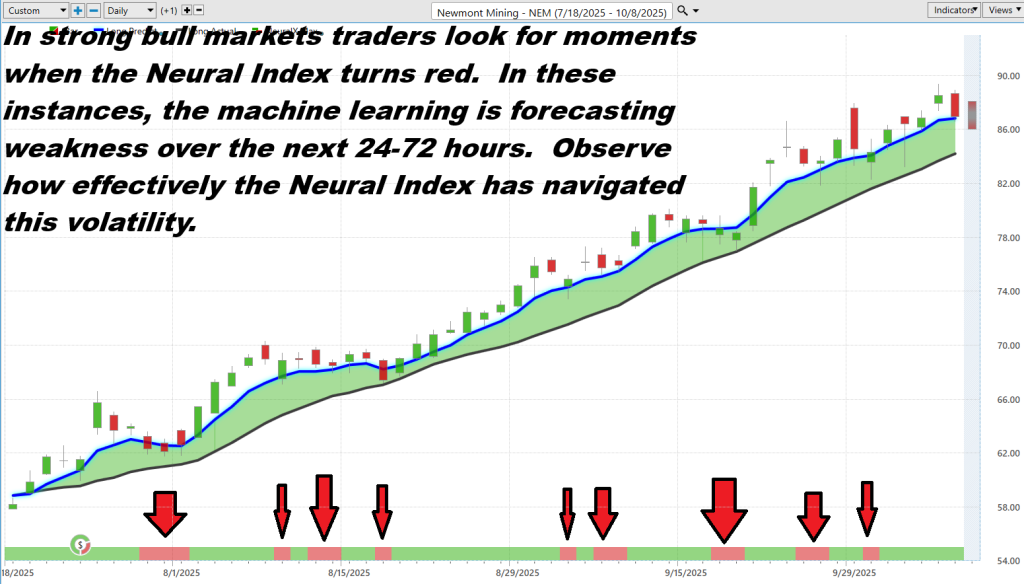
Now, let’s look at the attached chart — the proof in living color. That green-and-red strip at the bottom is the Neural Index. The blue line above it is the Predictive Blue Line. Together, they form one of the most powerful one-two punches in trading. When both turn green, it’s not just optimism — it’s confirmation. The data is saying, “momentum’s real, stay in.” When the Neural Index flips red, it’s the A.I.’s quiet whisper to prepare for turbulence. It’s forecasting weakness over the next 24–72 hours, signaling that prices may revisit or dip below the blue line. Look at the arrows — every red flash aligns with a short-term cooling, even as the bigger uptrend keeps grinding higher. That’s not luck. That’s intelligence — measured, mechanical, and repeatable.
Here’s the beauty of it all: traders don’t need to play clairvoyant anymore. This system lets the technology chew through the chaos — millions of price points, correlations, and signals — while you focus on one simple question: Is the trend strong, weak, or dead? The Neural Index defines direction. The Predictive Blue Line defines strength. Together, they slice through the noise, shut down the second-guessing, and turn “maybe” into a trading decision you can back with unshakable confidence.
VantagePoint A.I. Daily Range Forecast
When traders study the market, they don’t crave perfection — they crave precision.
First let’s look at the average daily, weekly and monthly trading ranges for $NEM over the past year:
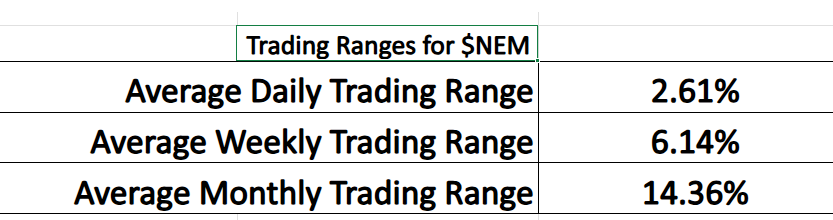
The graphic above tells that story in full color. Newmont Mining’s predictive daily range forecast reveals the invisible scaffolding of price movement. Every session, the forecast draws a corridor of expected volatility—what’s likely, what’s possible, and what’s improbable. In practice, that corridor becomes a trader’s playbook. You know where risk hides and where opportunity begins. That’s the advantage VantagePoint A.I. delivers daily: clarity in a world that rarely offers it.
Volatility in NEM has been exceptionally strong, with daily moves averaging 2.61%, weekly swings north of 6%, and monthly ranges exceeding 14%. In that kind of market, intuition alone is a liability. What matters is measurement. The predictive range adjusts to the rhythm of the market — narrowing as trends consolidate, expanding as momentum builds. And when you watch how precisely the price action has respected these bands, you start to realize something deeper: this isn’t hindsight. It’s foresight, quantified.
That’s what every trader quietly wants — clarity in the storm. A roadmap through the minefield. You don’t have to swing for the fences every day. You take small, deliberate, and controlled bites out of a massive, raging trend. Because in the long game of trading, survival isn’t about guessing the next move — it’s about staying aligned with the probabilities that matter most.
Intermarket Analysis
At its core, Newmont Mining isn’t just a gold company — it’s a barometer of the global economy’s confidence, anxiety, and appetite for real assets. Its price is driven by three core economic forces: the direction of gold prices, the strength of the U.S. dollar, and interest-rate policy. When inflation runs hot or faith in fiat money cools, gold shines — and Newmont’s margins expand like clockwork. Conversely, when the dollar flexes or yields rise, gold weakens, capital rotates elsewhere, and mining stocks take a hit. Add in energy prices — since fuel powers every mine on Earth — and you’ve got the heartbeat of $NEM’s valuation.
Now, this is where intermarket analysis comes in. It’s the study of how all these markets talk to one another — commodities, currencies, bonds, and equities. It recognizes that no asset trades in isolation. A rising dollar can crush gold; a falling yield curve can ignite it. Oil, silver, and even Treasury bonds move in patterns that foreshadow shifts in sentiment. For traders, intermarket analysis is like switching from a local weather report to a satellite view — you see not just what’s happening above you, but the storms forming a thousand miles away.
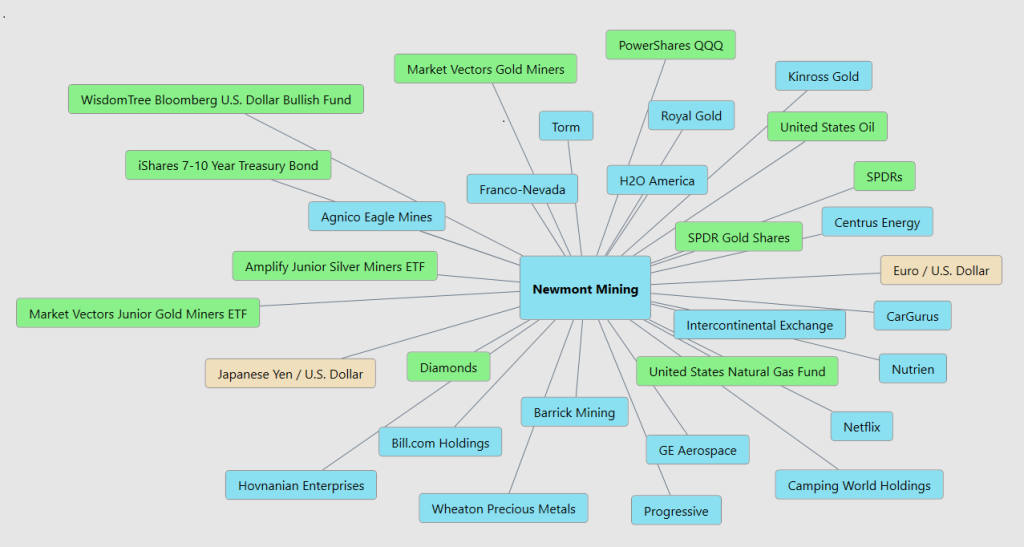
That’s exactly what this intermarket graphic shows — a 31-point ecosystem surrounding Newmont Mining. You can see its world: gold miners like Barrick, Agnico, and Franco-Nevada; energy markets that dictate production costs; the dollar and yen shaping relative value; and ETFs like SPDR Gold Shares and the Junior Miners ETF mirroring institutional demand. There’s even the broader economy in play — the Nasdaq, Dow, and natural-gas funds reflecting risk appetite. Study this chart and you see more than connections — you see capital flow. Because when you understand what pulls on $NEM, you start to see the ripple effects across every major market. And that’s how real traders stay ahead — not guessing at gold prices but tracking the global conversation that decides them.
Our Suggestion
If you’ve listened to Newmont’s last earnings call, there’s a distinct change in tone — confidence replacing caution. After several quarters of restructuring, cost optimization, and a painful integration cycle, management finally sounds not just stable but optimistic. CEO Tom Palmer’s message has shifted from survival to execution: production is climbing, costs are stabilizing, and free cash flow is reemerging. The market has noticed — and for good reason.
In the past year, Newmont has staged a genuine turnaround. The company that once lagged its peers is now delivering on guidance, reducing leverage, and returning capital to shareholders. Wall Street, long skeptical, has started to rewrite its narrative on $NEM. With gold trading near multi-decade highs and Newmont’s output back on track, the leverage to spot prices is enormous. Analysts who once viewed it as a value trap now see it as a high-beta play on the next leg of the metals cycle.
Momentum, both operational and psychological, has swung in Newmont’s favor. The stock’s performance speaks volumes — consistently outpacing major indexes and peers alike. For traders, this isn’t just about gold; it’s about a leadership story reborn in real time. Place $NEM on your watchlist. We suspect its resurgence isn’t done yet — and the volatility ahead could translate into some of the most compelling short-term trading opportunities of the year.
Monitor the VantagePoint A.I. daily range forecast for short-term trading opportunities.
Practice great money management on all of your trades. $NEM is incredibly volatile. Position sizing is a priority here.
It’s not magic.
It’s machine learning.
Disclaimer: THERE IS A HIGH DEGREE OF RISK INVOLVED IN TRADING. IT IS NOT PRUDENT OR ADVISABLE TO MAKE TRADING DECISIONS THAT ARE BEYOND YOUR FINANCIAL MEANS OR INVOLVE TRADING CAPITAL THAT YOU ARE NOT WILLING AND CAPABLE OF LOSING.
VANTAGEPOINT’S MARKETING CAMPAIGNS, OF ANY KIND, DO NOT CONSTITUTE TRADING ADVICE OR AN ENDORSEMENT OR RECOMMENDATION BY VANTAGEPOINT AI OR ANY ASSOCIATED AFFILIATES OF ANY TRADING METHODS, PROGRAMS, SYSTEMS OR ROUTINES. VANTAGEPOINT’S PERSONNEL ARE NOT LICENSED BROKERS OR ADVISORS AND DO NOT OFFER TRADING ADVICE.


