| This week’s stock analysis is NVIDIA -$NVDA |
NVIDIA is a technology company focused on providing powerful visual computing solutions, founded in 1993 by two “technology gurus”, Jensen Huang and Curtis Priem. The company made a name for itself with its chip design and invention. It is headquartered in Santa Clara, California and has become an influential player in the chip market by producing high quality chips for gaming platforms and beyond. Their products are well known for their cutting-edge capabilities, being one of few companies to provide the level that was once thought to be unattainable performance
Equally influential is their strength when it comes to Artificial Intelligence (AI) technologies, providing key support platform within this relatively nascent industry. Together these points of leadership make NVIDIA a dominant feature of the gaming and AI chip markets, at present as well as into the future.
They currently employ more than 15,000 employees globally and are known for their wide range of products from graphics cards to data centers. The main competitors of NVIDIA are AMD (Advanced Micro Devices Inc.) and Intel, both big names in the tech industry. Among other risks, the biggest challenge facing them is obtaining an uninterrupted supply of raw materials such as silicon to maintain their production volume and quality. Additionally, issues with power regulation could also prove difficult to manage if the supply chain isn’t adjusted quickly enough.
As a leader of its industry, NVIDIA has numerous competitors in all of these sectors. Its top five main competitors are AMD, Intel Corporation, Samsung Electronics Co., Ltd., Qualcomm Technologies Inc., and Xilinx Inc.. All five of these major companies produce products that challenge NVIDIA’s offerings as they compete to build the best systems and technologies. The competition between them drives innovation in the global market and shows no sign of slowing down!
NVIDIA’s chips and semiconductors are used by many industries across the world. From academic institutions to artificial intelligence professionals, these powerful computing solutions can be found in a diverse range of places. Professional gamers also rely on these components for their high performance gaming builds, as do many serious video production studios. As well, cloud technology companies leverage NVIDIA hardware to power their services, enabling efficient remote access from any device. All in all, NVIDIA components are proving to be essential tools in the modern digital revolution, allowing users unmatched capabilities and flexibility in their workflows.
$NVDA’s earnings are forecasted to grow by 23.8% per year.
As of today, NVIDIA’s share price is $225.96. NVIDIA’s Earnings per Share (Diluted) for the trailing twelve months (TTM) was $2.35. Therefore, NVIDIA’s PE Ratio for today is 96.15. For the current year $NVDA is expected to earn $3.27 per share which means that it’s at 69.5 times future price-to-earnings expectations. From a purely fundamental valuation perspective, this indicates the stock is overvalued simply based upon the company’s profitability.
One of the most well-known examples of stocks in the tech sector with a very high price to earnings ratio that still went up for a significant period of time is Amazon. This company started out with a fairly modest beginning as an online book retailer, but it quickly evolved and adapted to become one of the largest companies operating today. Its stock has risen from $50/share in 1997 to over $2,800/share in 2020 — a growth rate of nearly 5,500%. In 2015, Amazon had a P/E multiple of 528 when the stock was trading between $17 to $31 per share (split adjusted). This remarkable increase was supported by optimistic investors who were willing to accept the company’s then high PE ratio on the belief it could reach new heights.
Another example is Tesla, which has seen its stock price skyrocket ten-fold in just over two years despite an astronomical price-to-earnings multiple. At its peak in 2020, $TSLA shares were trading at a P/E multiple in excess of 1,120.
While these investments might look risky at first glance due to their high P/E ratios, they have both served as evidence that trading in quality tech stocks despite their high prices can pay off significantly when done right. The lesson to be learned is that eventually gravity will take hold of a company’s price. History shows that when most stocks are trading at historically high valuations, they eventually plummet.
The tech sector is one that is often associated with incredibly high valuations, with well-known companies like Apple and Amazon having P/E ratios in the triple digits. Even though these high multiples can seem intimidating at first glance, it is important to remember that they represent large potential returns as well. Investors must consider the growth potential of a company over what their current financial statements may suggest when evaluating potential investments in the tech sector. Companies with emerging technology or business models have the ability to scale quickly and generate large returns, so investors must seek out these potential opportunities and weigh the risks involved before making an investment decision. Companies trading at higher than average P/E ratios could provide great rewards if research has been conducted properly, but risk should still be taken into account before committing capital.
NVIDIA ($NVDA) is traded on the NASDAQ and has a market cap of $565 billion. It is worth putting on your radar because it is a component of several important broader market indexes which often are important barometers of the stock market’s overall health.
The Indexes which $NVDA is a component are listed below.
NASDAQ-100 Index: $NVDA was a component of this index, which tracks the performance of the 100 largest non-financial companies listed on the NASDAQ stock exchange. As of September 2021, $NVDA had a weighting of around 5.5% in this index.
S&P 500 Index: $NVDA was also a component of this index, which includes the 500 largest publicly-traded companies in the United States. As of September 2021, $NVDA had a weighting of around 0.7% in this index.
PHLX Semiconductor Sector Index: $NVDA was a component of this index, which tracks the performance of companies in the semiconductor industry. As of September 2021, $NVDA had a weighting of around 9.6% in this index.
In this weekly stock study, we will look at and analyze the following indicators and metrics as are our guidelines which dictate our behavior on a particular stock.
- Wall Street Analysts’ Estimates
- 52-week high and low boundaries
- Best Case – Worst Case Analysis
- Vantagepoint A.I. Forecast (Predictive Blue Line)
- Neural Network Forecast
- Daily Range Forecast
- Intermarket Analysis
- Our trading suggestion
We don’t base our decisions on things like earnings or fundamental cash flow valuations. However, we do look at them to better understand the financial landscape that a company is operating under.
Wall Street Analysts Ratings
The 38 analysts offering 12-month price forecasts for NVIDIA Corp have a median target of 200.00, with a high estimate of 325.00 and a low estimate of 110.00. The median estimate represents a -11.48% decrease from the last price of 225.94.
The demands from the tech world are growing. Computers constantly need to be faster, data continues to expand not shrink and graphics are constantly improving. These are the most basic facts of technology.
From the analysts perspective $NVDA is a mixed bag. A handful of analysts think the stock can rally another $50. But most analysts think the risk is to the downside from current levels.
52 Week High – Low Boundaries
Over the last 52 weeks NVDA has traded as high as $289.46 and as low as $108.13. This means provides us with an annual trading range of $181.33.
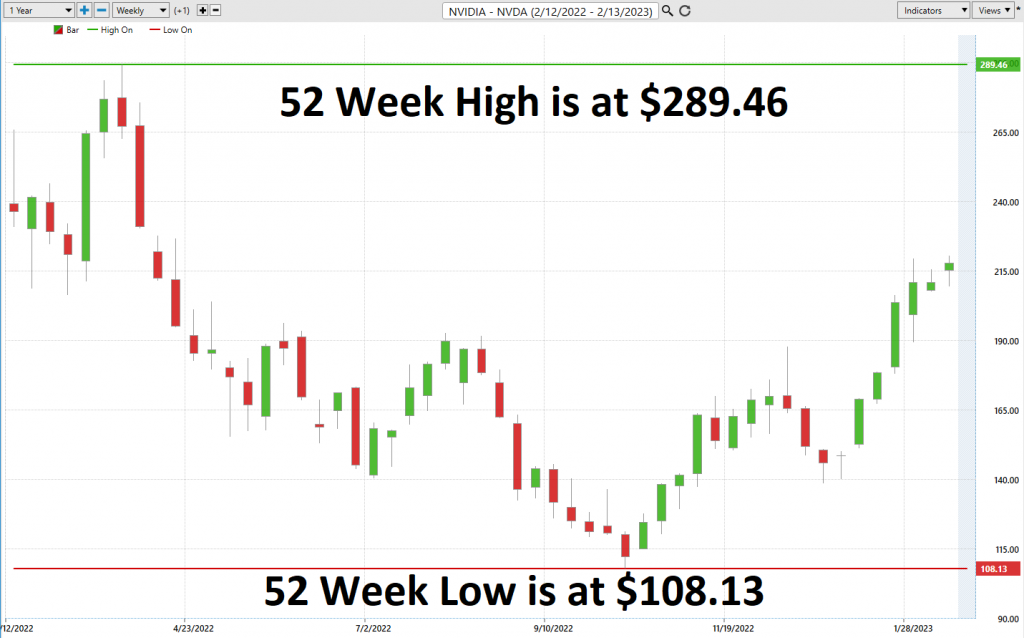
To calculate $NVDA’s statistical volatility we divide the current annual trading range of $181.33 into the most recent close. This tells us that the volatility of $NVDA is 78.9% which is considered to be very high.
An annualized volatility of 79.8% tells us that given past trade history over the last year, a stock is likely to fluctuate substantially in either direction by this amount or more next year. Factors such as news-related events, a change in market sentiment and economic conditions can all cause greater and lesser swings in prices than expected. This metric in and by itself tells us that it would be considered perfectly normal price action to expect $NVDA to trade as much as 78.9% higher or lower over the next year.
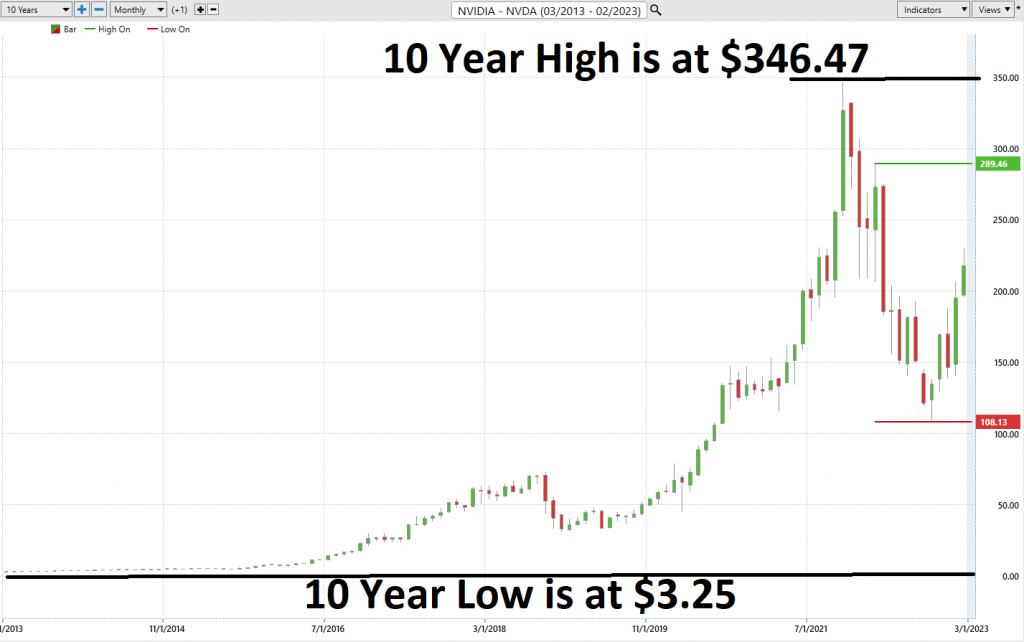
We can get a very clear perspective of $NVDA’s growth potential by simply zooming out and looking at its long term 10 year monthly chart. This chart should command the respect of any trader. From its all time highs $NVDA dropped 68% in a period of 12 months. From its recent lows 5 months ago the stock has generated gains in excess of 107%.
On the 10-year chart $NVDA is trading at its 67th percentile.
This is the type of volatility and motion that swing traders live for.
Traders must be reminded that volatility is a sword that cuts both ways.
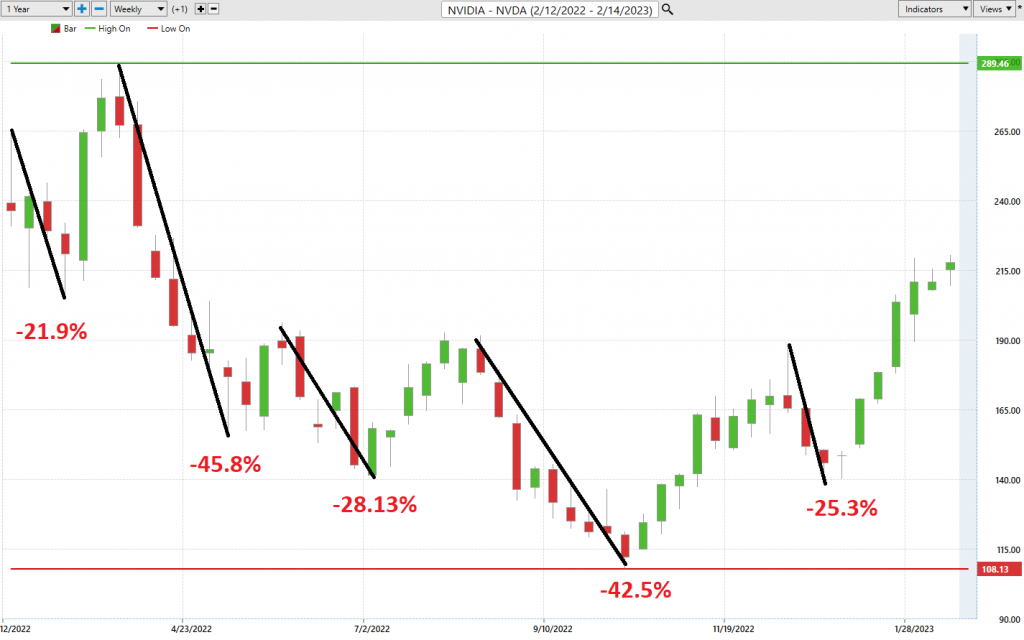
Best-Case and Worst-Case Analysis
Risk analysis is an invaluable tool when making important decisions. Best-case and worst-case analysis helps us to prepare for and mitigate against any possible undesirable outcomes. By taking the time to consider all of the possible reactions to a given scenario, we can create a more complete plan by having all angles accounted for. Of course, this doesn’t guarantee a specific outcome, but it can help provide more knowledge of what kind of impact our decisions can have so that we can proceed with more confidence. It is also worth noting that best-case scenarios imply potentially valuable opportunities as well as risks so it just makes sense to engage in both during our analysis. Ultimately, risk assessment does not have to be complicated or time consuming – by looking at potential scenarios from different perspectives, decision makers gain a better understanding of the consequences of their choices and stand the best chance at success.
In creating this analysis we simply look at the largest possible rallies and declines from peak to trough so that we can understand the real world volatility implications involved in trading the asset. Here is the worst-case analysis:
Followed by the best-case analysis:
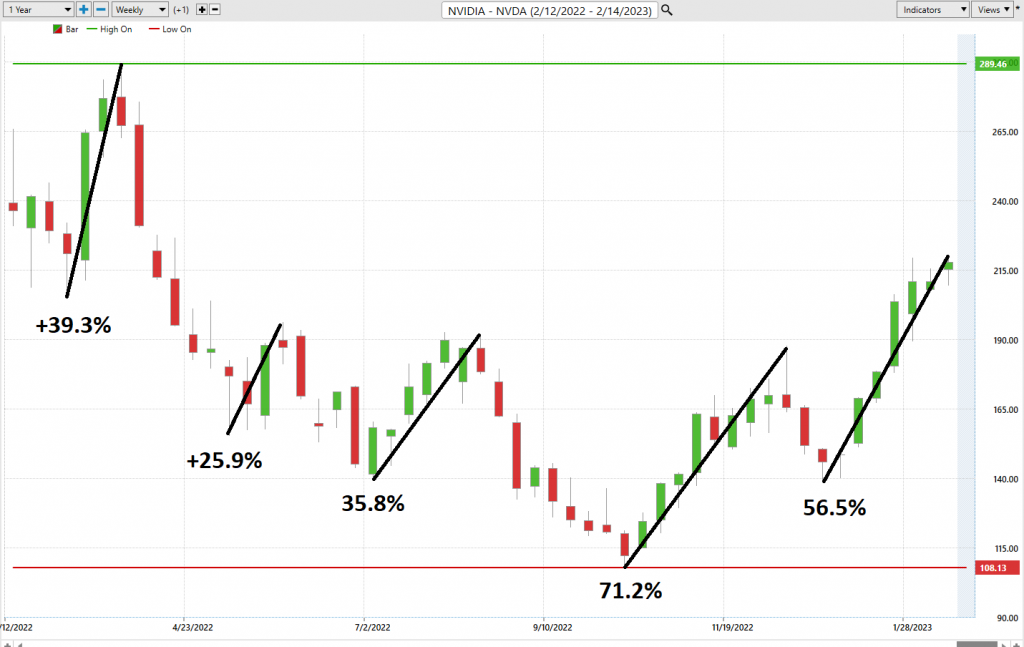
Observe and compare the magnitude and velocity of the declines and compare that to the rallies. While the bears clearly had the edge in the last 12 months there were numerous opportunities on the bullish side.
More importantly, recognize that all rallies and declines stayed within the annualized volatility boundary of 79.8%
Finally, we look at $NVDA compared to the broader market indexes to be able to drill down and compare volatility, risk and opportunity.
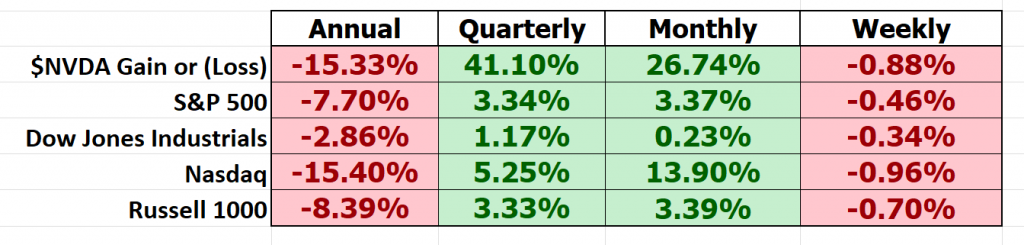
What immediately jumps out from these metrics is that as goes $NVDA so goes the broader market. However, $NVDA is substantially more volatile.
The Vantagepoint A.I. Analysis
Artificial intelligence is transforming the way traders make decisions. AI-based decision making processes enable traders to be more proactive and identify trends as they develop, which can improve the accuracy of their trades. By analyzing past market data, AI-powered trading algorithms are able to quickly generate up-to-date market insights that may have otherwise taken days or even weeks of analysis to uncover. Furthermore, AI extracts real time data from numerous sources, providing traders with a much wider range of information that can influence the success of the trade. As the use of artificial intelligence becomes more widespread among traders, it has become evident that decisions made with AI-powered systems tend to be superior in terms of risk management and profitability than those made without them.
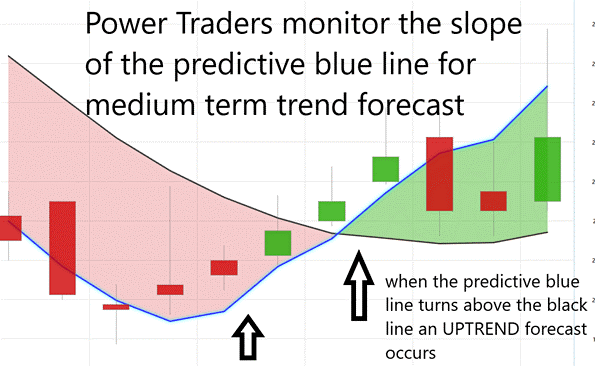
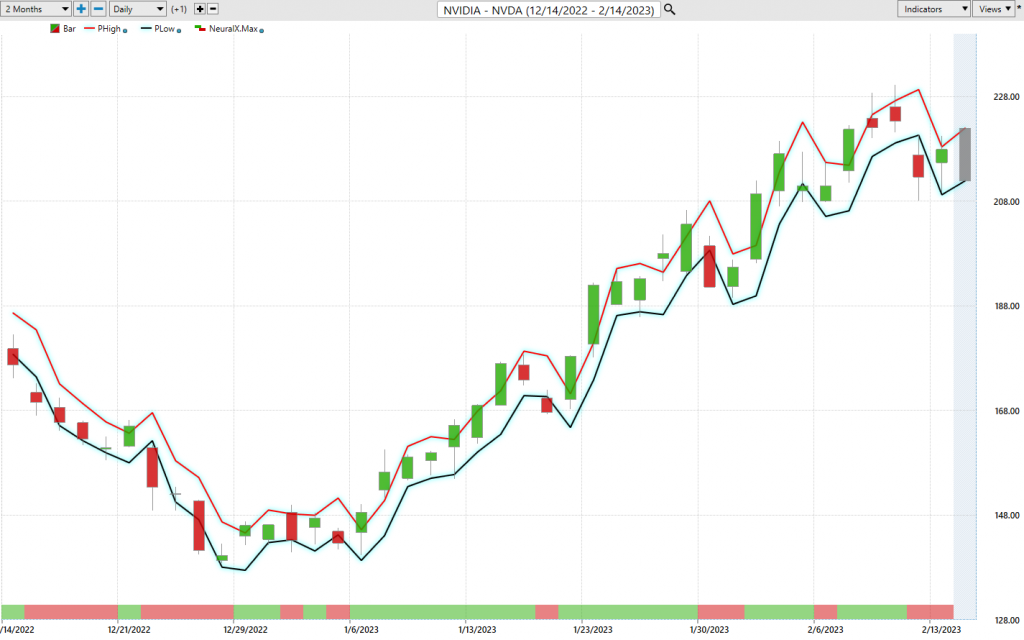
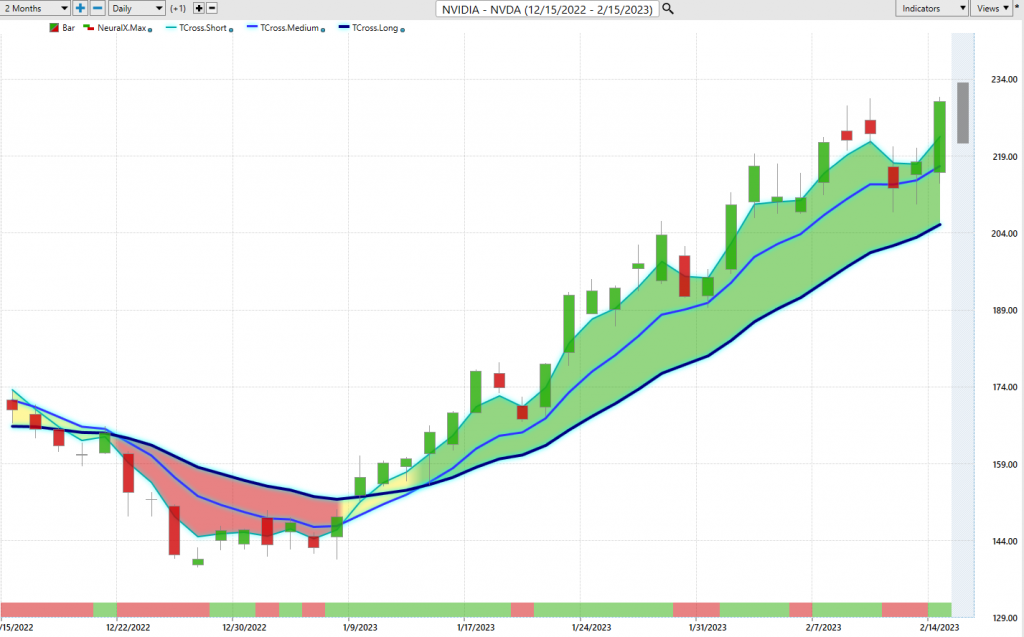
In studying the chart above pay close attention to the relationship between the black line and predictive blue line. The black line is just a simple 10 day moving average. It’s calculated by taking the closing prices of the last 10 days and dividing that sum by 10. All that the black line tells you is what has occurred. It tells you where prices have been and what the average price over the last ten days is.
The predictive blue line, on the other hand utilizes that Vantagepoint patented Neural Network and Intermarket Analysis to arrive at its value. It looks at the strongest price drivers of an asset through artificial intelligence and statistical correlations to determine its value.
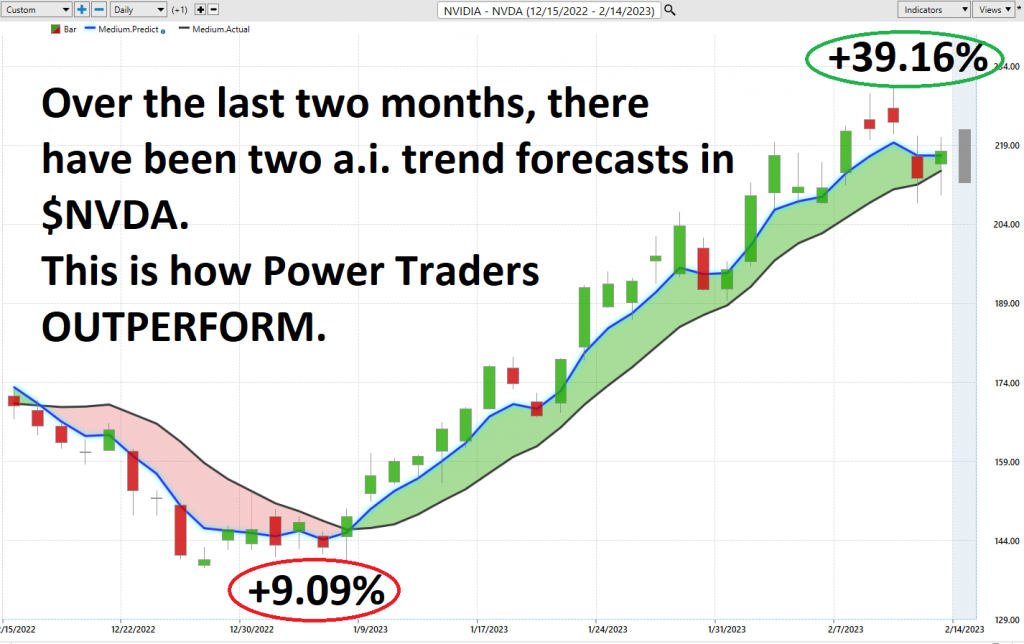
Power traders use the predictive blue line in helping to determine both the value zone as well as the trend direction.
Fine Tuning Entries With The Neural Net Indicator
A neural network in trading is a type of sophisticated computer algorithm that attempts to mimic the human brain’s functioning. It uses various mathematical models and computer simulations in order to make predictions on certain market trends and behaviors. Neural networks are unique because they have the capability to learn differently based on new data; they can continuously adjust as new information comes in, making them a powerful tool for technical analysis and automated trading bots. By taking in large amounts of data points and recognizing patterns, these neural networks can offer valuable insights into the markets that are often missed by traditional methods.
In trading is a software system used to make predictive decisions based on vast amounts of market data. This data can be obtained from different sources, such as price quotes or macroeconomic indicators. The network is also typically combined with machine learning algorithms, so that predictions can be continually improved by refining the neural weights and parameters when presented with new data. Neural networks are considered important for traders as they utilize high-level mathematical models to make well-informed decisions, reducing their exposure to unpredictable events. Additionally, these networks can factor for multiple trends simultaneously to build a tacit understanding of market behavior that would often go unrecognized without the aid of advanced computational power. Ultimately, the integration of neural networks allows traders to think more strategically and move beyond a simple technical analysis approach towards one more sensitive to changes in market conditions.
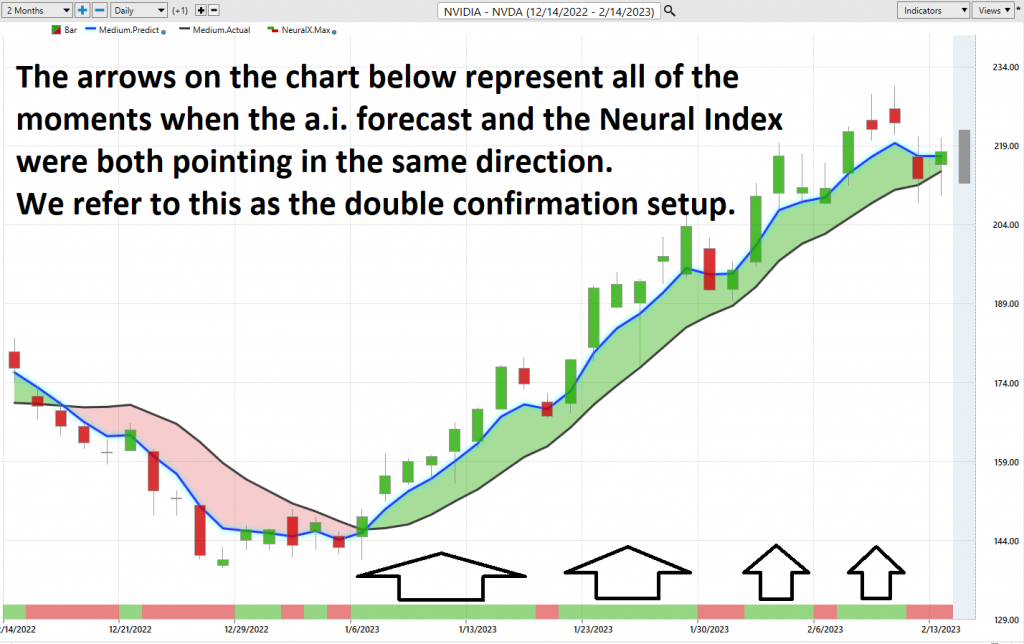
At the bottom of the chart is the Neural Network Indicator which predicts future strength and/or weakness in the market. When the Neural Net Indicator is Green it communicates strength. When the Neural Net is Red it is forecasting short term weakness in the market.
We advocate that Power Traders cross reference the chart with the predictive blue line and neural network indicator to create optimal entry and exit points.
Power Traders are always looking to apply both the neural network and A.I. to the markets to find statistically sound trading opportunities.
VantagePoint Software Daily Price Range Prediction
One of the powerful features in the Vantagepoint A.I. Software which Power Traders use on a daily basis is the Daily Price Range prediction forecast. This forecast is what permits Power Traders to truly fine tune their entries and exits into the market.
Short-term swing traders are always in search of an edge over their competitors, and the ability to identify profitable entry and exit points is a great way to achieve this. While most traders wrestle with trying to define value, the Vantagepoint Daily Range forecast makes this as simple as pushing a button and has exacting precision.
Let’s review the type of volatility that we are dealing with whenever we trade $NVDA stock. Below are the average trading ranges for $NVDA over a monthly, weekly and daily time frame.
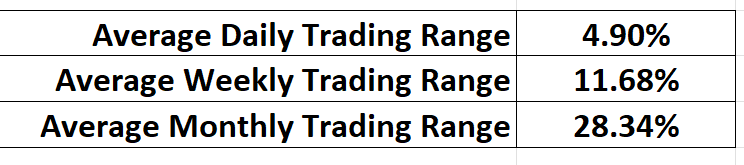
Here is the price chart of NVDA during the most recent runup featuring the Daily Price Range forecast and the Neural Net Indicator.
Power Traders use a price level below the predictive low price to place their protective sell stops in the market in case a sudden reversal was to occur.
Observe how the predictive price low also provided numerous short term entry opportunities for traders to buy NVDA as it was trending higher.
Intermarket Analysis
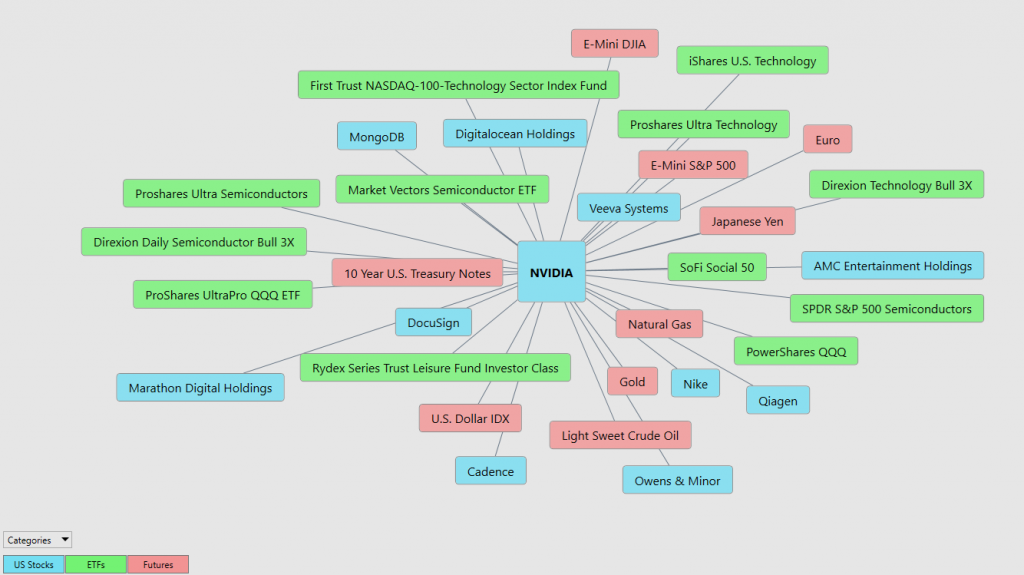
What makes the Vantagepoint Software truly unique is its ability to perform Intermarket analysis and to locate those assets which are most interconnected that are responsible for driving the price of NVDA higher or lower.
Intermarket analysis is a technique used to evaluate the performance of different asset classes in the market. By looking at correlations between different assets, investors and traders can potentially identify profitable opportunities and make more informed decisions when deploying capital. Recently, with the increase of computing power and availability of data sets, intermarket analysis has become more accessible to retail traders than ever before. As a result, it has facilitated more efficient trading strategies for entrepreneurs worldwide.
Intermarket analysis provides short-term traders with greater insight into the various markets; by keeping an eye on how they interact and affect each other, trends and emerging opportunities can be identified and taken advantage of quickly in order to capitalize on fluctuation. By being able to see the whole picture among all industries that are linked through financial markets, intermarket analysis helps reduce risk levels for traders seeking to take part in short-term trading.
Studying the charts can always provide objective realities in terms of locating support and resistance levels which become very clear on a chart. But we live in a global marketplace. Everything is interconnected. The billion dollar question for traders is always what are the key drivers of price for the underlying asset that I am trading?
These intangibles are invisible to the naked eye yet show very high statistical correlations.
Small changes in Interest rates, Crude Oil Prices, and the Volatility of the dollar amongst thousands of other variables affect the decisions companies must make to survive in these very challenging times. Trying to determine what these factors are is one of the huge problems facing investors and traders.
There is great value to be had in studying and understanding the key drivers of NVDA price action.
By doing so you can often see which ETF’s are most likely acquiring NVDA as well as uncovering other industries which affect NVDA price movement.
Conclusion
NVDA is a great swing trading stock. Always check the current A.I. daily forecast.
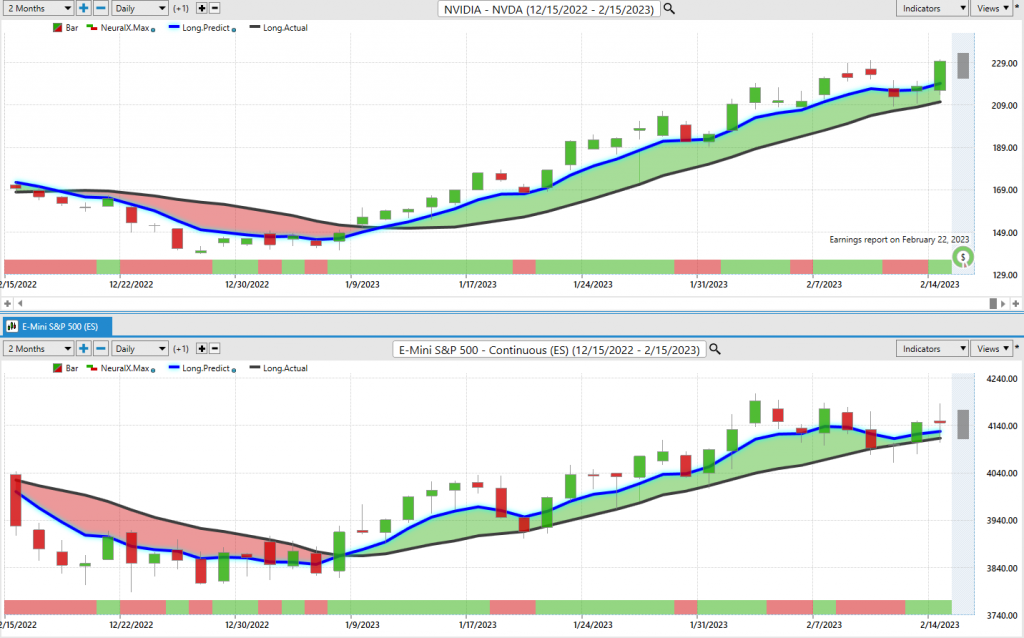
Year to date $NVDA is up 57.9% which is outpacing the broader market as well as all other stock market sectors. It is reporting earnings on February 22, 2023 which we suspect will create another round of massive volatility in the stock.
As goes $NVDA so goes the market.
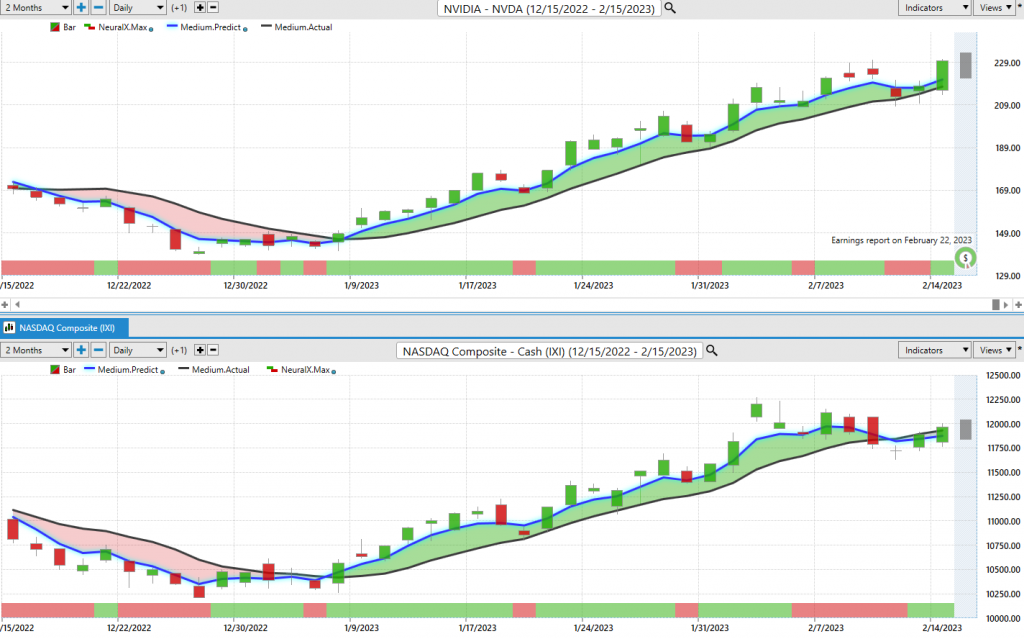
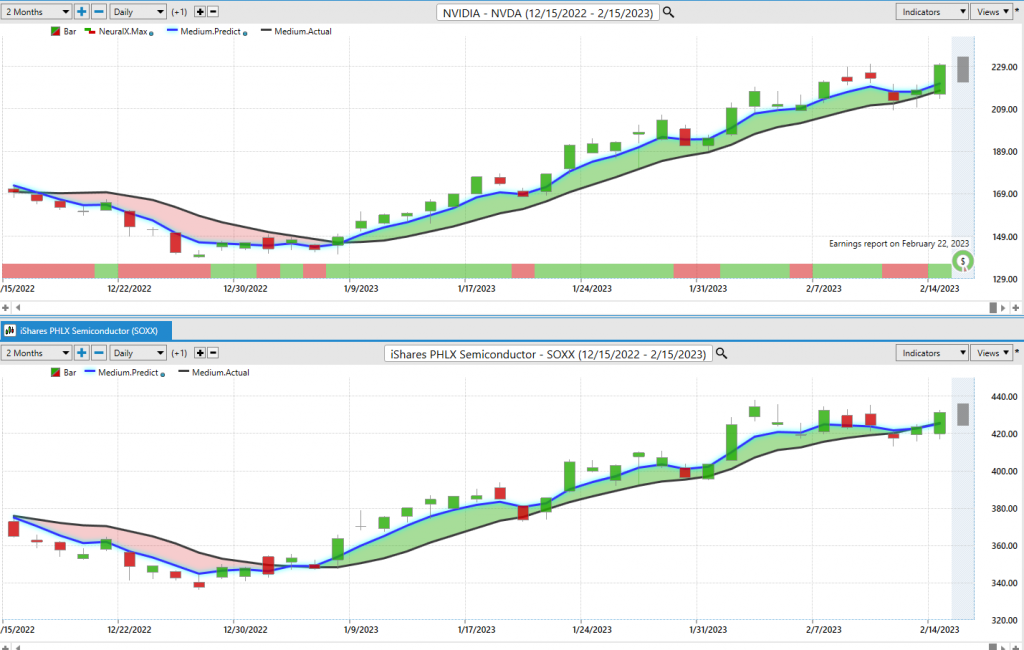
Simply look at the following correlations between $NVDA the NASDAQ, S&P, and the Philadelphia Semiconductor Index. While $NVDA is a component of these indexes it also appears to be a key driver.
First off is the comparison of $NVDA and the S&P 500 Index.
Nest is the comparison of $NVDA and the $NASDAQ composite:
Lastly is the comparison of $NVDA and the Philadelphia Semiconductor Index.
Earnings will provide the next round of volatility.
Huge support exists underneath the market at $208 followed by $190.
We think over the short term that weakness will be short lived and expect the stock to consolidate before eventually moving higher.
Our advice: Follow the A.I. trend analysis and practice good money management on all of your trades.
NVDA deserves to be on your trading radar.
Let’s Be Careful Out There!
Remember, It’s Not Magic.
It’s Machine Learning.
Disclaimer: THERE IS A HIGH DEGREE OF RISK INVOLVED IN TRADING. IT IS NOT PRUDENT OR ADVISABLE TO MAKE TRADING DECISIONS THAT ARE BEYOND YOUR FINANCIAL MEANS OR INVOLVE TRADING CAPITAL THAT YOU ARE NOT WILLING AND CAPABLE OF LOSING.
VANTAGEPOINT’S MARKETING CAMPAIGNS, OF ANY KIND, DO NOT CONSTITUTE TRADING ADVICE OR AN ENDORSEMENT OR RECOMMENDATION BY VANTAGEPOINT AI OR ANY ASSOCIATED AFFILIATES OF ANY TRADING METHODS, PROGRAMS, SYSTEMS OR ROUTINES. VANTAGEPOINT’S PERSONNEL ARE NOT LICENSED BROKERS OR ADVISORS AND DO NOT OFFER TRADING ADVICE.