


The A.I. stock spotlight this week is Pacific Gas and Electric ($PCG)
Pacific Gas & Electric has lived more lives than a cartoon cat.
It was founded in 1905 in the smoky aftermath of the San Francisco earthquake, when chaos forced a patchwork of local utilities to get organized or get out of the way. From there, it built the electrical and natural gas backbone of Northern and Central California, stringing wires across valleys and hillsides and running pipelines into homes, farms, and factories. Over time, it became the quiet force behind everything from irrigation pumps to data centers.
Then came the wildfires. Not once, but twice, catastrophic fire liabilities pushed the company into bankruptcy. Lawsuits piled up, investors winced, and headlines turned ugly. Each time, PG&E emerged from court supervision leaner, more regulated, and under the watchful gaze of state officials who treated it like a teenager with a suspended driver’s license.
Today, it stands as one of the largest regulated utilities in the United States. It powers Silicon Valley’s coffee machines, charges California’s Teslas, and keeps the lights on for millions of customers. After a century of shocks, scandals, and second chances, PG&E remains what it has always been at its core: a monopoly utility whose job is simple, essential, and never quite drama free.
That is the short version. It matters to markets because it sits at the intersection of electricity, politics, climate change, and capital. When California sneezes, this company catches pneumonia and Wall Street checks its pulse.
At its core, $PCG is a regulated utility. It generates electricity, transmits it, distributes it, and delivers natural gas. It is not trying to invent a flying car. It is trying to make sure your lights turn on when you flip the switch.
The business splits into two main segments: electric and gas. Electric is the heavyweight, with transmission and distribution lines running across fire prone hills and suburban neighborhoods. Gas is smaller but steady, moving fuel through pipelines into homes and businesses. Together, they form a regional monopoly with a built in customer base that includes tech campuses, farms, small businesses, and millions of households.
The real money machine is the rate base. Utilities are allowed to earn a regulated return on the infrastructure they build. The larger the approved rate base, the larger the earnings stream. It works like a toll road with guaranteed traffic. Build more poles, wires, and substations. Get approval. Earn a return. Investors get paid over time.
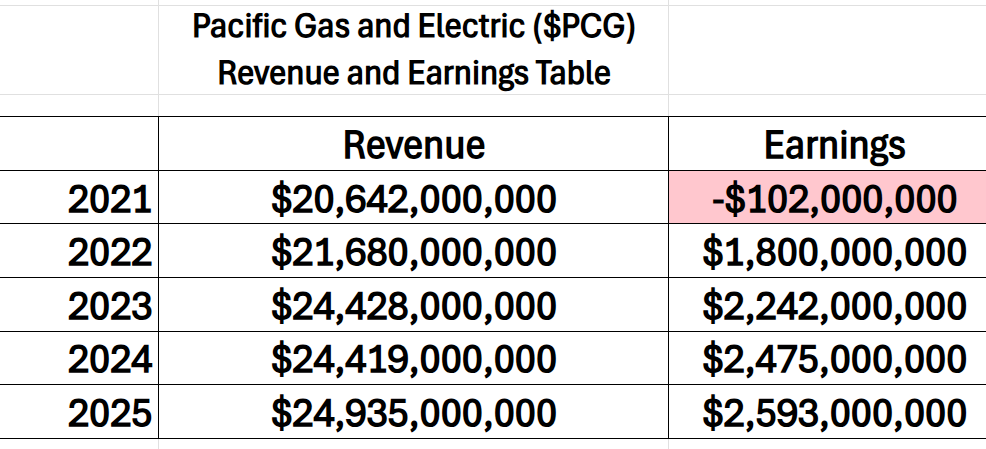
Here is the revenue and earnings table for the last 5 years. You can quickly see that $PCG is a cash machine, and it was devastated by the pandemic in 2021.
Headquartered in Oakland and led by CEO Patti Poppe, PCG employs tens of thousands of people. In theory it competes with utilities like Edison International and Sempra. In practice, it competes mostly with weather patterns and trial lawyers.
Financially, this is where traders often get confused. Revenue trends are stable because electricity demand does not disappear in a recession. People still cook dinner and charge their phones. Top line growth tends to track rate increases and infrastructure expansion rather than economic booms.
Margins are regulated and predictable. These are not Silicon Valley margins. They are steady returns approved by the California Public Utilities Commission. If you want explosive operating leverage, trade a chip stock. If you want a slow grind higher tied to infrastructure spending, this is your lane.
Cash is adequate but rarely excessive because utilities are capital hungry. Poles, wires, substations, undergrounding projects, wildfire mitigation. Every dollar must be financed before it earns a return. Debt levels are heavy, which scares new traders, but that leverage is baked into the model. Borrow to build. Add to rate base. Recover costs through customer bills over time.
Capital intensity is not optional for $PCG. It is existential. The company is in the middle of a multiyear spending cycle focused on grid hardening and wildfire mitigation. Traders who still think of it as a bankruptcy lottery ticket are looking in the rearview mirror. The wildfire fund structure and regulatory framework that emerged from bankruptcy have reshaped how the market values the risk.
The real questions now are more focused. Is wildfire risk truly under control, or are we one bad summer away from another courtroom drama? Can regulators keep approving rate hikes without triggering political backlash from customers staring at higher utility bills? How much growth will actually flow from the expanding rate base? Is the debt manageable if interest rates stay elevated? And perhaps most importantly, has $PCG graduated from problem child to boring compounder?
Recent news has been more about execution than disaster. Capital plans are progressing. Regulatory filings are moving forward. Analysts have nudged estimates higher as credit metrics improve. The absence of fresh catastrophe headlines has become its own bullish signal.
What is genuinely new is the tone. Management emphasizes reliability and mitigation progress rather than damage control. What is already priced in is steady mid single digit earnings growth from rate base expansion. What may still be shifting is the psychological discount. For years, every rally was sold on fear of the next wildfire headline. As time passes without a major event, that risk premium narrows.
The stock’s breakout to new 52-week highs reflects that shift. Over the past 90 days, falling or stabilizing interest rate expectations have helped utilities broadly. Steady earnings delivery without ugly surprises has reinforced confidence. Sector rotation has also played a role, with investors rediscovering regulated infrastructure plays after crowding into mega cap tech.
Year-to-date gains are less about flashy headlines and more about boring approvals. Credit outlook improvements and reaffirmed capital plans have mattered more than political chatter. Analysts pointing to visible earnings growth through the rate base are on solid ground. Where they often stumble is underestimating tail risk. Wildfire risk may be low probability, but it is high impact, and spreadsheets do not put out fires.
Opportunities are straightforward. Continued execution on mitigation and consistent regulatory support can compress the risk premium and expand the valuation multiple. Faster than expected rate base growth tied to grid modernization could surprise to the upside.
Risks are equally clear. Another catastrophic wildfire tied to company equipment would spike litigation risk and hammer the stock. A quieter risk lies in regulatory fatigue. If customer pushback slows rate approvals, future growth could be squeezed.
For traders, this is not a biotech moonshot. It is a slow grind story with occasional heart attacks. Short term breakout traders see higher highs and higher lows and recognize institutional accumulation. Income focused traders see a yield plus growth profile that benefits from stable or lower rates. Volatility seekers should keep an eye on the fire season calendar.
For the trend to continue, several things must stay true. No major wildfire liabilities. Continued regulatory support. Steady earnings growth from capital investments. Stable or easing interest rate expectations.
Early warning signs would include a sudden spike in legal reserves, a credit downgrade, aggressive political rhetoric targeting utility profits, or a technical breakdown below key support on heavy volume.
$PCG rewards patience and punishes complacency. In plain English, it makes money by keeping the lights on and staying out of court. Right now, the market believes it can do both. As long as that belief holds, the stock can climb.
But in California, the weather report always matters.
In this weekly stock study, we will look at an analysis of the following indicators and metrics which are our guidelines which dictate our behavior in deciding whether to buy, sell or stand aside on a particular stock.
- Wall Street Analysts Ratings and Forecasts
- 52 Week High and Low Boundaries
- Best-Case/Worst-Case Analysis
- Vantagepoint A.I. Predictive Blue Line
- Neural Network Forecast (Machine Learning)
- VantagePoint A.I. Daily Range Forecast
- Intermarket Analysis
- VantagePoint A.I. Seasonal Analysis
- Our Suggestion
While our decisions are ultimately guided by artificial intelligence forecasts, we still take a brief look at the fundamentals to understand the financial landscape in which $PCG is operating under.
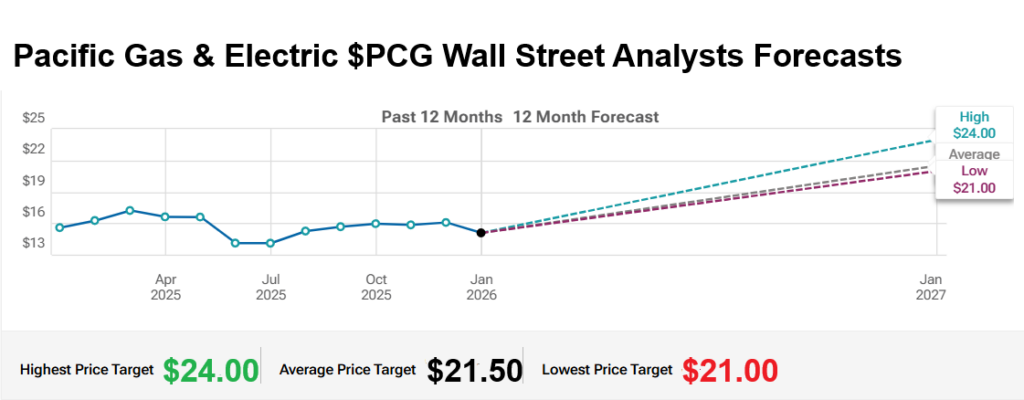
Wall Street Analysts Price Forecasts
Pacific Gas & Electric is supposed to be the financial equivalent of warm milk before bedtime.
Utilities are the stocks your grandfather bought so he could fall asleep at 8:30 p.m. without worrying about margin calls. They hum. They pay dividends. They behave.
And yet, here we are.
Look at the chart. The past 12 months show a stock that dipped, recovered, and now trades around $18. Nothing dramatic at first glance. But shift your eyes to the right side of the graphic, and the story changes.
Wall Street’s 12-month forecasts stretch from $21 on the low end to $24 on the high end, with an average target of $21.50 sitting politely in the middle.
That spread matters.
The difference between the most bullish and most bearish forecast is $3. That is not trivia. That is expected volatility. It is the range professional analysts believe this stock can reasonably travel over the next year without anyone calling it a crisis.
For traders, the average target is not the main event. The spread is.
A $24 high target implies roughly a 30 percent move from current levels. That is not sleepy utility behavior. That is something you expect from a recovering industrial or a misunderstood growth stock.
Now look at the low target. $21.
Even the most bearish analyst in the room is still projecting about a $3 gain from where the stock sits today. That is what makes this unusual.
Utilities are not supposed to have downside cases that still involve upside.
PG&E does not fit the traditional mold because it is not just a utility. It is a utility with history. Bankruptcies. Wildfires. Regulatory scrutiny. Political theater. This company has been priced for disaster before.
What the forecast band tells you is that Wall Street believes the rebuilding phase is real. Rate base growth is visible. Mitigation spending is ongoing. Credit metrics are improving. The models assume progress.
But the key takeaway is not the midpoint. It is the envelope. From $21 to $24. That $3 gap represents uncertainty. It represents debate. It represents opportunity.
Disagreement among analysts is oxygen for traders.
If you are long, you are positioning for a move toward $24. If you are cautious, you are managing risk around the idea that the stock stalls closer to $21. Either way, the range defines the battlefield.
And here is the subtle but important observation. There is no forecast below the current price. That does not eliminate risk. Wildfire season still exists. Political backlash still exists. But based on present assumptions, the Street’s baseline view is upward.
That is a major shift in sentiment for this company. This chart is telling you that PG&E is no longer being treated as a liability time bomb. It is being treated as a regulated growth story with infrastructure tailwinds.
For a company that makes money by keeping the lights on, that is a surprisingly energetic setup.
Just remember, utilities are boring until they are not.
And in California, one hot, windy afternoon can turn any forecast into historical fiction.
52 Week High and Low Boundaries
There is something quietly symbolic about a regulated utility breaking out to a new 52 week high.
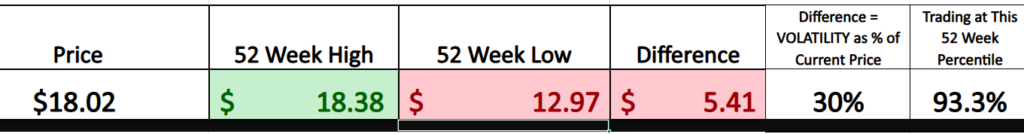
Pacific Gas & Electric is not a biotech chasing a breakthrough or a chipmaker riding an artificial intelligence boom. It is a century-old utility, tasked with keeping the lights on across Northern California. And yet, at $18.02, the stock is now pressing against a 52-week high of $18.38, trading in the 93rd percentile of its annual range.
That detail is not cosmetic. It signals positioning.
Over the past 12 months, the stock traded between $12.97 and $18.38, a $5.41 spread that represents roughly 30 percent of the current price. For a regulated utility, that is meaningful volatility. This is not the kind of narrow band one expects from a company whose revenue is largely approved by regulators.
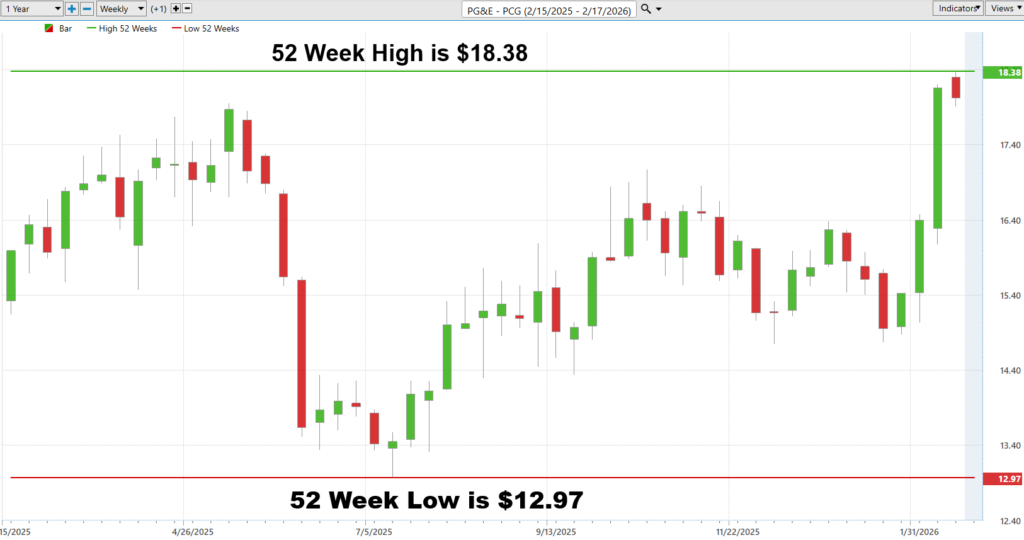
But today, the technical posture has changed. The stock is not hovering in the middle of its range. It is leaning into the top of it. Breakouts, particularly in stocks with complicated histories, tend to reflect a reassessment of risk rather than simple momentum chasing.
To understand the weight of that move, you have to zoom out.
The 10-year monthly chart is sobering. Over the last decade, PG&E fell more than 75 percent from its highs. A stock that once traded north of $70 collapsed into the single digits following wildfire liabilities, bankruptcy filings, and massive legal exposure.
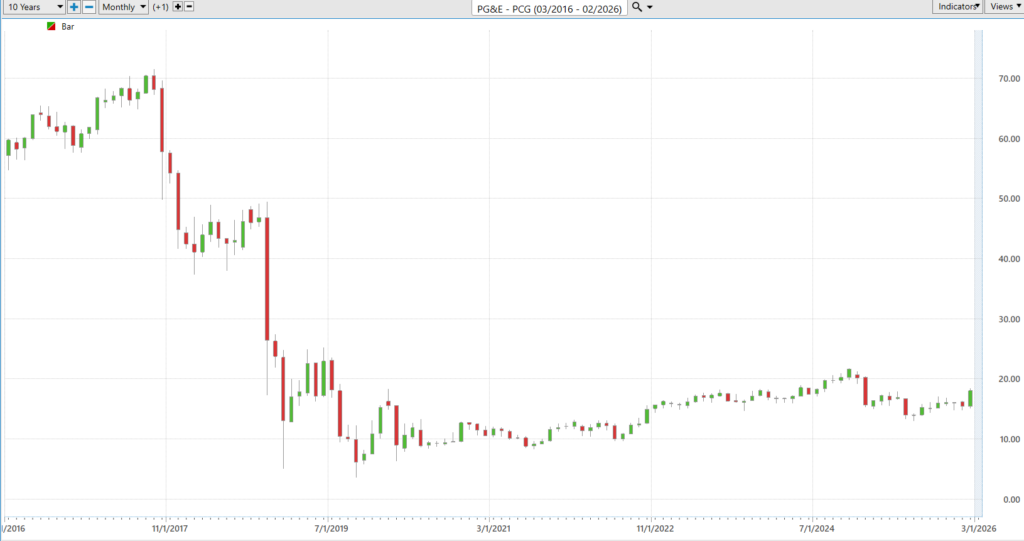
That decline was not cyclical softness. It was structural trauma.
The long-term chart shows a company that went from stable infrastructure provider to litigation epicenter. The collapse was swift, violent, and unprecedented for a utility of its size. Investors were not debating earnings multiples. They were debating survival.
And yet, the latter half of that same chart tells a different story. After bankruptcy, the stock began to stabilize. The dramatic swings of 2018 and 2019 gave way to consolidation. The lows began to hold. Access to capital returned. The company rebuilt under regulatory supervision.
Now, the 52-week chart suggests a transition from stabilization to breakout.
This is not simply a technical event. It reflects a broader shift in perception. For years, PG&E traded with what could fairly be described as a disaster discount. Every rally was shadowed by the possibility of another wildfire headline. Every earnings report was filtered through legal uncertainty.
Markets, however, are forward-looking. When a company survives an existential crisis and demonstrates operational and regulatory improvement, capital begins to recalibrate its assumptions.
Trading at over 93% of its 52-week range signals that investors are no longer positioning defensively. They are leaning into the recovery narrative.
None of this erases the past. The 10-year collapse remains a cautionary reminder that volatility is not theoretical in this stock. A 75% drawdown leaves institutional memory and investor scars.
But breakouts in companies with that kind of history often carry particular significance. They suggest that the market is beginning to treat the prior decade as context rather than destiny.
For traders, the message is nuanced. First, volatility is embedded in the story. The $5.41 annual range and the magnitude of the decade long collapse underscore that this is not a sleepy bond substitute.
Second, momentum is real. When a stock presses into new 52-week highs after years of rebuilding, it forces both skeptics and former holders to reconsider.
Utilities are rarely framed as comeback narratives.
PG&E may be the exception. The 52-week breakout tells you where the stock is going. The 10-year collapse reminds you where it has been. The tension between those two realities is precisely what makes this moment consequential.
Best-Case/Worst-Case Scenario Analysis
Utility stocks are supposed to be boring.
They are the financial equivalent of a rocking chair on a front porch. Steady. Predictable. Quiet. Traditionally, utilities compete with U.S. Treasury bonds as retirement vehicles. If a 10-year Treasury yields 4 percent, a solid utility might offer 4.5 percent, plus a modest dividend that grows over time. Stability is the selling point.
Investors buy utilities not for drama, but for sleep.
Now here is where Pacific Gas & Electric breaks the mold.
First, let’s answer the practical question. Does $PCG pay a dividend?
As of now, $PCG does not pay a dividend. The company suspended its dividend during bankruptcy and has not reinstated it. That alone makes it different from the classic utility profile. This is not currently a bond substitute. It is a restructuring and capital allocation story.
Which means if you own it, you own it for price movement.
And price movement is exactly what this stock has delivered.
The simplest way to understand volatility is not through academic formulas or standard deviation calculations. It is to look at previous uninterrupted rallies and uninterrupted declines and measure them. Just measure the swings. That tells you everything you need to know about what kind of position sizing and risk tolerance this stock requires.
Look at the best-case scenarios first.
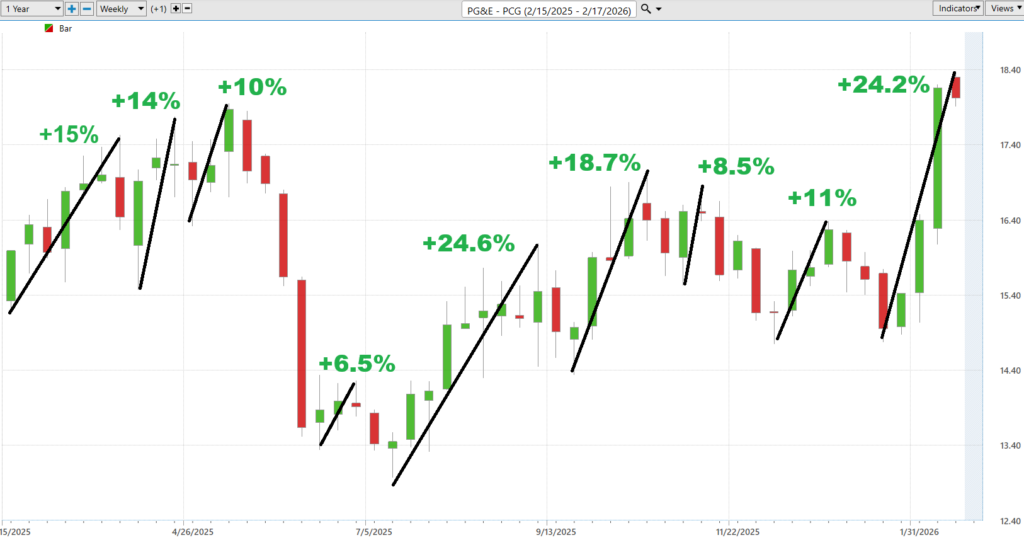
On the chart, uninterrupted rallies ranging between +10 percent and 24.6%. These are not tiny, incremental advances. These are double-digit moves in a stock that is technically a regulated utility.
The most recent rally of over 24% into new 52-week highs is particularly important. It tells you that when sentiment shifts, this stock can trend hard and fast. That is momentum. That is institutional participation. That is not sleepy.
Now flip the script.
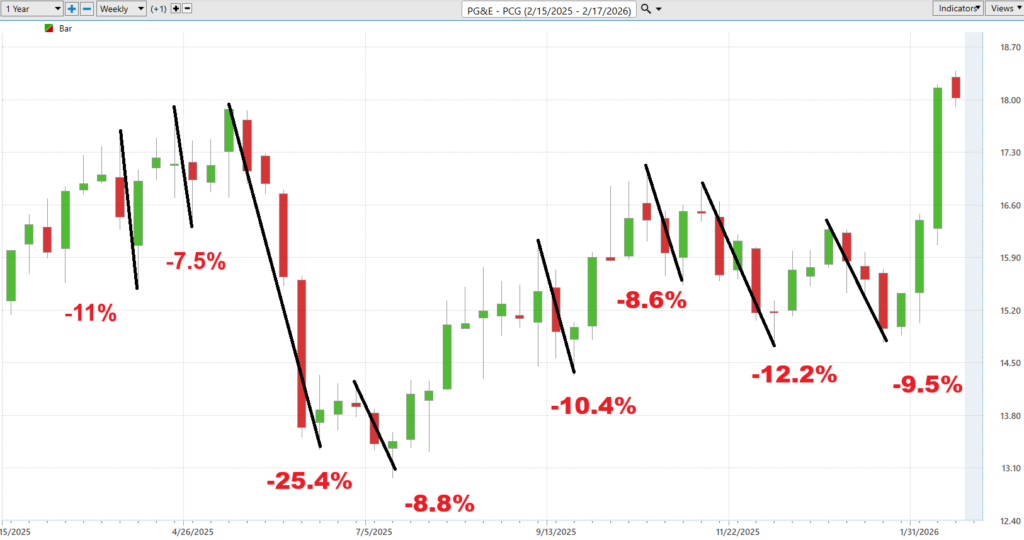
The uninterrupted declines tell an equally important story. We see pullbacks of -7.5%, -25.4%.
That -25% drop is not theoretical. It happened. And it happened quickly.
If you are trading $PCG, you must accept that this stock can move 8 to 12% against you during routine corrections and occasionally much more during stress events. That is the volatility embedded in the name.
This is why measuring uninterrupted swings is so powerful. It strips away narrative. It strips away headlines. It simply asks, “How far does this stock tend to run before it rests?” and “How far does it tend to fall before it stabilizes?”
From that, you determine position size.
If the average meaningful pullback is 8 to 12%, you do not size the position like a 3% bond proxy. If the stock regularly rallies 15 to 25% in trending phases, you understand the upside capture available when momentum aligns.
That is risk and reward in plain English.
The best-case scenario right now is continuation. The stock is pressing into new 52-week highs. Momentum is positive. The most recent rally measured over 24%. If history rhymes, strong trends in this stock can extend further than conservative investors expect.
But the volatility profile tells you the other side of the coin. Pullbacks of 10% are normal. A larger 20% correction is not impossible. And because $PCG does not currently compensate shareholders with a dividend, you are not being paid to wait through drawdowns.
That makes discipline critical.
Utility stocks traditionally compete with Treasuries because they offer income and stability. $PCG, at this stage of its lifecycle, offers something different. It offers a recovery-plus-momentum trade wrapped in a regulated infrastructure story.
The cleanest way to understand that opportunity is not through earnings projections or rate case filings. It is through the tape.
Measure the rallies. Measure the declines. Study the uninterrupted moves.
That is the simplest and most effective way to understand what kind of opportunity $PCG presents, and what kind of volatility you are signing up for.
Next, we compare $PCG to the broader stock market averages.
There is a certain irony in calling Pacific Gas & Electric a utility.
Utilities are supposed to sit quietly in portfolios, competing with Treasury bonds for relevance. They are meant to provide ballast, not acceleration. They are what investors buy when they want stability, not momentum.
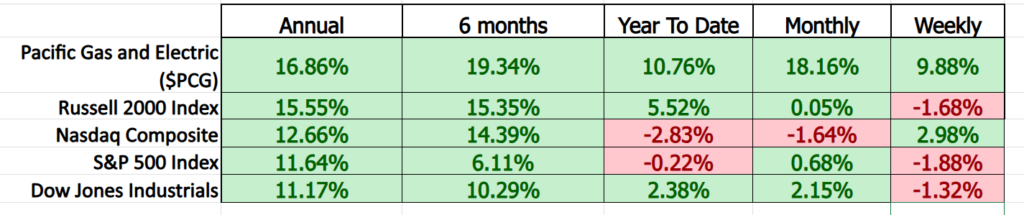
And yet, regardless of how you slice the data in this table, $PCG is not behaving like a sleepy utility.
On an annual basis, $PCG is up 16.86%. That is ahead of the Russell 2000, ahead of the Nasdaq, ahead of the S&P 500, and ahead of the Dow. Over six months, it is up 19.34%, again outperforming every major benchmark listed. Year to date, it is up 10.76% while the Nasdaq is negative and the S&P 500 is essentially flat. Even on a monthly and weekly basis, the stock is printing gains that stand in contrast to the mixed, and in some cases negative, returns of the broader averages.
That is not defensive drift. That is leadership.
What makes this particularly notable is the macro context. When capital rotates, it does not announce itself. It shifts quietly from yesterday’s winners into tomorrow’s themes. The fact that a regulated California utility is outperforming growth-heavy indexes tells you something about risk appetite and positioning.
This is rotation.
Investors appear to be reallocating toward infrastructure, regulated assets, and companies with visible cash flow in an environment where uncertainty around rates, growth, and earnings remains elevated. When $PCG outpaces the Nasdaq and the S&P 500 across multiple time frames, it signals that money is seeking different exposure than it did in prior cycles.
The takeaway is not simply that $PCG is up.
It is that it is outperforming.
And in markets, relative strength often matters more than absolute returns. When a stock that traditionally competes with bonds begins outperforming equity benchmarks, it tells you the market is recalibrating what it wants to own.
$PCG may be classified as a utility.
But by performance standards, it is trading like something else entirely.
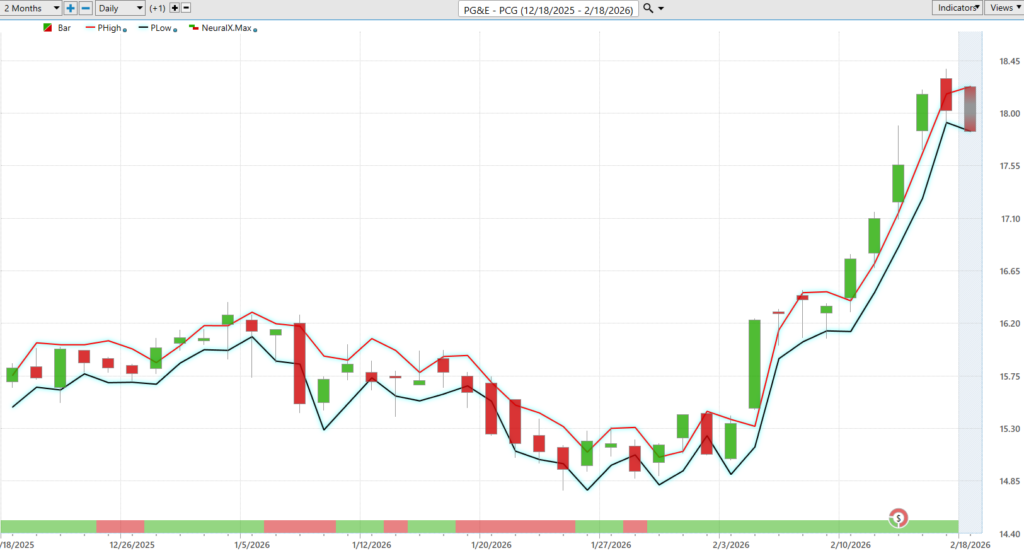
VantagePoint A.I. Predictive Blue Line
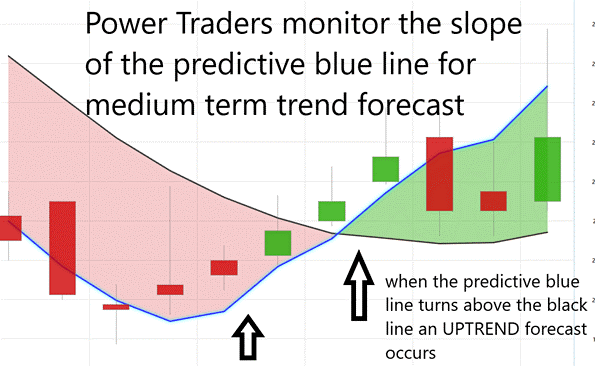
If you strip this chart down to its essentials, you see three things: price bars, a blue line, and a black line. That is it. No mystery. No overthinking required.
The blue line is the VantagePoint A.I. Predictive Blue Line. The black line is the actual moving average. The rule is simple, and it is not negotiable.
When the Predictive Blue Line is above the black line and sloping higher, you are in an uptrend. When it is below and sloping lower, you are in a downtrend. The slope tells you direction. The positioning tells you strength. Everything else is commentary.
On January 30th, the system issued an Uptrend forecast. That was the moment when the blue line crossed above and began to separate from the black line with a positive slope. That separation is not cosmetic. It is the market telling you momentum is expanding.
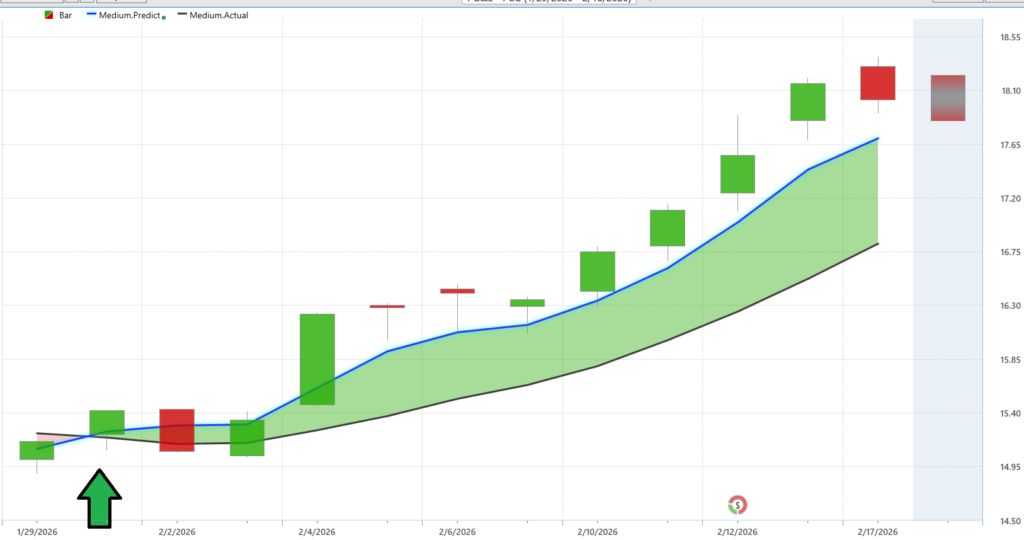
Since that signal, the stock has rallied as much as 19 percent.
That is not noise. That is trend confirmation.
Notice how the blue line continues to stay above the black line as price stair-steps higher. The widening gap between the two lines reflects strengthening forward expectations relative to the current average. In other words, the forecast is leading the trend, not chasing it.
When you trade this rule correctly, you are not guessing tops. You are not predicting pullbacks. You are aligning with slope and structure. As long as the blue line remains above the black line and maintains upward slope, the bias remains bullish.
The moment the slope flattens and the blue line crosses back below the black line, that is your early warning.
This is not about being right. It is about being aligned.
Since the January 30th Uptrend forecast, the alignment has been clear, and the market has rewarded that clarity with nearly a 20% advance.
The takeaway is straightforward.
Follow the slope. Respect the positioning. Let the structure of the lines tell you when strength is building and when it is fading.
Right now, the structure says trend intact.
VantagePoint A.I. Neural Index
A neural network sounds complex, but the concept is straightforward.
It is a mathematical model built in layers. You start with inputs such as price, volume, volatility, and intermarket relationships. Those inputs flow through hidden processing layers where weighted calculations are applied. The system continuously adjusts those weights based on past outcomes. Over time, it learns which patterns tend to lead to higher or lower prices.
In simple terms, it studies what has worked before under similar conditions and estimates what is most likely to happen next.
For traders, that is powerful. Markets move in patterns. A neural network is designed to detect those patterns faster and more consistently than manual analysis.
The Neural Index forecast functions as a short term barometer. It is typically effective for the next 48 to 72 hours. That makes it ideal for timing entries and exits within an established trend.
The Predictive Blue Line serves a different purpose. It measures the strength and direction of the intermediate trend. When the Blue Line is above the black moving average and sloping upward, the trend bias is bullish. When it is below and sloping downward, the bias is bearish.
The real edge appears when these two tools align.
On the attached chart, the Blue Line is above the black line and rising. That confirms intermediate strength. At the same time, the Neural Index is signaling short term bullish conditions. This alignment creates momentum expansion.
When both the trend and the short-term forecast point in the same direction, rallies tend to extend and pullbacks remain shallow.
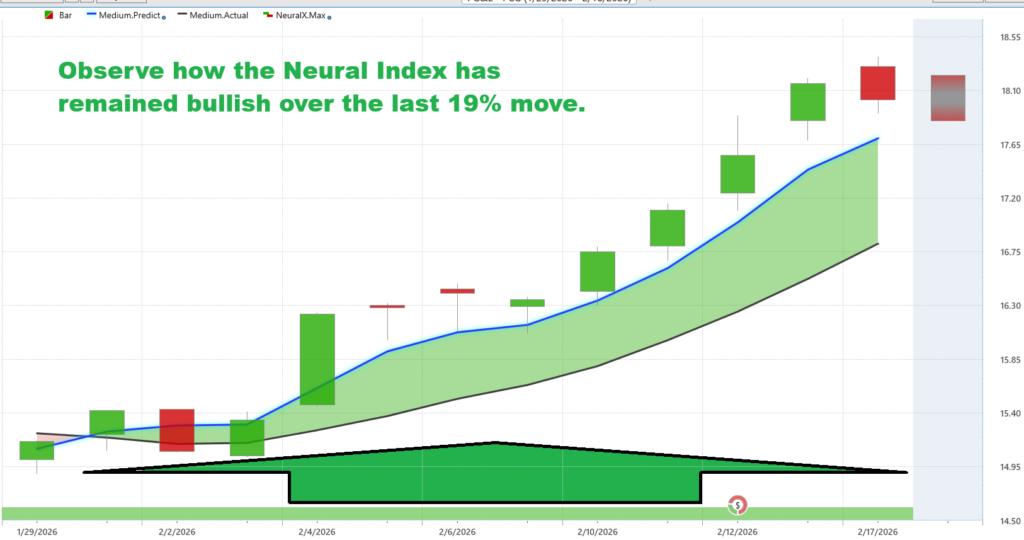
That is what we see here. Price has stepped higher. The gap between the Blue Line and the black line has widened, reflecting strengthening forward expectations. The Neural Index has reinforced that strength in the near term.
This layered confirmation is where probability shifts.
The Neural Index tells you what may happen over the next two to three days. The Predictive Blue Line tells you the broader direction. When both agree, traders press the advantage. When they diverge, risk management becomes the focus.
That alignment is not theory. It is structure. And structure is what keeps traders trading with momentum instead of chasing it.
VantagePoint A.I. Daily Range Forecast
Let’s cut through the fog.
Utilities are supposed to move like molasses in January.
But look at the numbers.
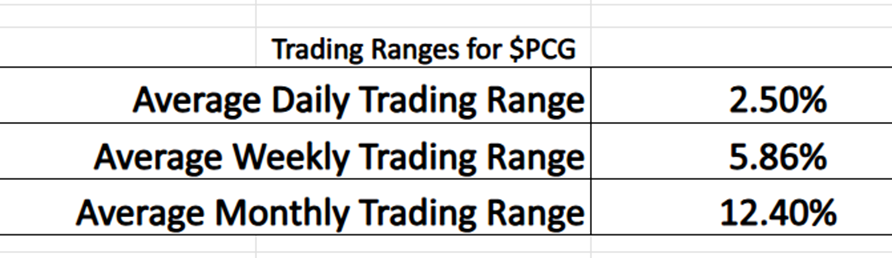
$PCG’s average daily trading range is 2.50%. Weekly? 5.86%. Monthly? 12.40%.
That is not sleepy. That is tradable.
Now pull your eyes down to the chart.
See those red and green projected high and low bands wrapping around price? That is your roadmap. The market is expanding its daily range as momentum builds. The projected highs keep stepping up. The projected lows are climbing right behind them.
Translation?
Volatility is expanding in the direction of the trend. And that is the sweet spot. When a stock averages 12% monthly movement, you are not clipping coupons. You are trading swings. Position size adjusts accordingly. Stops widen slightly. Reward targets expand.
The best part?
The breakout move on the right side of the chart shows exactly why this matters. Once the range expansion shifted upward, price accelerated. The daily projected highs began stair-stepping higher. The projected lows stopped collapsing.
That is how trends compound.
The key takeaway is simple.
Know the range. Respect the range. Trade the range. If a stock moves 2.5% per day on average, don’t expect a 10% move overnight. If it moves 12% per month, don’t use a 1% stop and complain about noise.
This is how professionals think.
Measure the range. Align with direction. Let volatility work for you instead of against you. $PCG is not a bond proxy right now. It is a structured momentum vehicle hiding inside a utility wrapper.
And that is exactly the kind of mispricing traders love.
Intermarket Analysis
Stocks don’t move in isolation. They move in ecosystems. Intermarket analysis is just a fancy way of saying, “What other forces are pushing this thing around?”
Think of it like riding a bike. You’re pedaling, sure. But wind, hills, and traffic matter too.
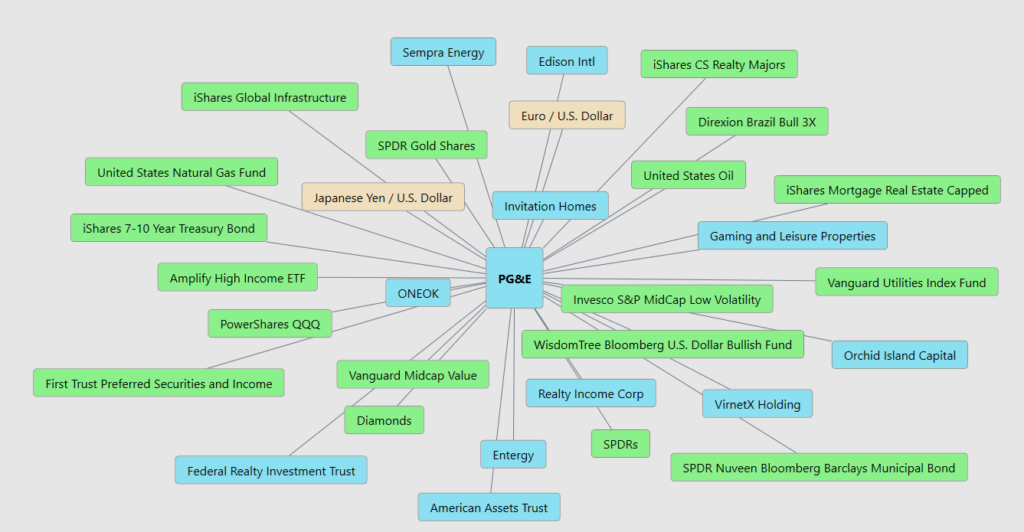
Look at that web.
$PCG is sitting in the center like a spider in a financial ecosystem. And every line connecting to it tells you something about what actually moves this stock.
Start with rates and bonds. You’ve got iShares 7–10 Year Treasury Bond. SPDR Nuveen Municipal Bond. Preferred securities. Mortgage REITs like Orchid Island Capital. Realty Income. Federal Realty.
These aren’t random connections.
$PCG trades in the same risk bucket as yield assets. When bond yields rise, those instruments compete directly with utilities. When yields fall, money rotates back into income equities. That line from $PCG to Treasuries and muni bonds? That’s your interest-rate sensitivity.
Rates are not background noise. They’re a steering wheel.
Now shift to the dollar. WisdomTree Bloomberg U.S. Dollar Bullish Fund. Euro/U.S. Dollar. Japanese Yen/U.S. Dollar. A strong dollar often aligns with tighter financial conditions. Utilities don’t export, but capital flows do. When the dollar surges, global liquidity tightens. When it softens, risk appetite improves. That matters for multiple expansion in yield-sensitive stocks.
Then energy. United States Natural Gas Fund. United States Oil.Energy-linked ETFs.
PG&E is not an oil producer, but it operates in the same macro environment. Energy prices affect costs, sentiment, and capital flows. If the energy complex strengthens, infrastructure spending themes often benefit. That link isn’t direct revenue. It’s capital narrative.
Now look at real estate.
Invitation Homes. Gaming and Leisure Properties. iShares Mortgage Real Estate Capped. American Assets Trust.
These are rate-sensitive, cash-flow assets. When money rotates into real estate and infrastructure, utilities often come along for the ride. That cluster tells you $PCG trades more like a hybrid between income equity and infrastructure proxy than a pure defensive play.
Then you see the broader equity relationships. Vanguard Utilities Index Fund. Invesco S&P MidCap Low Volatility. Vanguard Midcap Value. QQQ. Diamonds.
This is the rotation story.
When capital flows into mid-cap value and low-volatility names, utilities can outperform. When QQQ dominates and growth stocks rip, utilities lag.
Right now, the performance data suggests rotation is happening. Money isn’t just chasing mega-cap tech. It’s allocating toward regulated infrastructure, value, and stability. That’s why $PCG has been outperforming broader averages.
Now let’s connect it back to the core drivers. Interest rates. Capital flows. Infrastructure demand. Risk appetite.
$PCG sits at the intersection of all of it.
This web shows you something powerful: $PCG is not moving in isolation. It is responding to macro forces, sector rotation, bond yields, dollar strength, and energy dynamics.
Right now, the web suggests alignment, with rates stabilizing, infrastructure themes gaining traction, value rotation underway, wildfire risk perception improving, and earnings guidance strengthening; when those forces lean in the same direction, the stock breaks out, and this graphic makes one thing clear: $PCG is no longer just a “sleepy California utility,” it is a node in a capital flow network, and when capital starts flowing through that network in its favor, price does not drift, it moves.
Our Suggestion
If you listen carefully to the last two earnings calls, the tone tells you almost as much as the numbers.
Management is no longer speaking in the guarded, post-bankruptcy language of survival. They speak in the language of execution.
In the most recent quarter, PG&E delivered core earnings in line with guidance and tightened its 2026 outlook to a range of roughly $1.64 to $1.66 per share. That matters. Utilities are judged on predictability. Hitting the midpoint and then narrowing forward guidance signals operational control. It suggests the capital plan, cost discipline, and wildfire mitigation efforts are moving according to script.
Confidence shows up in three places.
First, the guidance. You do not tighten earnings ranges if you are uncertain about your footing. Second, the load-growth narrative. Management has been explicit about increasing electricity demand, particularly from data centers and broader electrification trends. These are tangible projects, not theoretical talking points. Third, the capital plan. The company continues to emphasize disciplined infrastructure investment and improving credit metrics, projecting stability rather than stress.
That said, the risks have not disappeared. They have simply evolved.
Wildfire liability remains an existential risk. Even with mitigation of investments and structural reforms, the downside scenario is asymmetric. One severe fire season tied to company equipment would quickly reintroduce legal and political pressure.
Regulatory risk is always present in California. PG&E must walk a narrow line between earning an adequate return and maintaining affordability for customers in a high-cost state. Rising bills can become political issues, and that can affect allowed returns and recovery timelines.
Execution risk is the quieter variable. PG&E is in the middle of a multi-year infrastructure buildout; hardening the grid, undergrounding lines, expanding capacity. If projects run over budget or face regulatory friction, the steady earnings narrative could wobble.
Interest rates also matter. Utilities are capital-intensive businesses. Higher borrowing costs affect financing flexibility and valuation, even if earnings are regulated.
The California economy is both a tailwind and a constraint.
On one hand, demand growth is real. AI-driven data centers, electrification of transportation, and population clusters requiring reliable power all expand the potential rate base. More infrastructure investment, if approved, translates into higher regulated earnings over time.
On the other hand, affordability pressures in the state create tension. Strong economic growth increases power demand, but rising utility bills can spark political resistance, limiting how aggressive rates can rise.
In sum, management appears to be hitting its objectives. Earnings are on track. The capital plan is progressing. The tone is forward-looking rather than defensive.
But this remains a company operating at the intersection of climate risk, regulation, and capital markets. The recovery story is intact. The volatility potential has not been erased.
For investors, that balance is the story.
We suggest you place $PCG on your watchlist. It can create numerous short-term trading opportunities in the weeks ahead. Use the VantagePoint A.I. Daily Range Forecast to isolate possibilities.
Practice great money management and position sizing on all your trades.
It’s not magic.
It’s machine learning.
Disclaimer: THERE IS A HIGH DEGREE OF RISK INVOLVED IN TRADING. IT IS NOT PRUDENT OR ADVISABLE TO MAKE TRADING DECISIONS THAT ARE BEYOND YOUR FINANCIAL MEANS OR INVOLVE TRADING CAPITAL THAT YOU ARE NOT WILLING AND CAPABLE OF LOSING.
VANTAGEPOINT’S MARKETING CAMPAIGNS, OF ANY KIND, DO NOT CONSTITUTE TRADING ADVICE OR AN ENDORSEMENT OR RECOMMENDATION BY VANTAGEPOINT AI OR ANY ASSOCIATED AFFILIATES OF ANY TRADING METHODS, PROGRAMS, SYSTEMS OR ROUTINES. VANTAGEPOINT’S PERSONNEL ARE NOT LICENSED BROKERS OR ADVISORS AND DO NOT OFFER TRADING ADVICE.


