


The A.I. stock spotlight this week is Tidewater ($TDW)
Tidewater was founded in 1956 in New Orleans to haul supplies to offshore oil rigs when offshore oil rigs were considered futuristic madness. Its core mission has always been simple: move stuff and people to places nobody sane would build a drilling platform. It nearly drowned during the 2014–2016 oil crash and filed for bankruptcy in 2017, then resurfaced leaner, meaner, and much less sentimental about debt. Today it operates one of the world’s largest fleets of offshore support vessels serving energy companies across the globe. It matters because when offshore drilling heats up, Tidewater’s boats get busy, and when boats get busy, traders get interested.
Here’s what is fascinating: $TDW is not a natural gas producer. It does not drill wells, frack shale, or sell molecules. It provides the marine logistics that keep offshore oil and gas projects alive. Think of it as the Uber of the ocean, except the passengers are drill bits, cement, engineers, and occasionally someone regretting career choices.
The company runs a fleet of offshore support vessels, or OSVs, including platform supply vessels and anchor handling tug supply vessels. These are floating Swiss Army knives. They transport supplies, tow rigs, handle anchors, and generally make sure offshore drilling projects do not grind to a halt because someone forgot the pipes.
Its money comes from day rates. Energy companies rent Tidewater’s vessels for a daily fee. When offshore drilling activity rises, day rates rise. When oil companies panic and slash spending, day rates fall faster than a crypto influencer’s credibility.
Revenue is geographically diversified. The Middle East, West Africa, the North Sea, Latin America, and parts of Asia all contribute. National oil companies are major customers. So are international energy giants. If a company drills offshore and needs boats, Tidewater is likely in the bidding war.
Headquartered in Houston, Texas the leadership team came in after bankruptcy with one main idea: discipline. Fewer boats chasing too few jobs. Fewer heroic expansion plans. More focus on returns. The employee count is in the thousands globally, though the exact number fluctuates with fleet activity.
Competitors include Hornbeck Offshore, Seacor Marine, Bourbon Offshore, and other regional OSV operators. The competitive position is strong because the fleet is large and global. Scale matters in this business. If you can offer vessels across multiple regions, you win bigger contracts.
Now, let’s talk numbers, the part traders claim to care about.
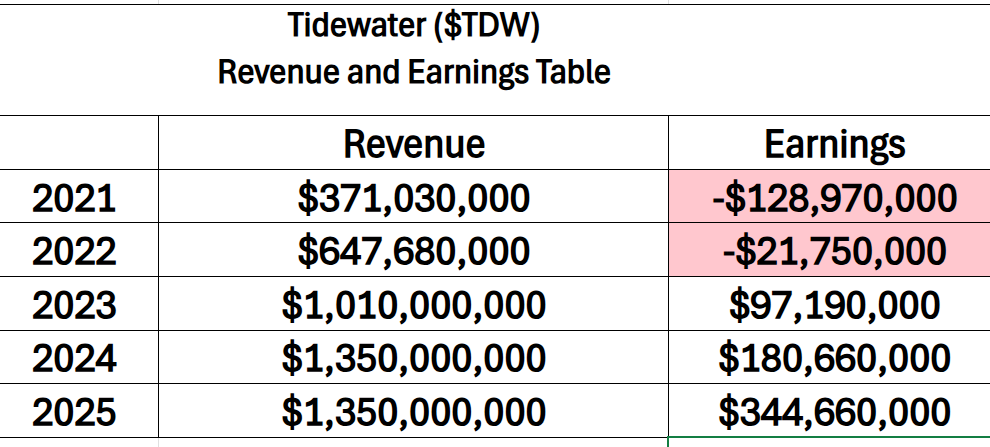
Revenue has been climbing as offshore activity recovers from its post-2014 coma and its pandemic hangover. Day rates improved meaningfully over the past two years. Utilization increased. When boats are working instead of parked, the income statement smiles.
Margins are expanding as pricing power returns. Offshore vessel businesses have high operating leverage. Once fixed costs are covered, incremental revenue drops to the bottom line at a more attractive rate. Translation: when business improves a little, profits can improve a lot.
Cash is healthier than during the bankruptcy era. The balance sheet was reset in 2017, and management has been careful not to repeat past sins. That said, this is a capital-intensive business. Boats are expensive to maintain, upgrade, and occasionally replace. Drydock costs are not optional. Saltwater does not negotiate.
Debt exists, but it is not the existential threat it once was. Traders sometimes misunderstand this part. They see “shipping” or “marine” and assume crushing leverage. In Tidewater’s case, the post-bankruptcy structure gives it more flexibility than the old days.
The arc here is unmistakable: Tidewater has moved from survival mode to operating leverage. What began as a fragile, loss-absorbing recovery has turned into a scaled rebound marked by accelerating profitability and stabilizing top-line growth. Revenue climbed sharply out of the downturn, reflecting a tightening offshore market and improved utilization, while earnings inflected even more dramatically, underscoring the power of pricing discipline in a capital-intensive business. The volatility that once defined the story has given way to margin expansion and earnings momentum, though the flattening of revenue in the most recent period hints that the easy gains from cyclical recovery may be behind it. What investors are really seeing is the transformation from cyclical repair to cash-generating enterprise, and the market tends to reward that transition handsomely until the next cycle tests it again.
These are the questions traders are whispering into their screens.
First, is offshore drilling really back, or is this a temporary sugar rush from high oil prices?
Second, are day rates peaking?
Third, will national oil companies keep spending if crude stabilizes instead of spikes?
Fourth, how does war in the middle east affect $TDW’s business model?
These are not philosophical questions. They are what determine whether $TDW trends higher or reintroduces shareholders to suffering.
Recent news over the last 30 days has focused on contract awards, fleet utilization updates, and general commentary about offshore capital expenditures from major oil companies. The new information is not that offshore is growing. We have known that. The new information is that spending appears durable, particularly in the Middle East and certain African markets.
Some of this is priced in. The stock has not been sleeping. But what Wall Street may still be underestimating is the length of the offshore cycle. Offshore projects are multi-year commitments. Once sanctioned, they do not get canceled because oil wobbles for a quarter.
Where expectations could be wrong is in assuming straight-line improvement. This is still an energy-adjacent business. Volatility is a feature, not a bug.
So why is the stock up?
Over the past 90 days, $TDW has benefited from strengthening oil prices, improved offshore sentiment, and steady operational execution. Energy as a sector has regained favor in a world that periodically rediscovers that fossil fuels still run most of civilization.
Year to date, the stock has outperformed many broader indices. Compared to the Energy Select Sector SPDR ETF, $TDW has often shown greater beta. When energy rallies, offshore service names can move harder because they are leveraged to capital spending, not just commodity price.
Analysts generally argue that the cycle has room to run because vessel supply is constrained. After years of underinvestment, there is not a huge inventory of idle, modern vessels waiting to flood the market. That thesis has historical support. However, analysts have also historically overestimated the industry’s ability to remain disciplined at cycle peaks. When cash flows surge, someone always gets ambitious.
The biggest upside surprise would be a sharper-than-expected increase in day rates driven by a global vessel shortage. If operators cannot find ships, they pay up. Operating leverage then works in shareholders’ favor.
The risks are not subtle. If oil prices decline significantly and remain low, offshore projects become less attractive. Shale, with shorter payback periods, regains favor. Vessel demand softens. Day rates compress. Earnings follow.
Another risk is geopolitical. Many of Tidewater’s operations are in emerging markets. Political instability can disrupt contracts. On the flip side, geopolitical tension can also increase energy investment. This is the sort of irony that keeps traders caffeinated.
The single biggest blind spot traders should respect is cyclical complacency. When everything looks good and management sounds confident, that is often when capacity creeps back into the market.
Now for the trader’s takeaway.
$TDW is best suited for cyclical traders who understand energy rhythms and are comfortable with volatility. It is not a widows-and-orphans utility. It is a leveraged play on offshore activity.
For the trend to continue, three things must stay true: oil prices remain supportive, offshore capital spending stays firm, and vessel supply remains constrained. Break any one of those, and the story changes.
Early trouble would show up in falling utilization rates or softening day rates before oil prices visibly crack. Watch the operational metrics. They whisper before the chart screams.
If you are a momentum trader, you care about higher highs and higher lows supported by improving fundamentals. If you are a value trader, you care about where we are in the cycle.
Tidewater survived bankruptcy, rebuilt its balance sheet, and is now riding an offshore revival. That is admirable. But energy cycles are like teenagers. They are emotional, dramatic, and prone to doing the opposite of what you expect.
Trade it with respect. Watch the data. And remember that boats float and print cash until they do not.
In this week’s stock study, we’ll break down the key indicators and metrics that guide our decision-making process, helping us determine whether to buy, sell, or stay on the sidelines for a particular stock.
- Wall Street Analysts Ratings and Forecasts
- 52 Week High and Low Boundaries
- Best-Case/Worst-Case Analysis
- Vantagepoint A.I. Predictive Blue Line
- Neural Network Forecast (Machine Learning)
- VantagePoint A.I. Daily Range Forecast
- Intermarket Analysis
- Our Suggestion
Although our ultimate decisions are guided by artificial intelligence forecasts, we still take a brief look at the fundamentals to understand the financial backdrop in which $TDW is operating.
Wall Street Analysts Forecasts
Here’s what jumps off the page at me when I confront the Wall Street Analysts Price forecasts.
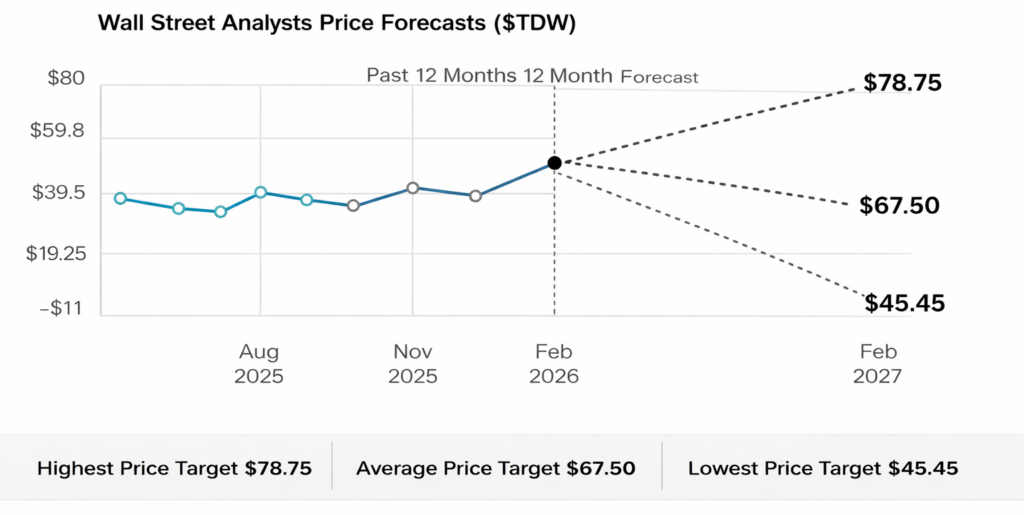
The stock is trading at around $87. The highest analyst target is $78.75. The average sits at $67.50. The low is $45.45. That means price is already above even the most optimistic published target. Consensus isn’t bullish. It’s behind.
Now look at the spread. The difference between the high and low forecast is $33.30. Divide that by the current price and you get roughly 39%. That’s the expected volatility band analysts are projecting over the next year. That’s not calm. That’s movement.
So, here’s the tension. Wall Street models point lower. Price action says stronger. Either analysts will be forced to raise targets to chase momentum, or price will cool off and drift back toward consensus. When price outruns expectations, volatility usually follows.
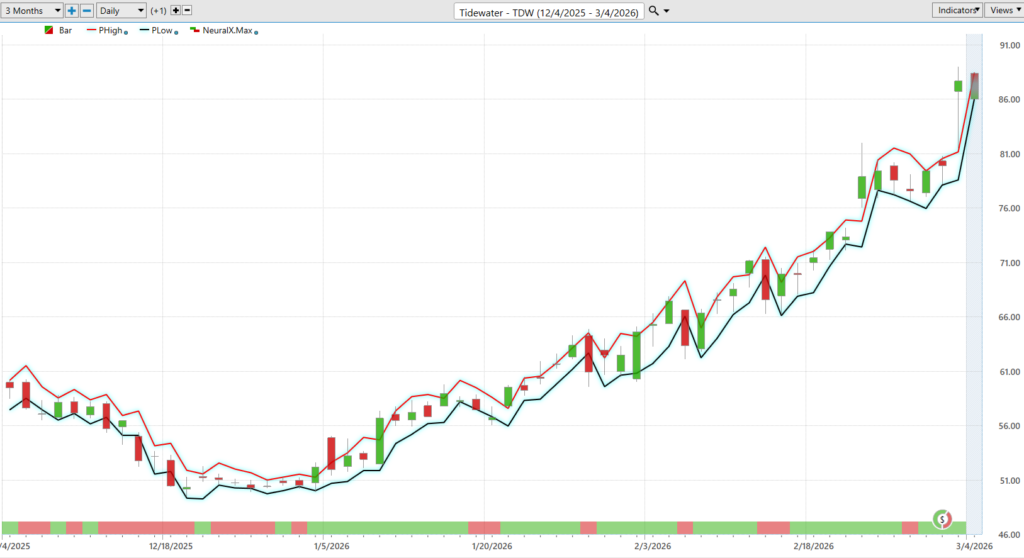
52 Week High and Low-Price Boundaries
The past year in Tidewater tells a familiar market story. The stock spent months digesting gains and moving sideways while investors debated whether the offshore energy recovery was real or just another short-lived bounce. That consolidation created a wide trading band between the low and the mid-range of the chart, reflecting a market that was cautiously optimistic but not yet convinced.
Then the character of the price action shifted. Higher lows began to appear, momentum strengthened, and buyers gradually gained control. What had been a range-bound debate turned into a directional move as investors recognized that offshore activity was improving and that Tidewater’s earnings power was expanding alongside it.
Now the stock is pressing toward the upper boundary of its 52-week range, a level that tends to attract attention from momentum traders and institutional capital alike. When a stock approaches a yearly high after building a long base, it often signals that the market’s narrative has changed from recovery to expansion. The distance between the yearly low and high also reveals the underlying volatility of the cycle. Energy service companies do not move politely.
For traders, these boundaries serve as more than historical markers. The 52-week low represents the point where pessimism reached its peak. The 52-week high represents where optimism is now being tested. As long as price continues to hold above prior breakout levels, the trend remains intact. But the closer a stock gets to the top of its range, the more closely the market begins watching to see whether momentum will accelerate or finally pause.
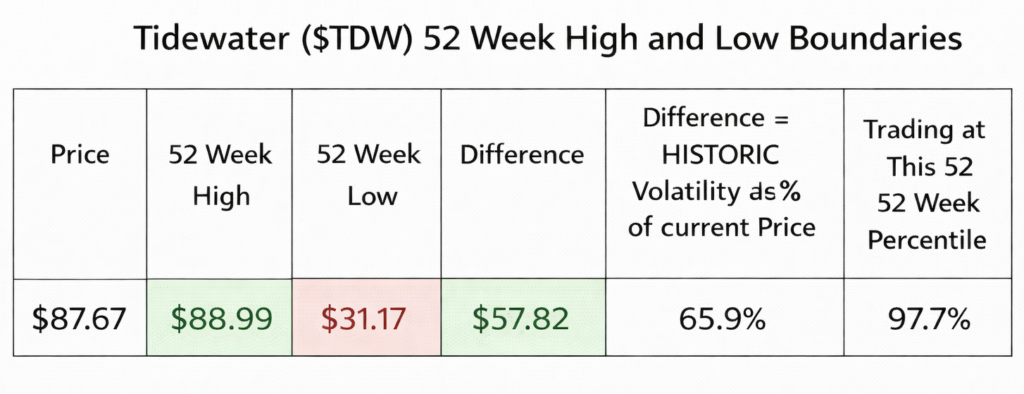
$TDW is trading very close to the top of its annual range. At 97.7% of the 52-week range, price is effectively pressing against resistance near the $88.99 high. The historic volatility reading of 65.9% tells you this stock has a wide trading range relative to its price, meaning breakouts tend to produce meaningful moves rather than small ones.
Best-Case/Worst-Case Scenario Analysis
Step back from the noise and something very simple emerges. Over the past year $TDW has moved in bursts. The stock rallies hard, pauses, corrects, and then rallies again. The pattern is unmistakable. What matters is not the daily headlines or the latest narrative about energy markets. What matters is the magnitude of the moves the stock has already produced.
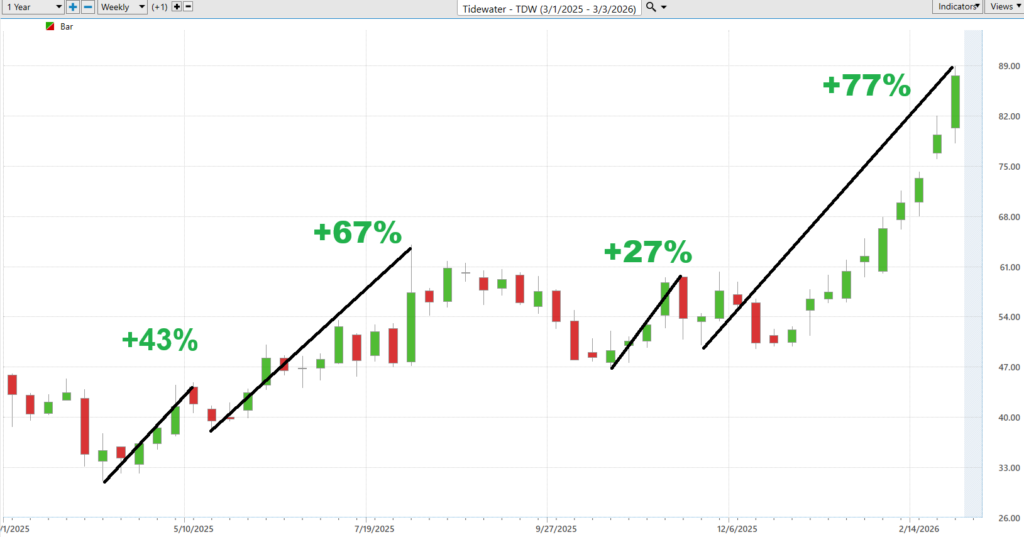
Look at the rallies. Over the past twelve months the stock advanced +43%, +67%, +27%, and +77% in uninterrupted runs. These are not small fluctuations. They are large institutional waves of capital pushing price higher. When momentum takes hold in $TDW, it tends to carry farther than most traders initially expect. The rallies are powerful and persistent, and they appear repeatedly throughout the year.
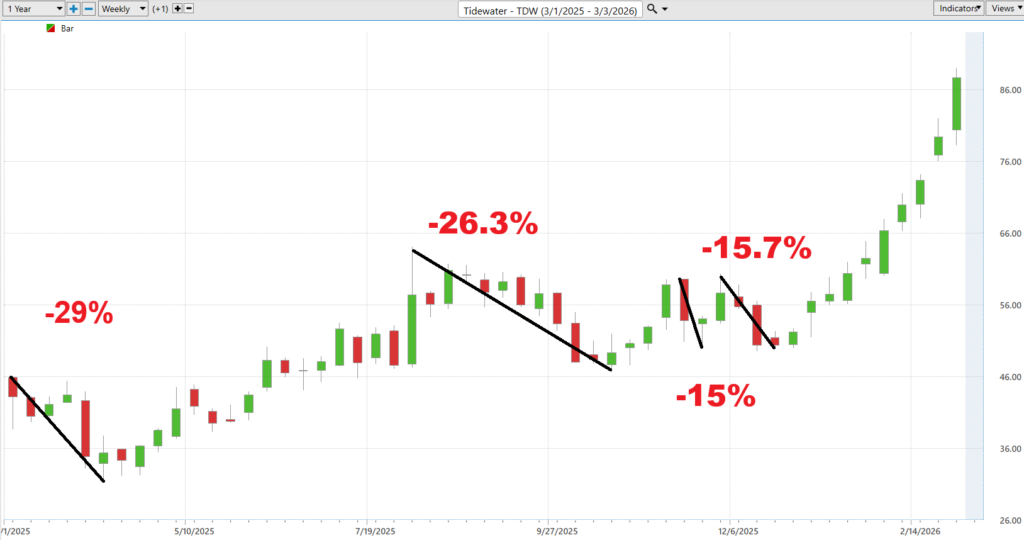
Now look at the other side of the ledger. The pullbacks measured -29%, -26%, -15%, and -15.7%. They are sharp, but they are also noticeably smaller than the advances. That imbalance is revealing. The declines interrupt the trend, but they have not been large enough to erase the larger upward moves. Over time the rallies have simply outweighed the corrections.
Viewed alongside the earlier 52-week boundaries analysis, the message becomes clearer. The stock moved from roughly $31 to the mid-80s, a range that implies roughly 60% historic volatility. Wall Street’s forecast range suggests a 39% wide movement ahead. In other words, the charts, the annual range, and analyst expectations are all telling the same story. $TDW is not a quiet stock. It is a stock that moves in large, decisive waves.
Tidewater’s history makes one thing clear. When it moves, it moves big.
Next, we compare $TDW to the broader stock market average.
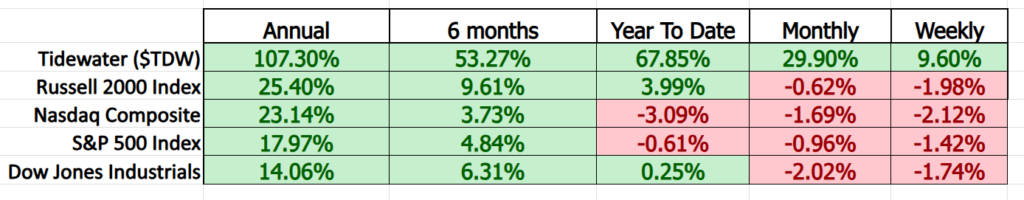
The evidence is unmistakable. $TDW is not just outperforming the market. It is leaving it behind. Over the past year the stock has gained more than 100%, while the major indexes such as the Russell 2000, Nasdaq Composite, S&P 500, and Dow Jones Industrial Average have delivered far smaller returns. The same pattern appears across every timeframe. Six months, year to date, monthly, and even weekly performance all show the same thing: $TDW is advancing while the broader market is struggling or moving sideways.
How do you tell a stock is outperforming? The answer is simple. You compare its returns directly against the major benchmarks. When a stock rises dramatically while the indexes produce modest gains or even losses, it means capital is flowing toward that stock. That is exactly what this graphic shows. Across every timeframe, $TDW is leading the market. And in trading, leadership matters, because money consistently moves toward strength and away from weakness.
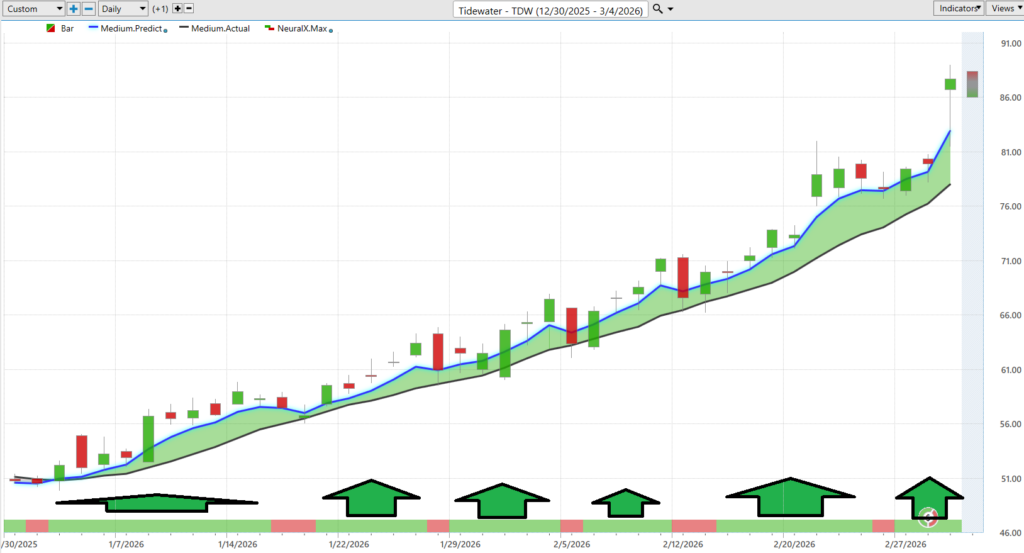
VantagePoint A.I. Predictive Blue Line
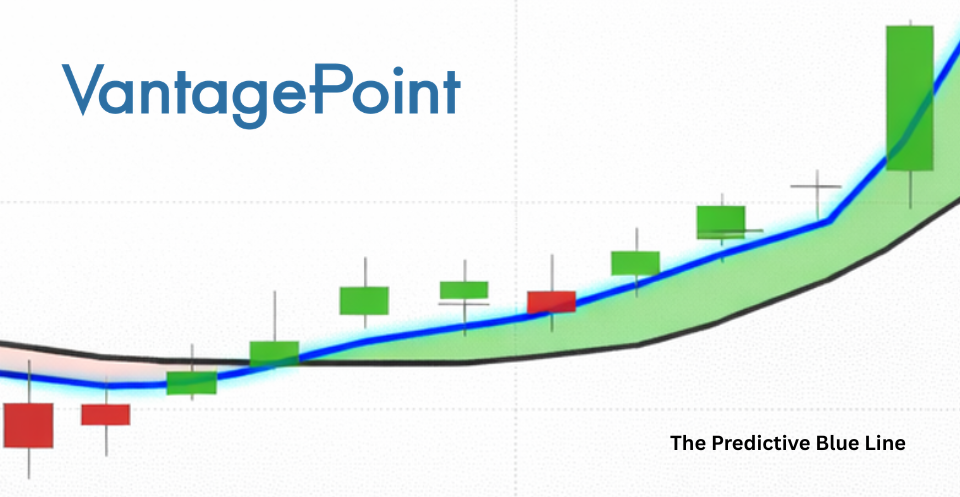
The trend in $TDW has been remarkably clear. When the most recent upward forecast was generated, the signal suggested that momentum was shifting decisively higher. Since that point, price has followed through in dramatic fashion. The stock has advanced 69.6%, climbing steadily as buyers continued to step in and push the trend forward.
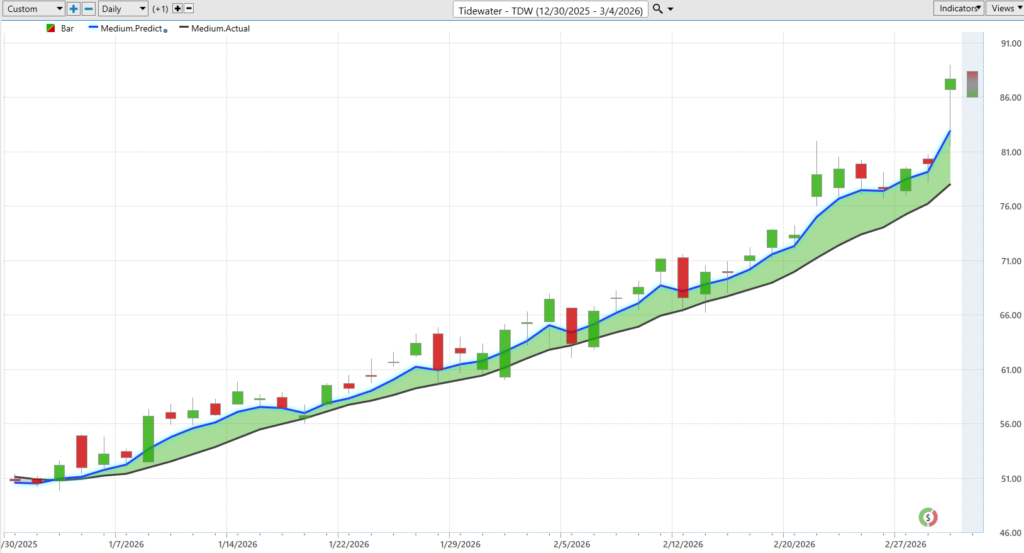
What makes this move notable is not just the magnitude of the rally, but the consistency of the advance. The forecast identified the turning point early, and from there the market began a series of higher highs and higher lows. As the predictive trend line continued to rise, price followed it upward. In markets, strong trends rarely appear quietly. When momentum begins to build, it tends to carry farther than most traders initially expect, and $TDW has been a textbook example of that dynamic.
VantagePoint A.I. Neural Index (Machine Learning)
A neural network for trading is a type of artificial intelligence model designed to identify patterns in financial market data and generate forecasts about future price direction. It is constructed using layers of interconnected computational nodes that mimic the way neurons communicate in the human brain. The model is trained on large datasets that may include historical prices, intermarket relationships, momentum measures, and other market variables. Through repeated training cycles, the network learns which combinations of inputs have historically preceded rising or falling prices. Its purpose is to detect subtle relationships that human analysis often misses and convert them into actionable forecasts. The benefit is that the system can continuously analyze enormous amounts of market data, adapt to changing conditions, and provide traders with objective signals based on statistical probability rather than emotion or subjective opinion.
A neural network analyzes large amounts of market data simultaneously and learns which patterns historically occurred before prices moved higher or lower. By recognizing those patterns in real time, it helps traders identify emerging trends and potential trading opportunities earlier than traditional analysis methods.
VantagePoint A.I. Daily Range Forecast
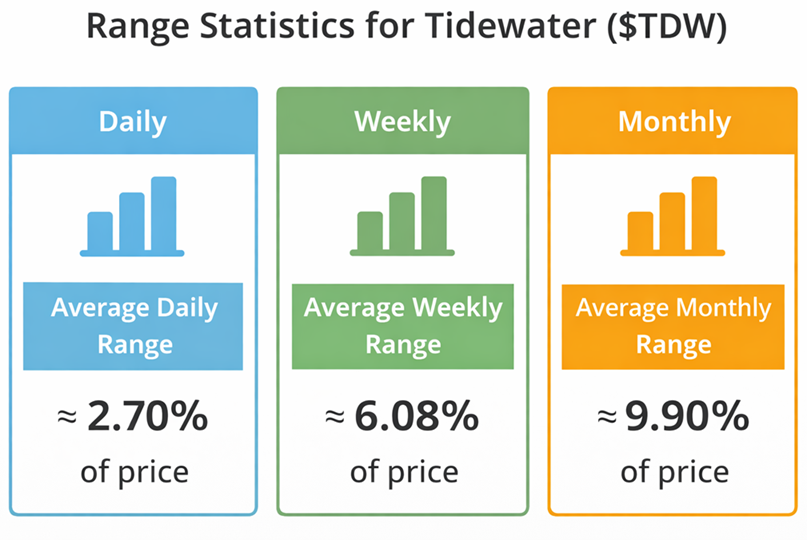
Look at the numbers in this graphic and a very simple truth about trading becomes clear. $TDW typically moves about 2.7% in a single day, roughly 6% in a week, and nearly 10% over the course of a month. That is the natural rhythm of the stock. Markets move. Prices fluctuate. And every single day traders are forced to make decisions without clearly knowing how far a stock might reasonably travel.
That is exactly why tools like the VantagePoint A.I. Daily Range Forecast matter. Traders do not need more opinions, more headlines, or more economic speculation. What they need is clarity. They need to know where the risk is and where the reward might be before they enter a trade. The Daily Range Forecast does precisely that. It calculates the expected trading range ahead of time so traders can see the potential upside opportunity and the potential downside exposure before committing capital.
In the world of professional trading, this is not a luxury. It is essential. Knowing that a stock typically moves 2% – 3% per day allows traders to frame their decisions with discipline rather than emotion. Instead of guessing where price might go, they can evaluate whether the opportunity is worth the risk. And that, in the end, is what separates speculation from strategy.
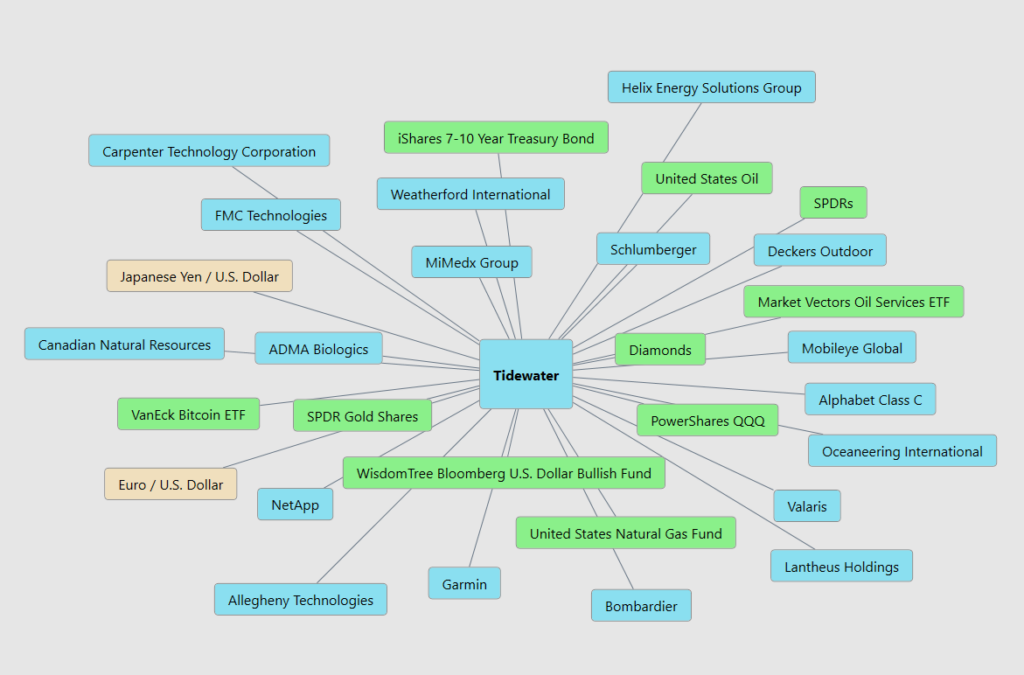
VantagePoint A.I. Intermarket Analysis
Intermarket analysis is the study of how different financial markets influence one another. Stocks, commodities, currencies, bonds, and sector ETFs do not move in isolation. They interact constantly through capital flows, interest rates, currency strength, and global economic demand. By observing these relationships, traders can identify the forces pushing a stock higher or lower before those forces fully appear in the price chart. The importance of intermarket analysis is simple: it reveals what is driving price, not just where price has been. When traders understand the surrounding markets that influence an asset, they gain deeper insight into momentum, risk, and the sustainability of a trend.
For $TDW, the key price drivers come from several interconnected markets. First is the energy complex itself, including crude oil, oil service companies like Schlumberger and Helix Energy Solutions, and sector ETFs such as the Market Vectors Oil Services ETF. When energy exploration activity expands, demand for offshore services rises, directly benefiting Tidewater’s business. Second are macro commodity and currency influences including gold, diamonds, and major currency pairs like EUR/USD and JPY/USD, which reflect global liquidity and economic activity. Third are broader capital markets such as SPDRs, QQQ, and interest rate instruments like the iShares 7-10 Year Treasury Bond ETF, which signal overall risk appetite and capital rotation. Together these markets form the macro ecosystem that helps determine whether capital is flowing toward offshore energy services or away from it.
Viewed through this intermarket lens, the graphic tells a revealing story. $TDW sits at the center of a dense network of influences, connected not only to energy markets but also to currencies, commodities, bonds, and major equity benchmarks. In other words, the stock is not simply reacting to company news. It is responding to the broader currents of global capital. When oil demand rises, exploration activity increases, or risk capital flows toward energy assets, the pressure radiates through this network and ultimately shows up in Tidewater’s price. Understanding those connections gives traders a clearer picture of the forces shaping the trend before they fully appear on the chart.
Our Suggestion
Over the last two earnings calls, Tidewater’s message has been clear and consistent. Management laid out a simple game plan years ago: tighten the fleet, improve utilization, raise day rates, and turn the company into a disciplined cash generator. By their own account, that plan is working. Offshore activity has been improving, vessels are staying busy, pricing power has strengthened, and the company has been generating strong cash flow. In plain English, management appears to be executing the strategy they promised investors.
But Tidewater is still tied to a very cyclical business. Their fortunes rise and fall with offshore drilling activity. When energy companies spend money exploring and producing offshore oil and gas, Tidewater’s vessels are in demand. When those budgets shrink, vessel utilization and day rates can fall quickly. Management acknowledged this reality on both calls and pointed to additional risks such as regional instability, operating costs, and the long history of oversupply cycles in offshore service vessels when the industry gets overly optimistic.
One issue management addressed directly is the potential for new vessel construction. Historically, when day rates rise enough, competitors rush in and build more ships, which eventually leads to too many boats chasing too few jobs. For now, leadership believes the market remains disciplined and that new vessel construction is unlikely until pricing rises significantly higher. In other words, the current supply environment still favors operators like Tidewater, but they are watching it closely.
For traders, the lesson is simple. The company appears to be executing well and the offshore cycle is supportive. But Tidewater remains a volatile stock tied to the energy cycle.
Always remember the first rule of trading: protect your capital. Practice disciplined money management on every trade. And because this stock can move sharply when energy sentiment changes, make sure your position sizing reflects the volatility before you pull the trigger.
Let’s Be Careful Out There.
It’s not magic.
It’s machine learning.
Disclaimer: THERE IS A HIGH DEGREE OF RISK INVOLVED IN TRADING. IT IS NOT PRUDENT OR ADVISABLE TO MAKE TRADING DECISIONS THAT ARE BEYOND YOUR FINANCIAL MEANS OR INVOLVE TRADING CAPITAL THAT YOU ARE NOT WILLING AND CAPABLE OF LOSING.
VANTAGEPOINT’S MARKETING CAMPAIGNS, OF ANY KIND, DO NOT CONSTITUTE TRADING ADVICE OR AN ENDORSEMENT OR RECOMMENDATION BY VANTAGEPOINT AI OR ANY ASSOCIATED AFFILIATES OF ANY TRADING METHODS, PROGRAMS, SYSTEMS OR ROUTINES. VANTAGEPOINT’S PERSONNEL ARE NOT LICENSED BROKERS OR ADVISORS AND DO NOT OFFER TRADING ADVICE.


