


VantagePoint AI Market Outlook for the Week of August 17, 2020
VIDEO TRANSCRIPT
U.S. Dollar Index
Hello everyone, and welcome back. My name is Greg Firman, and this is the VantagePoint AI Market Outlook for the week of August, the 17th, 2020.
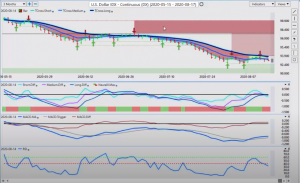
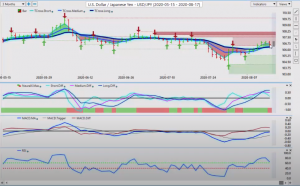
Now, to begin this week, we’ll begin where we always do with the very important US dollar index. Now we can see a very dark, ominous cloud forming over the dollar index here. A very heavy red verified resistance zone sitting up around the 97 level. We can see, we can assess that’s coming in at, or about the 97.81 high. But additional resistance now coming in, sitting at this high, which is down around the 93.98 mark. We would have to clear that level to take the pressure off the downside.
U.S. Dollar Index
However, at the current time we can see our T cross long 93.78 has held the entire week. We’re starting to turn lower. Our medium term, crossing our longterm predicted difference with the Neural Index, suggests that we could have further dollar weakness. Again, we’ve got our RSI, which is showing downward momentum, but our MACD is still up. So I wouldn’t say the dollar is down and out just yet, but it’s certainly is going to struggle in the days and weeks ahead. But remember we are in summer trading here and the markets are very thin and very illiquid.
Now, when we look at those key levels from VantagePoint again, 93.78 is a big one. If we click on our F8 in our software, we have been repeatedly challenging this long predicted. Now that’s 93.21, closing the week, however, at 93.08. So still a very bearish close on the dollar, which is surprising, respecting the fact we’ve had gold contracts taking a huge crash this past week.
GOLD
Now, just a little bit of information on a side note was once again, in my respectful opinion only, one of the contributing factors to this sell off on gold was not necessarily lack of demand for gold, but more profit taking as the rumors circulated that the CME and a number of the exchanges were all raising margin requirements on gold coins contracts, which ultimately they did. So that would have spooked a lot of people, the market. And once again, I’ve been around the block for quite a few years here, guys, I saw the exact same thing happened in 2010, 2011. The exchanges unilaterally raised margin requirements, forcing people out of those positions. Some of the people even getting a margin call. So I’m not saying that’s what happened this time, but I’m saying that that would definitely spoke a lot of people, or force them into some type of profit taking.
GOLD
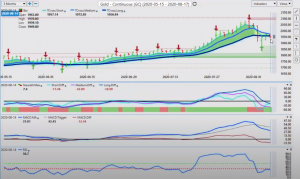
Now, that key level to start the week is now going to be the 1956 area. The T cross long, we’ve closed below that when we click on our F8, another very important, this blue line by itself with a correlation of 31 other markets acting as a pivot area. We’ve had a big sell off. And like a moth to a flame, we’ve come right back to that critical level. That level now is 1969. That is the level we want to watch to begin the week. Because again, this is an outlook. It’s not a recap here, guys. We’re talking about levels that are going to be hit next week, and what to do when they do get hit.
So right now we’re banging up against this 1969 mark. If we can get above that area, close above that area, then you know that you would have the green light for longs. Our RSI is still down. Our MACD is still down, but our Neural Index is turning positive and our medium predicted difference is starting to turn sideways. So a slight biased for further gold loans. But again, we’ve got to get above that level of 1969 and stay above that level, if gold has any future here at all.
S&P 500 Index
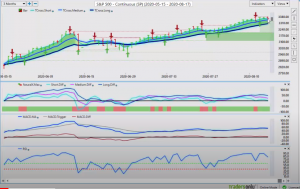
Now, how is all of this affecting stocks? Well, quite frankly, guys, it’s not. Stocks continue to advance. They ignore the dollar weakness, or the dollar strength. They ignore gold strength, or gold weakness. The stocks simply have a mind of their own. And this is not a new thing. When we go back on these charts here, guys, any shorts on the S&P 500 have been met with heavy buying. Even after the COVID, we can see back here in February and March, the height of the COVID, once we even had a hint that things were improving, the stocks go right back up to all-time highs.
S&P 500 Index
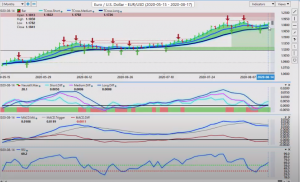
Now, I probably don’t have to tell everybody here that we are up against a very significant resistance area. Now, just because we’re back up here, guys, and we’re failing, doesn’t mean the stocks can’t go higher. Every time we’ve tried to predict the stocks going lower, or a crash, they simply go higher. So obviously we’ve got some manipulation in the market here, but let’s watch this area for next week. We’ve got our T cross long 3277. So only a breakdown below 3237 would take the pressure off the top side. When we click on our F8 for next week, our main pivot area, 3353. So we’re definitely getting a little toppy up here, but again, watch your T cross long. Because again, that could be a warning sign.
Now, our predicted differences are saying, “We’re losing momentum up here”. Clearly they’re saying that, our RSI is turning down a bit, but once again, guys, we must break through not one level, but two for a reversal on these particular stocks.
Crude Oil
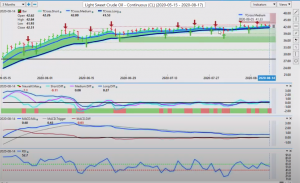
We can see that in this past week oil, basically just following the equities along, but still just wandering around here, looking for direction. We’ve got 41.53 on our downside here. Most of the indicators running flat. There really is still a high supply level, and a very low demand. Summer driving season, we’re having a bit of one, but not enough to push that higher. And again, with most of your manufacturers moving towards electric vehicles, the future of oil contracts certainly is in question.
Crude Oil
Bitcoin
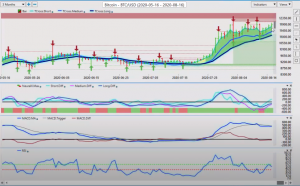
Now, with the weekly outlook, I like to include Bitcoin here, whether you’re a fan of Bitcoin or not. I think it’s worthy of a look here. Bitcoin very well could be the new gold here, guys. It’s very difficult to say. Because on that massive sell off on gold Bitcoin has strengthened during that breakdown. We had a bit of a move down here, back on August the 11th, but an immediate recovery. And you’ll notice where we’ve recovered off that VantagePoint medium term cross. Now again, the Bitcoin main level that we would want to watch is 11,097. But again, if we click on our F8 and use our blue line independently, we’ve got 11,504.
So once again, the correlation between gold and Bitcoin, somewhat breaking down there. But again, we had an outside interference with those exchanges raising margin requirements. So again, gold is still recovering, but we’ll see from here, Bitcoin, the indicators in VantagePoint are saying that we still have life left in Bitcoin here. So again, whether you’re trading the Bitcoin futures directly against the US dollar, or in some of the ETF side, the GBTC. Bitcoin continues to prove itself as a solid investment for not just 2020, but 2018 and 2019. Bitcoin has done very, very well. In fact, one of the top performers.
Bitcoin
Now, as we look at some of our forex pairs going into next week, again, the beginning of the week is going to be a little bit slower, but we are going to get the FOMC minutes on Wednesday. And I’ll be interested to see what Chairman Powell’s next step is here. But when we look at these key VantagePoint level, the euro is indisputably bullish. But that doesn’t necessarily mean it’s going to break out. We have a significant weekly resistance here that’s coming in at nine one 119.16, 119.08. There’s a lot of resistance up here. The one thing you want to understand when trading the euro US contracts here, guys, it follows gold. So if gold is going higher, the euro’s usually going higher. Ever since this COVID stuff started, the euro was actually hooked on to equities a little bit to, where that correlation between the dollar and equities is broken down and become inverse again, the euro has had more of a positive correlation to the equities. But it still needs gold higher.
Euro versus U.S. Dollar
Euro versus U.S. Dollar
So when we look at the indicators, we’ve had another down week on the euro, that’s two, three weeks in a row, but we’re bouncing off this key VantagePoint level at 117. The indicators are starting to turn long again. So this could be just the corrective move we’ve looked for in the euro, and now it’s getting ready to go higher. We’ve got our RSI breaking higher. So once again, it’s showing that we have some type of momentum. But my optimism on further gains on the euro, prior to the fed, remains heavily guarded. We want to wait and see what the Fed’s next move is. And that will also dictate the directional bias of not just the Euro, but of gold and potentially equities.
Swiss Franc versus U.S. Dollar
U.S. Dollar versus Swiss Franc
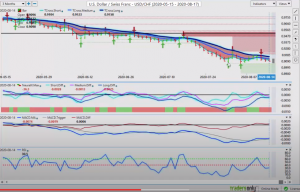
Now, once again, if the dollar, and that’s a very big if. If the dollar can recover, then US Swiss franc would start to recover also. We’ve got heavy support coming down at the low 90.56. That’s the level you want to watch to start the week. Our key T cross long 91.58. Once again, when we click on our F8, this is the level we want to watch. 91.05. If we can get back up above 91.05 and stay above that level, we could be looking to move higher. But we would want the Neural Index on board with this. So again, if we can get above 91.05, then we would have a very good long trade almost immediately. And we’re closing right around that level at 90.90. So we could have a good long right out of the gate here. But the Neural Index is saying that the initial move to start the week is going to be down. But our MACD is up. Again, very mixed signal at this time of year.
British Pound versus U.S. Dollar
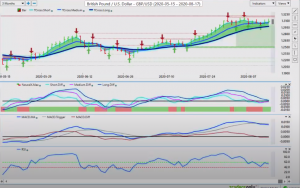
The pound dollar continues to hold below its yearly opening price. The pound dollar has been negative on the entire year here, guys. So when people say that something’s bearish, or bullish, or whatever, we would like to use the opening price of the year. It starts fresh. So if we look at the pound dollar, it’s had a miserable year. It’s been below the yearly opening price for basically the entire calendar year. But that does tell us that if we can break above 132.50, then the pound would break out to the upside. I don’t think there’s enough meat on the bone here yet for that to happen, but we are coming down, testing these VantagePoint key levels. 129.71, the T cross long for next week.
British Pound versus U.S. Dollar
When we click on our F8 to begin the week, our critical pivot area that we need to hold above to start the week, and for the week for that matter is 130.60. We want to keep a very close eye on this particular level. And the reason I’m saying that is that if we can hold above this level, then the pound on dollar weakness has a chance of getting back up to the 132.50 area. But once again, watch your downside pivot areas, your Neural Index and your main indicators. Our RSI is working back and forth in the 60/40 split channel here. And it’s not breaking one side, or the other. So we’re consolidating in this channel here, and that channel is running essentially between the high of 131.85 and our lowest point down here< sitting about 129.81. So these are the levels we’re dealing with right now. We’re still bullish, while above the T cross long.
U.S. Dollar versus Japanese Yen
The dollar yen this past week has had a very good upside move here, but that was largely due to the high correlation between the yen and gold contracts. So when gold pulled lower, the yen immediately weakened. And that gave the dollar the edge to move higher. But now we can see if we just put a line on our VP charts here, we can assess that we’ve got very strong resistance building at this particular high of 107.05. So we need to get above that. Our support side is very easily identified, our T cross long 106.29. If we start breaking down below that, then that would tell me that the equity markets are moving lower and gold is moving higher. So these are the things we want to keep an eye on to start the week. Gold is a major player in a lot of these. In not just the equities, but in a number of these different currencies.
U.S. Dollar versus Japanese Yen
U.S. Dollar versus Canadian Dollar
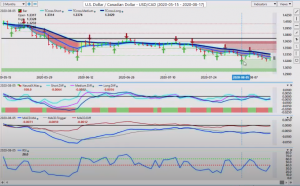
Now with the Canadian dollar, we can see we’ve got again, heavy support building up down here, running around this low around the 132. We’ve poked below the VantagePoint verified zone, but we’re just unable to close below it. And we keep bouncing off that low point of one 132.32. So again, when we look at our upside targets, we’ve got 133.55. We are likely to test that in early trade Monday, Tuesday of this week, but we have to see if we can get above that level. As again, when we’re talking about an outlook, we’re identifying levels, what we anticipate the market is going to come to. And then we can short it. We can buy a break of it, we can do all these things. But the main thing we have to understand is to know our levels. So when we click on our F8 to finish the week, we have failed yet again at the key VantagePoint level, the long predicted 132.84.
U.S. Dollar versus Canadian Dollar
So you can see how the market uses this level as a daily pivot area, as it comes up to, and then we look to see if it’ll get above it. But it gives us a potential premium entry point. So if we look at this 132.84, we’re closing 132.57. Our Neural Index, however, has gone from red to green. So the initial move to start the week is likely going to the upside. So watch the 133.55 area. If you’re going to look for shorts, that’s likely a premium place to do that.
Australian Dollar versus U.S. Dollar
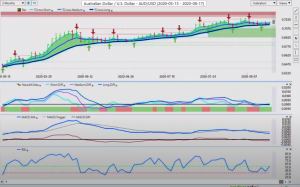
When we look at our two other main former commodity currencies. I’m going to call them equity currencies here now, guys, because the Aussie dollar is basically ignored gold contracts. As is the kiwi. They’re looking for the stock markets to continue to advance higher. As long as those stock markets are advancing higher, then so is the Aussie here, guys. Like I’ve said over the last several weeks on this weekly outlook.
Australian Dollar versus U.S. Dollar
So right now, we’re flatlining on the predicted differences. Our Neural Index is still positive, and we have a rising RSI. The RSI is at 59.2. You can see how I’ve modified my VantagePoint RSI to a 60/40 split. I’m looking for a break of the 60 level on the predicted RSI to show me that I’ve got momentum building. I have absolutely zero interest in playing any kind of overbought, or oversold signal here, guys. I’m looking for momentum. This is the kind of market we’re in. We’re in an algorithmic market here. And the algo programs, they don’t care about overbought or oversold, or any of those things there. They’re building on that momentum. And when their signals are triggered, they activate trades.
New Zealand Dollar versus U.S. Dollar
New Zealand Dollar versus U.S Dollar
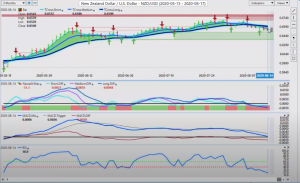
So right now, we’re hugging this T cross long at 71.34. If we click again on our F8, we are trying to retake that long predicted at 71.60. In my respectful opinion, if the stock market’s advance, you will see the Aussie advance. The same would apply to New Zealand here, guys. New Zealand is taking a bit of a hit on the RBZ, the Royal Bank of New Zealand there. But again, we’re sitting on these verified support levels that are just been very, very stubborn. That low point 65.03, we formed an additional level here at 65.24. So if we can break through both of these two levels, we should have an easy run down to the low point of 63.85. But then that would tell me that the equity markets have failed at their all-time highs. And we’re getting ready for another push to the downside. So with that said, this is the VantagePoint AI Market Outlook for the week of August the 17th…
Are you using A.I. yet?


