VantagePoint AI Market Outlook for the Week of December 21, 2020
VIDEO TRANSCRIPT
U.S. Dollar Index
Hello, everyone and welcome back. My name is Greg Firman, and this is the VantagePoint AI Market Outlook for the week of December 21, 2020.
Now to get started, we’re going to begin where we always do with that very, very important US dollar index. Now the dollar remains under heavy selling pressure. But when we look back at this, we can see under our verified support levels, we’re going back five years to find a level of support where the dollar may be able to bounce from. So if we come back and we look at this very closely, looking at this particular level, we can see that it was at approximately June 11, 2018 is the last time we were down at this particular level.
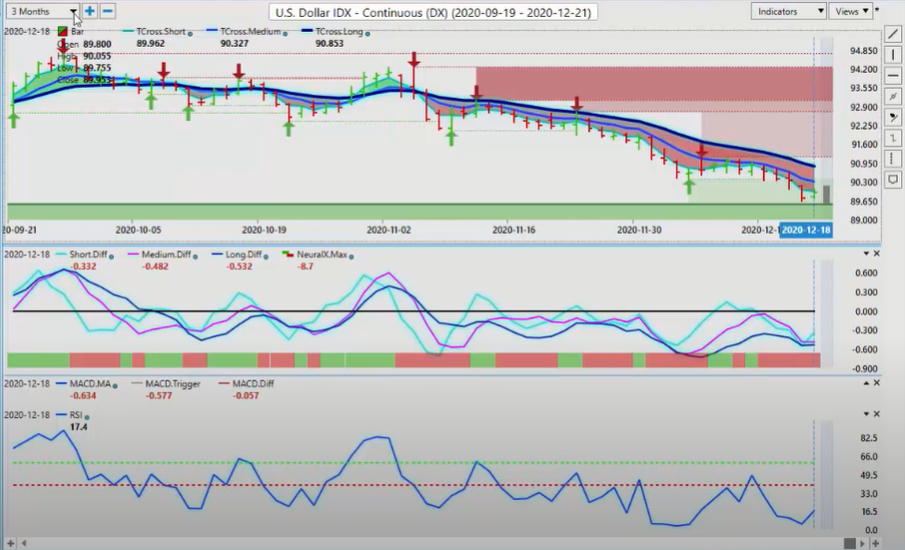
Now this level was actually a big level because as you can see, as the market move lower with a higher low, we then rally to a higher high. Now, I don’t know if we’re going to get back up towards the 103 level in 2020, but we will be looking to see if the dollar can hold above that major support level.
Now our TCross Long at 9085, we would have to get it back up above that level to take the pressure off the downside. The immediate level that we would watch for a pivot to move above would be the long predicted at 9018. If we can move above that level and close above that level, we should see the pressure come off the dollar, we’ve got a rising RSI. But our MACD, our predicted differences and our neural index are saying we still have likely more downside into the end of the year.
GOLD
Now with that, gold has tried to recover, but as you can see, it really is just kind of wandering around below the 1900 mark. We’ve moved above the key VantagePoint level, our TCross Long now 1862. I think we all know that level very, very well. It was the former range bottom here, where we had the breakdown. You can see here 1854, market broke down, and then it recovered back up.
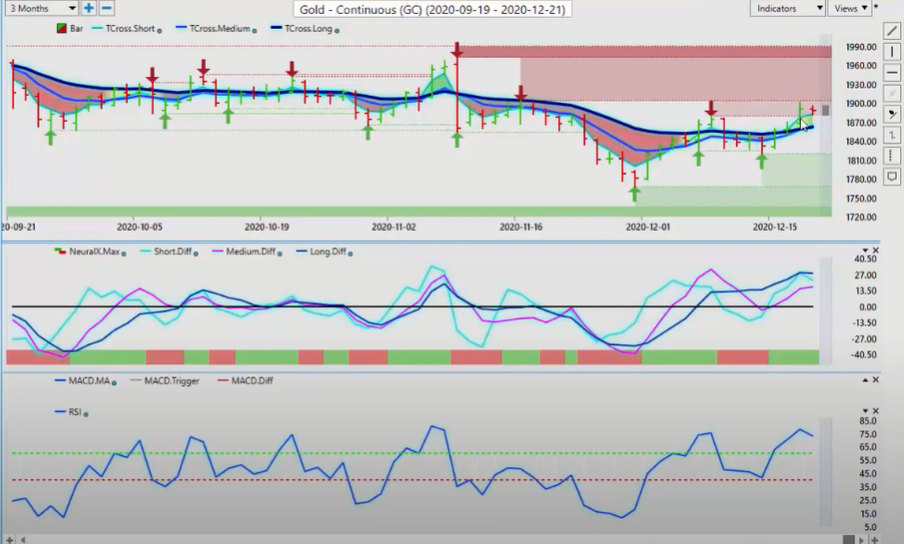
Now the only thing with gold contracts or gold longs in 2021, the problem with that likely is going to be that, of course, gold managed to get up here on COVID and Brexit and some of these things, that appear to be getting slowly resolved. I don’t know where we’re going to go with Brexit for sure, but I do know there’s a COVID virus vaccine. So, again, I think it’s going to be difficult for gold to really rally into the end of the year or into the new year. But for now, we will watch that key VantagePoint level at 1862.
When we click on our F8, we can identify an additional level of 1874 long still relevant while above that area. However, we can see that our medium term crossing our longterm predicted difference to the downside is a very, very powerful contrarian indicator. And whenever I see that crossing in the opposite direction in which the market is moving, I am very, very cautious in buying any particular currency, commodity, stock, anything like that, because it’s telling me that the medium term trend against the longer term trend is not as strong as it may appear to be.
Now, our RSI is starting to roll over a little bit, but our neural index is still positive, and I do see gold holding firm into the year end.
S&P 500
Same as equities. This one’s really getting tired to be doing analysis on this every week because it just keeps going higher, doesn’t it? It just doesn’t seem to matter. Every time the S&P puts in a new high, it then turns around and puts in another new high.
I did have a conversation about this with a few people this past week that we’re going short, and I just said, “Well, I can’t really endorse that.” Because when we look at this, we’ve had a corrective move lower directly back to that TCross Long at 3625 that we discussed in last week’s weekly outlook. We’ve been moving higher ever since.
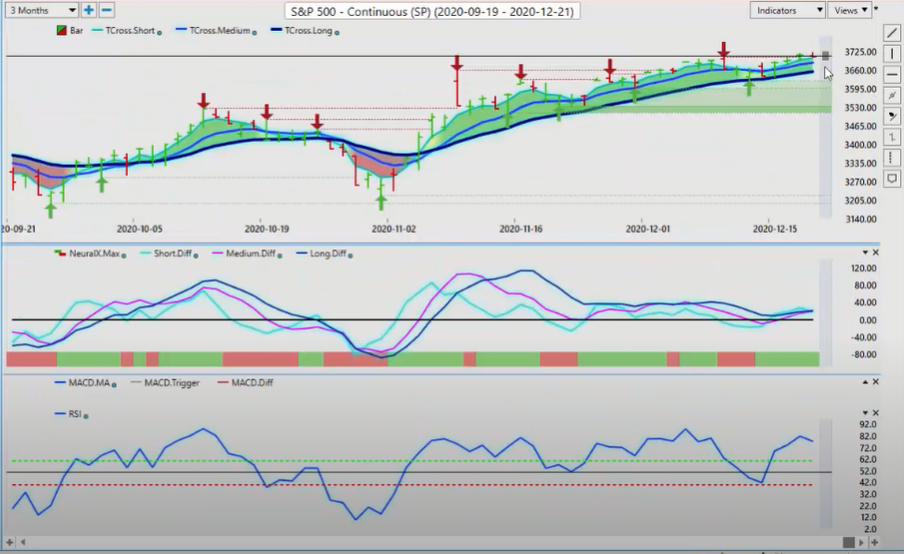
Now when we look at that critical level now from VantagePoint, our TCross Long 3655, we’ve come up about 20 or 30 full points, but we’re still holding above that particular level. When we click on our F8 and we use our predicted moving average by itself, we can see that main pivot is now 1392. So the S&P may still have challenges to extend past here, but the probability of a rally, another small rally into year-end is very, very high. Neural index is positive. RSI is firmly above the 50 and 60 level, MACD is holding in there. Our predicted differences are a little conflicted as the rate on top of each other, but we will continue to monitor this.
Crude Oil
Now if the S&P 500 does experience a sharp sell-off, oil is ripe for the same thing here. So right now I would anticipate, if nothing else, that oil will likely pull back towards the 4625 area. Or again, if we click on our F8, that key level is coming in at 4792. If we can break down and close below that level, then we could see oil take a much deeper pullback. Likely back into this lower 45 level is where I would say is more fair value for oil, not up where it currently is.
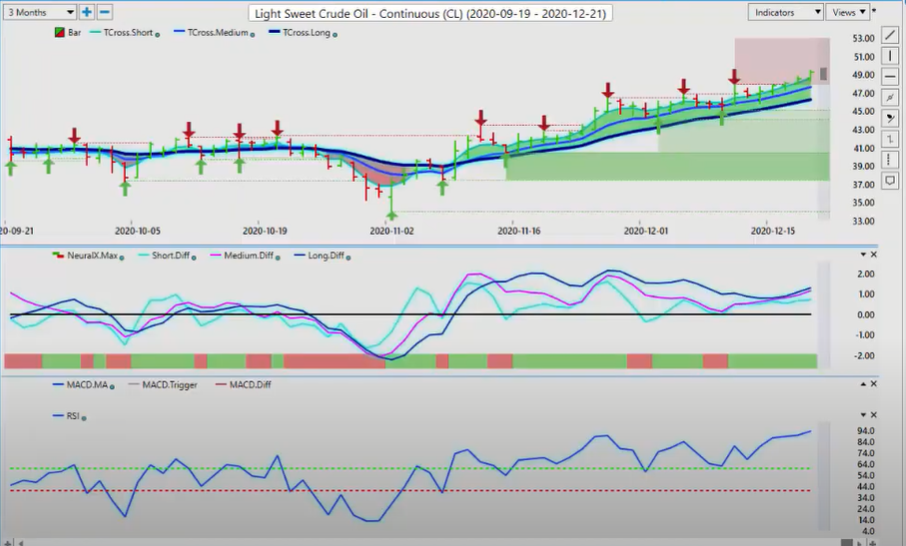
Now we’re also in a heavily overbought condition here, but in all honesty, guys, we’ve been in an overbought condition for weeks, and it continues to advance the same as the S&P 500.
Bitcoin
Now the main one that I’ve added to the weekly outlook, of course, is Bitcoin. I have been a very, very strong advocate for buying Bitcoin. I’ve made several remarks on this. I’ve ignored the Warren Buffetts of the world and just said, “Look, Bitcoin has doubled every year for the last 10 years. How is this not a good investment?” A number of trading firms try and restrict us from trading Bitcoin.
But, guys, I think it’s safe to say that it’s here to stay. We’ve broke the 20,000 mark. I’ve discussed this at length in the VantagePoint live training room that we stay long on this. And if we break the 20,000 mark, you should expect a very sharp spike higher. Again, I’m a strong advocate that Bitcoin is still grossly undervalued at the current levels. But for now, when we look at this, oour TCross Long, long well above 19,710, I’m not even sure if we’re going to retrace back to that level. But I am confident we are going to retrace back to 21242, the VantagePoint long predicted so watch that level for a potential entry.
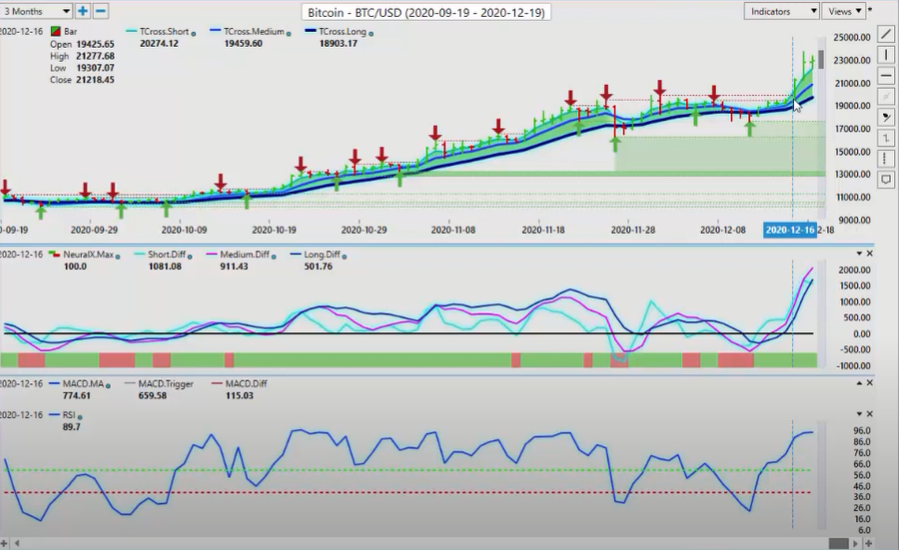
At this particular time, guys, as I’ve stated in the past, I can’t rule out 30, 40, 50,000 on Bitcoin. I really don’t know. There is no resistance up here, and when people often play a contrarian position, my question is always the same. Why are you going short? So, again, I don’t have a reason to short this at this particular time. If the medium term crosses the longterm predicted difference, then you can play a short back to those key pivot areas. But for now, it does look like Bitcoin has more upside in the near future with the 20,000, 19,700 mark, the key support level.
Euro versus U.S. Dollar
Now the euro is advanced and, again, one could argue it advanced with Bitcoin. But the euro is a very different animal than Bitcoin here. I think that Bitcoin has a very strong future. I don’t know if I can say the same about the euro currency, but for now it’s breaking above this level. I believe that we’ll probably move towards around the 123 area, and then we’re going to see a failure.
Because, again, when I look at the predicted differences in VantagePoint, measuring that trend, the slope of those differences is not pointing up. It’s actually sideways, suggesting we could pull back here at any time here. Either way, we are anticipating US dollar strength in that first couple of weeks of January. And, again, if anything, it could be a very good opportunity selling euro-US in anticipation of some dollar strength.
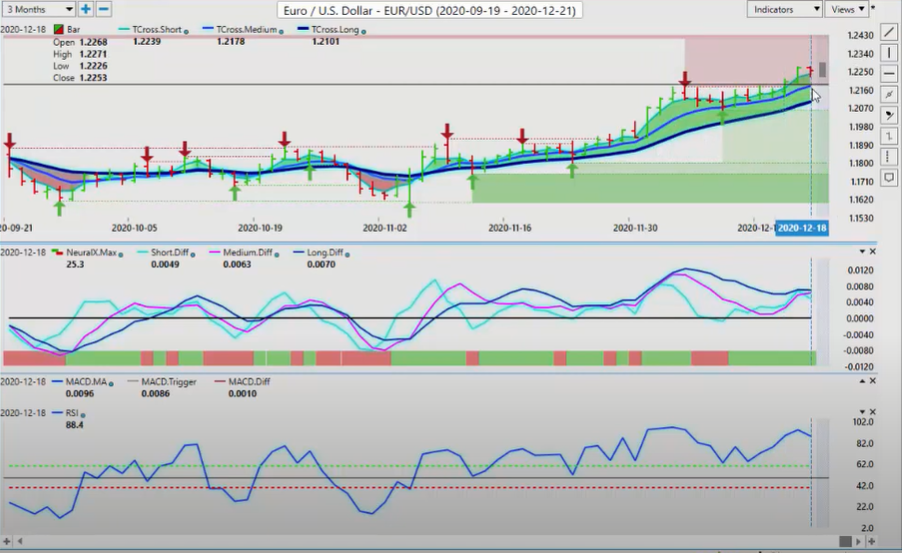
Now we would look for a pullback towards the 121 level. But, again, when we click on our blue line, our predicted moving average, a breakdown below 12198 should trigger a deeper corrective move for now and to see if this is the last hurrah for the euro in the next couple of weeks.
British Pound versus U.S. Dollar
Now, again, as we look at the British pound, I’ve been a pretty strong advocate of this one also, guys, to just stay clear of this. I don’t know about you guys, but myself, I want to trade around stability, or I never ever trade the news. The news is just noise, guys. That’s all it is. There’s a spike in the market, then a retracement, then another spike, and then usually it just goes back to normal.
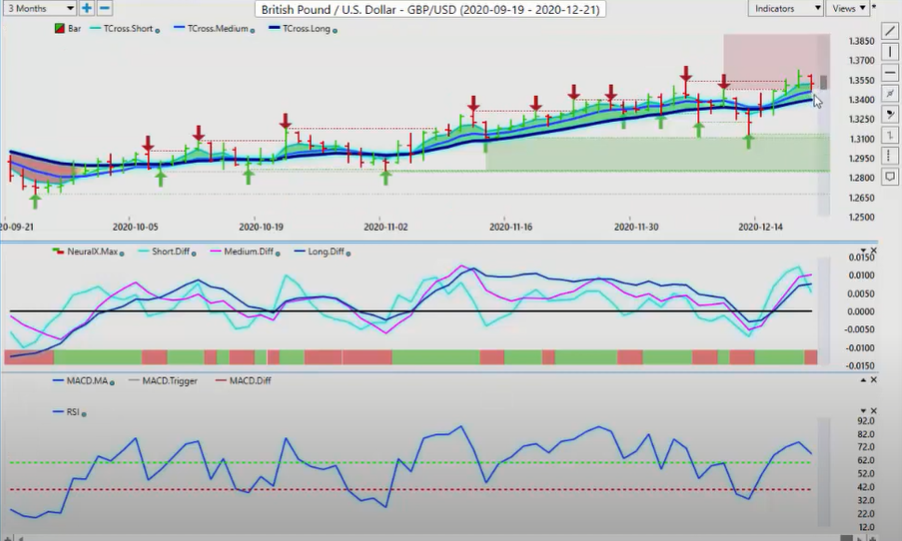
So, again, I don’t want to get involved with all the things that are Brexit right now. I don’t believe that they will come to an agreement. Maybe they will. And even the agreement they come to, is the UK going to benefit from that? Well, that’s left to be seen. So for now, once again, on any sign of US dollar strength, places to buy dollars would be this pair. But, again, I would strongly advise to just stay clear of this pair until Brexit is put to rest once and for all. Our key level, 13395, when we click on our F8, we can see very clearly that pivot area now 13477. I believe that it will come under selling pressure before the end of the year.
U.S. Dollar versus Japanese Yen
Now with the dollar-yen, the dollar-yen, I think that it’s starting to flatten out here. We’ve got a good verified support level here at the 103 level, but we need to get moving here and get out of this lower end of this range. So what I’ll be looking for this week or towards the end of the year, the start of the new year is a move back towards the 104 area, 10388, would like to see us get above that. You can see our predicted differences, they’re very mixed signal there, but it’s trying to put a long trade off there. So if we zoom in on this a little bit, you can see that that pink line there is trying to cross so that’s a warning sign that the dollar-yen could be getting ready to turn.
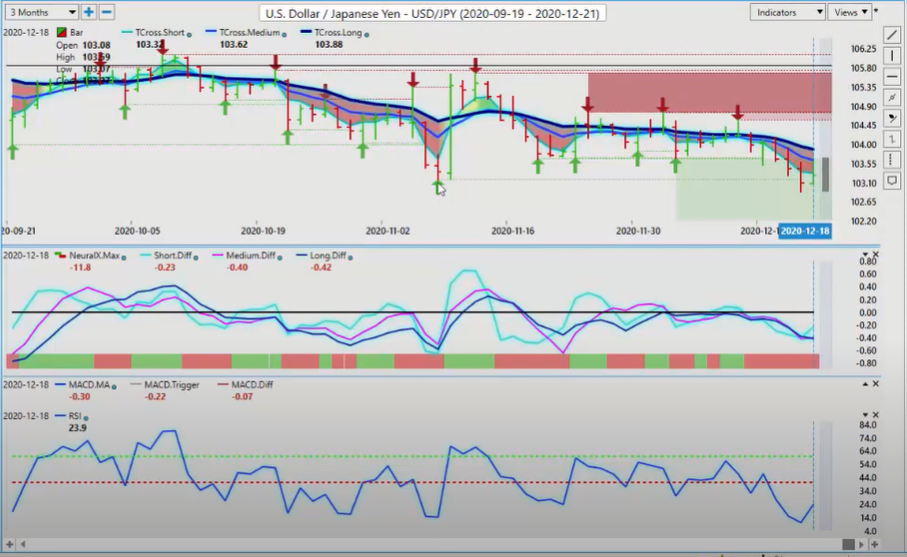
Now, again, we’ve got our RSI is starting to rise so we do need to watch this one very closely because there could be a very good buying opportunity down here if we anticipate the dollar will strengthen into the first couple of weeks of the new calendar year. So, again, we’ll be watching it very, very closely where we reset our yearly opening price. Yearly opening price I suspect for next year is going to be around the 103 area, maybe 10350. So, again, keep an eye out for potential longs. We’ve got a reverse check mark on the RSI, another warning sign that we could be getting ready to turn on this.
U.S. Dollar versus Canadian Dollar
Now with the US-Canada, once again, we’ve worked on this one in the VantagePoint live training room also. But I’ve been a strong advocate for longs down here, and that the Canadian dollar is grossly overvalued at these particular levels. The reason I say that is I am domiciled in Canada, and we are about to go into a full-blown lockdown again with very limited vaccine capabilities. So, again, this does not bode well for the Canadian dollar, regardless of US dollar weakness.
The Canadian dollar is weakening with the US dollar. We’re starting to come off this heavy support zone down here. Our predicted differences are pointing up. They’re rising. Our neural index is positive, and our RSI has managed to sneak above the 50 level. If we can get above the 60 level on the predicted RSI, then this thing should fly much higher, potentially very quickly.
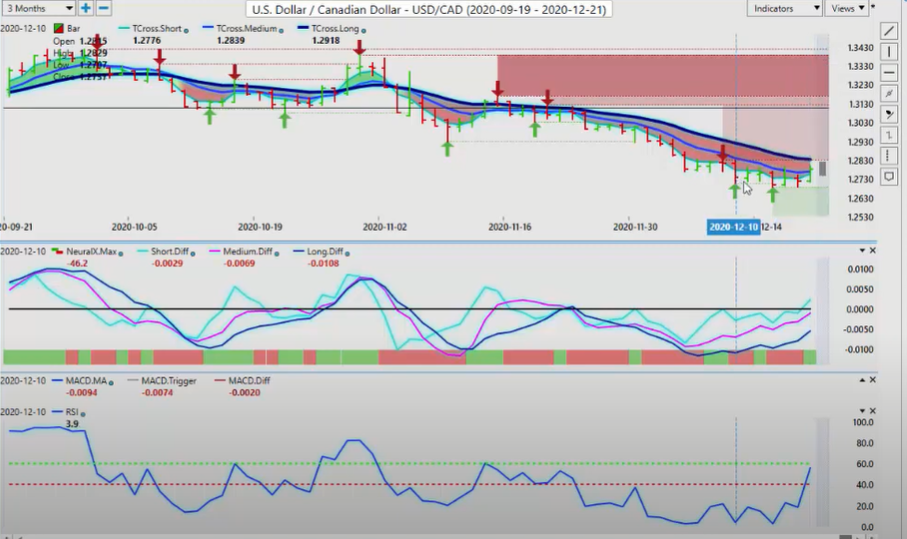
When we look at, again, our predicted moving average by itself, that key pivot area is 12755. That is your support level to start the week to look for potential longs. So, again, we’ll continue to monitor oil and equities. They are definitely helping the Canadian dollar. But even with the strong moving oil and a strong move on the S&P 500 and gold, the Canadian dollar is not responding to it. We can visually see we have no sellers down here, guys, okay?
Australian Dollar versus U.S. Dollar
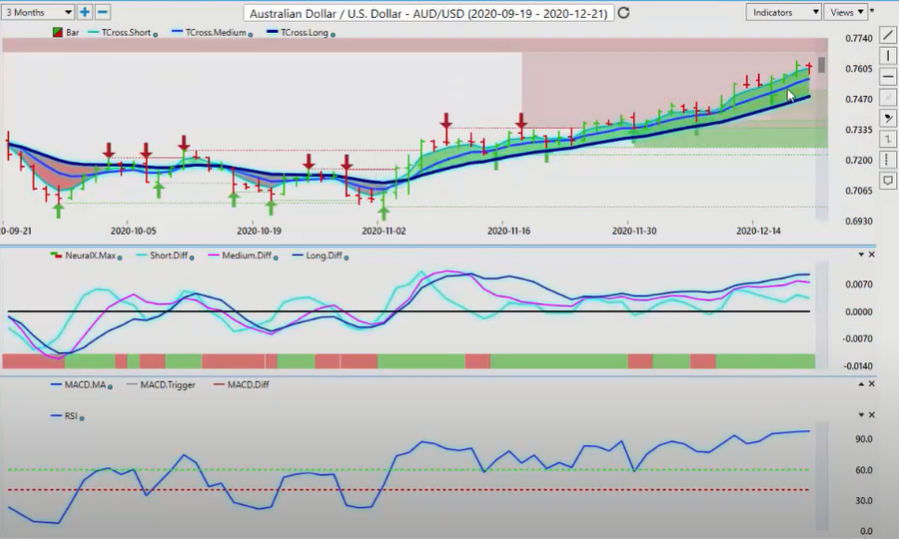
Now with the Aussie and the New Zealand, these rallies are getting a little tired here. So, again, if we are expecting, anticipating dollar strength in the first two, three weeks of the new calendar year, then I would be looking at places like Australia-US, New Zealand-US and US-Canada for trades because, again, they’re very susceptible to moves in not so much commodities, but equities. Right now we’ve pulled a considerable distance from 7481, the VantagePoint TCross Long, so we’re looking for a potential retracement to that level.
But once again, we do need a reason to sell this. We don’t want to sell it just because we think it’s going lower. So I’m going to wait until I can get these predicted differences pointing down. The predicted RSI 97.5, there isn’t a whole lot of room for this to move to the upside. It’s about as overbought as you can possibly get. Again, the indicator has been overbought for weeks.
As I’ve always stated, I don’t trade off of overbought and oversold conditions because you’re basically telling the market to stop going higher or lower and turn around and go the other way. Trust me, the market is not listening to you, and they’re not listening to me. They have their own agenda.
So we’ll monitor this for a potential turning point. That turning point will come when we slip below this key pivot area, 7576. If we slip below that blue line, then I would even be so bold as to suggest putting limit orders just below that line, maybe a very effective way to trade this particular pair right now and say, okay, we’re expecting a corrective move. I know exactly what that level is, which is 7576. So I put a limit order at, say, 7560. And when it breaks down below there, we’re actually sitting there waiting for it.
That’s how you get in front of some of these markets. But, again, I would like to see that neural index. I would like to see us closing below the blue line, and I would like to see the neural index turning from green to red.
New Zealand Dollar versus U.S. Dollar
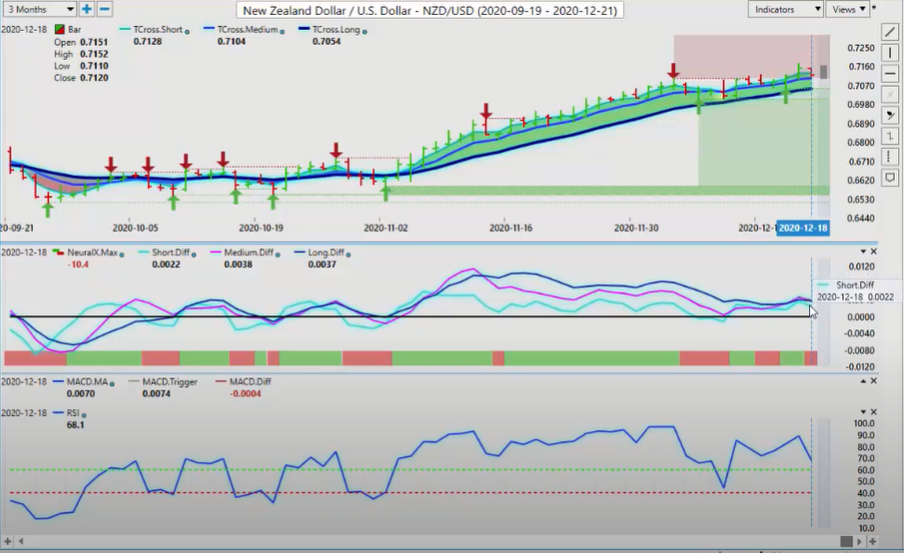
The exact same thing, guys, would apply to New Zealand. We’re getting very toppy up here, TCross Long, 7054, but you can see we actually do have a sell signal trying to form. The neural index is on-board in this particular pair. But always remember, guys, the Aussie and US and New Zealand-US is virtually the same trade. So is this particular pair a leading indicator to confirm our US Canada longs and to confirm that there could be very, very good value in buying dollars against the Aussie in the days and weeks ahead?
So with that said, this is the VantagePoint AI Market Outlook for the week of December 21…
Are you using A.I. yet?