


When we talk about the Santa Claus Rally, it’s all about the stock market experiencing some serious gains right around the holiday season. It’s like a year-end bonus for investors, and it’s been happening often enough to grab our attention and speculate about the upcoming year based upon this annual phenomenon occurring.
We’re not entirely sure if this is just Wall Street getting caught up in the holiday spirit or if there’s something more to it. Some say it’s all in our heads, while others believe there might be some financial wizardry at play. What we do know for sure, though, is that history paints a clear picture – stocks tend to rally as we bid farewell to the old year and welcome the new one.
It’s a fascinating calendar seasonality, and while we might not have all the answers, one thing is certain: the stock market likes to end the year on a high note. So, get ready to deck the halls, and keep your eyes on those stock tickers, because when it comes to the Santa Claus Rally, history suggests that there’s more to it than meets the eye.
The Santa Claus Rally is an intriguing market trend that has investors and financial analysts eagerly awaiting the final days of the year. It refers to the historically observed tendency of the stock market to experience a surge in the final week of December, typically between Christmas and New Year’s Day, and sometimes extending into the first few trading days of January.
The origins of the Santa Claus Rally are shrouded in mystery, much like the man himself. The term was popularized by Yale Hirsch, the creator of the Stock Trader’s Almanac, a revered resource among traders and investors. Hirsch first noted this curious market phenomenon in the early 1970s. Hirsch unveiled an astonishing observation: from 1950 to 1971, the S&P 500 had seen an average gain of 1.5% during those pivotal seven days. This trend, extending since 1950, has seen the broad market index posting an average gain of 1.3%. Remarkably, in 34 out of the past 45 years, or more than 75% of the time, these particular days have bestowed market gains.
Yet, what truly captured Hirsch’s imagination was not just a catchy name for this recurring market phenomenon. Rather, he saw in it an indicator of what lay ahead for the stock market. In his own words, “If Santa Claus should fail to call, bears may come to Broad and Wall,” a poetic reference to the New York Stock Exchange’s iconic location. Hirsch meticulously tracked three similar indicators as barometers for the upcoming year’s market performance: the Santa Claus rally, the initial five days of trading in the new year, and the January barometer, examining the market’s performance in the first month. Among these, the Santa Claus rally stands as the most renowned.
The Santa Claus Rally has been on the radar of market analysts for over half a century. While its origins can be traced back to the ’70s, market observers have been analyzing its patterns and potential implications for even longer. It’s safe to say that this is no flash-in-the-pan market observation.
The Santa Claus Rally, it’s not just a homegrown tradition limited to the U.S. of A. Oh no, this year-end phenomenon has spread its holiday cheer across the globe. Now, they might not call it by the same name everywhere, but you had better believe it’s happening in many other stock markets around the world.
Some clever analysts out there reckon this rally might have a little something to do with the institutional investors taking a break during the final days of December. You see, when the “smart money” is away, the retail investors come out to play. And that, my friends, can leave the market ripe for a bit of holiday influence from the everyday folks.
But here’s where it gets interesting – traders, well, they’ve got their fair share of market superstitions. Some say that if the Santa Claus Rally decides to take a year off, it’s like a warning sign for the market, a bearish omen for the year ahead. On the flip side, there’s this charming belief that a jolly rally can actually bring “good luck” to the markets in the coming year. It’s like putting up your Christmas lights and hoping for a season of prosperity.
But here’s the reality check – while the Santa Claus Rally has a pretty solid track record, we’ve got to remember that the world of finance is about as volatile as a snowflake’s path on a summer’s day. Past performance? Well, it’s not a crystal ball, and it sure doesn’t guarantee what the future holds.
There are several theories as to why the Santa Claus Rally might occur. One of the most prevalent explanations is the psychology of the market. The holiday season is often associated with optimism, generosity, and a sense of renewal. Investors may be influenced by these positive sentiments, leading to increased buying activity.
Another theory suggests that year-end bonuses and tax considerations come into play. Investors may allocate more capital to the market as they receive their year-end bonuses, and tax-loss harvesting could be a motivator for some to rebalance their portfolios before the year’s end.
The precise causes behind the Santa Claus Rally remain elusive, shrouded in market mystique. However, several plausible explanations are made regularly:
Low Trading Volume: During this period, institutional investors typically step away from the market. This results in reduced trading volume, making the market more susceptible to retail investors, often known for their bullish sentiments.
January Effect: Some investors may purchase stocks in anticipation of the January Effect, a phenomenon where funds are reinvested after tax loss harvesting in December.
Tax Loss Harvesting: It’s possible that investors are already redeploying funds from tax loss harvesting activities at the year’s end.
Optimism and Bonuses: The week between Christmas and New Year’s carries a sense of hope and optimism for the year ahead. Additionally, year-end bonuses and holiday gifts provide individuals with capital to invest in the stock market.
Self-Fulfilling Prophecy: As the Santa Claus Rally has gained notoriety, it has become something of a self-fulfilling prophecy. If investors believe in its potency, they may alter their investment strategies, accordingly, further perpetuating the pattern.
One of the burning questions regarding the Santa Claus Rally is whether it has predictive value for the following year. Historically, when Santa comes to Wall Street, he brings with him the gift of positive returns for the year ahead. In other words, a strong rally in the final days of December is often seen as a positive omen for the market in the coming year.
However, like all things in finance, past performance is not a guarantee of future results. While the rally’s historical correlation with positive market performance in the following year is notable, it’s not infallible. Market conditions can change, and external factors can disrupt this seasonal pattern.
The Santa Claus Rally has captured the imagination of investors and the media alike. It’s a feel-good story that coincides with the holiday season, making it a hot topic for financial news outlets. Investors often look for any edge they can get, and the allure of a potential market gift from Santa Claus himself is hard to resist.
The discoverer of the Santa Claus rally, Yale Hirsch saw a very tight correlation between the Santa Claus rally and the month of January performance. If they were both negative it was a bearish signal for the calendar year. Inversely, if they were both positive, it was a bullish signal for the following year.
Let’s crunch the numbers to be able to analyze the numbers for ourselves so that we can determine some high probability opinions.
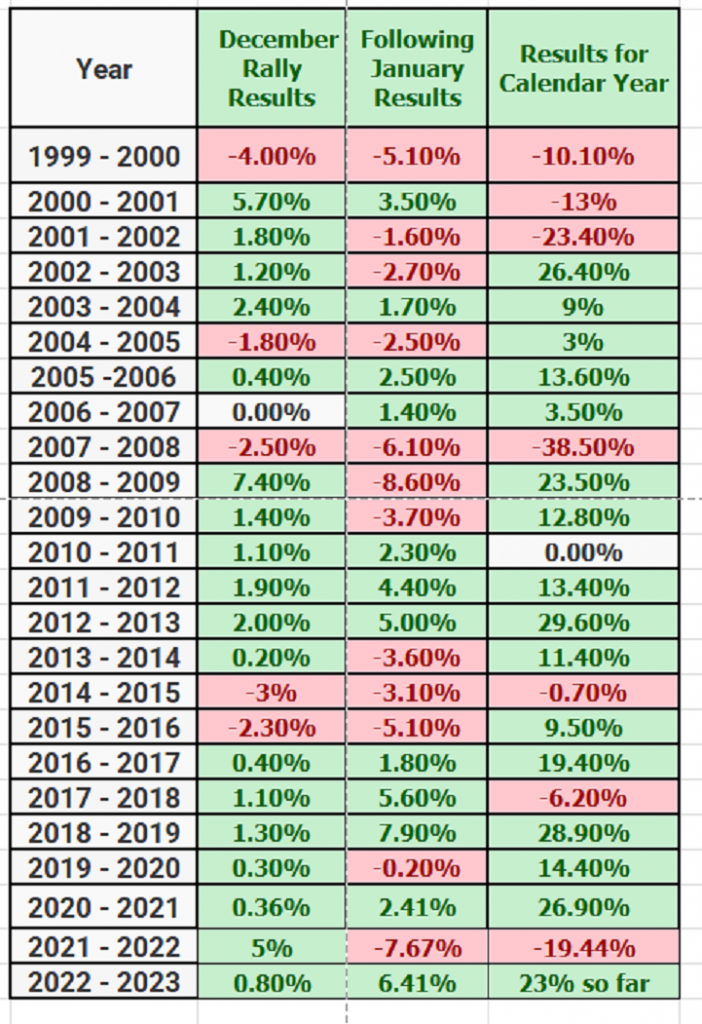
In the annals of market history, 1999 stands out as a notable year. The Santa Claus Rally in that year produced the worst result, with a disappointing -4.0% return. As if to add salt to the wound, January following that rally was down -5.1%. This dismal start set the tone for the year, which ended with the market down a cumulative -10.10%.
Now, fast forward to 2007, and we see a similar story unfolding. The Santa Claus Rally generated a less-than-jolly –2.50% result. January, in that case, culminated in a discouraging -6.1% outcome. But that was just the beginning. 2008 turned out to be the year of the Great Financial Crisis, a harrowing chapter in market history, with the market ultimately plummeting by a staggering 38.5%.
Then there’s 2014, a year that, unfortunately, echoed the pattern we’ve seen before. The Santa Claus Rally delivered a negative -3% return, and January was also in the red, with a negative -3.1% result. As a result, the calendar year concluded with a tepid -0.7% performance.
But let’s not get stuck in the past. If we peek at the most recent calendar year, things start to look a bit brighter. Last year, the Santa Claus Rally managed to generate a more respectable 0.8% in returns. January followed suit with a robust 6.41% in positive gains, signaling a promising start to the year.
Now, as for 2023, well, it’s been nothing short of remarkable so far. We’ve seen an impressive 23% surge in performance since the year began. It’s early days, but it’s certainly turning heads and sparking conversations among market watchers.
So, as we crunch these numbers, it becomes evident that the Santa Claus Rally isn’t just a whimsical market tradition; it can have real implications for market sentiment and performance in the subsequent year. It’s a reminder that while history can provide valuable insights, the market always has a knack for throwing us a curveball or two.
Now, what happens if Santa decides to skip Wall Street this year? Does it predict a negative market for the following year? Well, not necessarily. While the absence of a Santa Claus Rally may raise eyebrows and cause concern among some investors, it’s not a definitive signal of doom and gloom. Markets are influenced by a multitude of factors, and a single rally, or lack thereof, cannot predict the entirety of the next year’s performance.
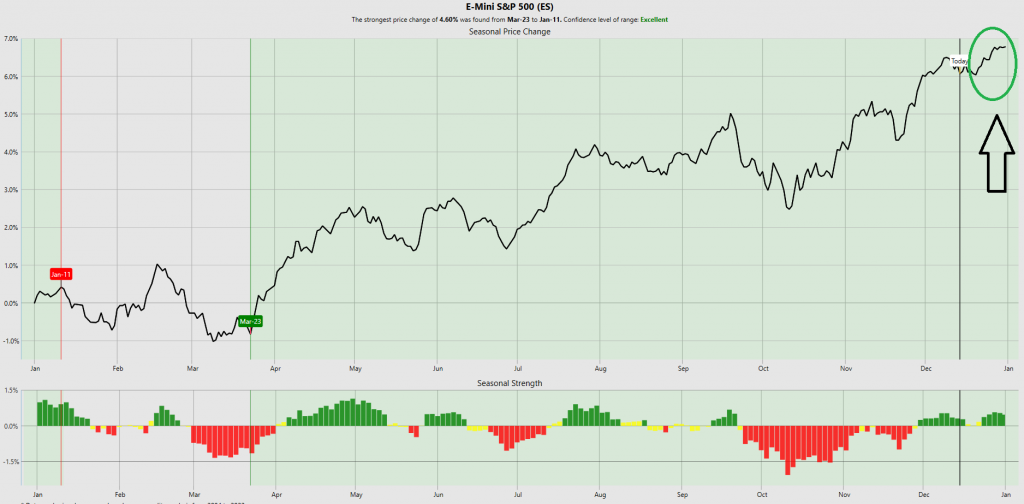
However, the Seasonal tendency as evidenced by the following chart clearly illustrates the bullish forces at work during the final week of the year.
Now, let me tell you something, folks. This Santa Claus Rally theory, it’s got some serious data backing it up, and that’s a fact. But let’s not kid ourselves; successful trading isn’t just about jumping on board the latest trend. No, it’s about context, about understanding the bigger picture.
Let’s talk about the big question on everyone’s mind: Will Santa make his grand entrance in December 2023? Well, if we look at the history books, it sure seems like he’s got a good track record.
Since we started keeping tabs in 1950, December has delivered positive returns a solid 75% of the time. That’s right, 75%! And when the market was already in the green heading into the final month, well, the average gain for December was a respectable 1.6%.
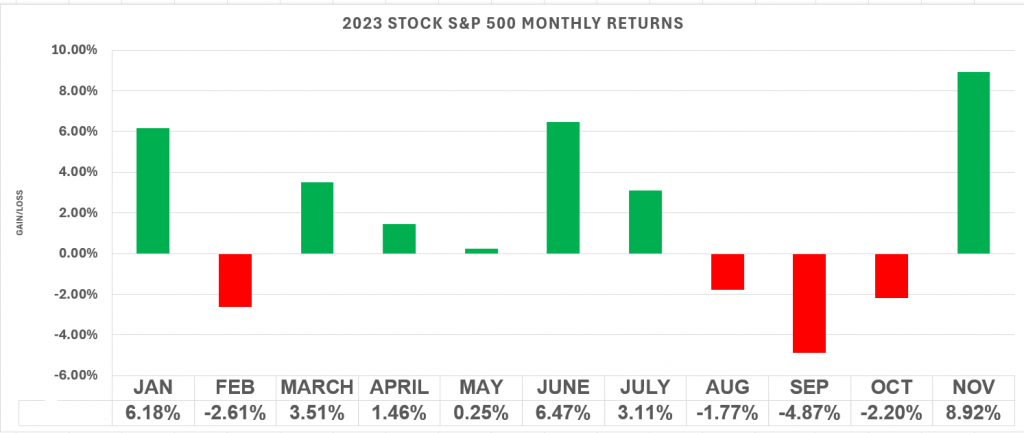
But hold on, there’s more to this story. November of 2023? It was up by more than 8%. Now, when you see November finish that strong, historically, we’ve seen the S&P 500 enjoy an average monthly gain of 1.8% in the aftermath.
Here is what the monthly returns look like for the S&P 500 so far this year.
Now, if we look back in time, all the way to 1950, what do we see? Well, the first half of December, it’s traditionally been a bit of a snooze fest for stocks. They’ve been, dare I say it, flat or even taking a tumble on average during that time. But hold onto your stockings, because once we hit the second half of December, that’s when the real action happens.
On average, my friends, that’s when we see the rally, the true spirit of the season, kick in. It’s like the market’s way of saying, “Okay, we’ve had our appetizers, now bring on the feast!” But I’ve got to be honest with you, in the past five years, well, 40% of the time the rally hasn’t shown up like it used to.
So, there you have it, the second half of December, historically speaking, that’s where the party’s at. But as always, in this ever-changing world of finance, we’ve got to keep our eyes peeled on any surprises that might be lurking around the corner.
So, all signs point to a potentially merry December ahead. But as always, in the world of finance, we’ve got to keep our eyes peeled on any surprises that might come our way. Santa’s on his way, but we’ll just have to wait and see if he brings those gifts of gains with him.
Sure, you want to keep an eye on this Santa Claus Rally business, because it’s got a track record, no doubt about it. But here’s the deal – you have to take a step back and look at the whole darn picture. You can’t just rely on this one rally to make all your trading decisions. There’s a whole slew of important data points out there that can sway the market one way or another.
So, yes, pay attention to the Santa Claus Rally, but remember, it’s just one piece of the puzzle. To be a successful trader, you have to consider all the factors in play. That’s the name of the game. And that is why artificial intelligence is so essential in trading.
In conclusion, the Santa Claus Rally is a captivating phenomenon that has captured the hearts and minds of investors for decades. Its historical trends and potential predictive value make it a topic of fascination for analysts and traders.
In today’s fast-paced world of trading, where markets move at lightning speed and risks can materialize in the blink of an eye, artificial intelligence has become nothing short of essential. AI systems are like the watchful guardians of modern traders, providing critical insights and executing actions with precision that’s simply beyond human capacity. They keep traders on the right side of the right trend at the right time, making split-second decisions that can mean the difference between profit and loss. These AI-powered tools don’t just offer speed; they also excel at risk mitigation, identifying potential pitfalls and offering proactive solutions to navigate the treacherous waters of the financial markets. In essence, AI has become the indispensable ally for traders, ensuring they stay ahead of the curve, harnessing opportunities, and safeguarding against the unexpected, ultimately enhancing their chances of success in the ever-evolving landscape of trading.
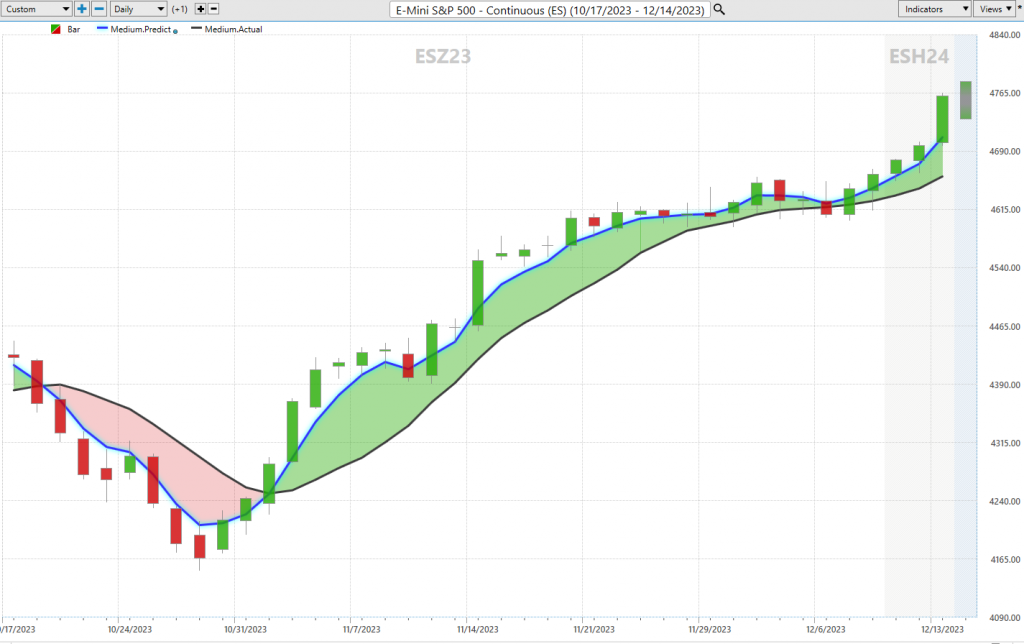
Take a look at this current chart of the S&P 500 over the last several months. Regardless of what was “HEADLINE NEWS” the ai kept traders focused on the dominant trend.
What I’m about to say applies to every trader out there, regardless of how sharp you think you are. Making sense of the intricate dance that is the financial market and crafting a decision-making process that’s both profitable and consistently reliable, well, it’s one heck of a challenge.
Now, here’s the secret sauce that top traders are tapping into the power of artificial intelligence to fine-tune their timing and trend analysis. It’s all about distinguishing between two little words: “IS” and “SHOULD.”
You see, successful trading, it’s not about what “SHOULD” happen; it’s about what “IS” happening right now. You might come across a stock with an irresistible story, a stellar management team, sky-high earnings, and all the bells and whistles, but if those elements aren’t showing up in the price action, well, then you’re stuck in the “SHOULD” mindset, my friends. And let me tell you, “SHOULD” has caused more losses in trading than any other word in the book.
I’ve lost count of the times I’ve heard a trader rattle off all the reasons why they’re heavily invested in a stock, solely because of a fantastic story, even when that stock is clearly in a solid downtrend. It’s downright painful to witness.
But here’s where the real magic comes in – neural networks, artificial intelligence, and machine learning, they’re all about pattern recognition, about spotting those trends and changes in forecast that might elude the human eye. We might not always understand the “why” behind it, but who cares when you can seize the opportunity it presents? That’s the beauty of these technologies, my friends – they help us capitalize on what “IS” happening, and that’s what counts in the game of trading.
Mistakes are financially costly but for machine learning, it is the pathway to mastery and excellence. The real education in trading always lies in learning from the losers.
Most humans have a really hard time learning from bad experiences. The ego gets in the way, every time.
Since artificial intelligence has beaten humans in Poker, Chess, Jeopardy and Go! do you really think trading is any different?
Knowledge. Useful knowledge. And its application is what A.I. delivers.
Intrigued? You should find out. Join us for a FREE Live Training.
Discover why artificial intelligence is the solution professional traders go-to for less risk, more rewards, and guaranteed peace of mind.
Visit with us and check out the A.I. at our Next Live Training.
It’s not magic.
It’s machine learning.
Make it count.
THERE IS A SUBSTANTIAL RISK OF LOSS ASSOCIATED WITH TRADING. ONLY RISK CAPITAL SHOULD BE USED TO TRADE. TRADING STOCKS, FUTURES, OPTIONS, FOREX, AND ETFs IS NOT SUITABLE FOR EVERYONE.IMPORTANT NOTICE!
DISCLAIMER: STOCKS, FUTURES, OPTIONS, ETFs AND CURRENCY TRADING ALL HAVE LARGE POTENTIAL REWARDS, BUT THEY ALSO HAVE LARGE POTENTIAL RISK. YOU MUST BE AWARE OF THE RISKS AND BE WILLING TO ACCEPT THEM IN ORDER TO INVEST IN THESE MARKETS. DON’T TRADE WITH MONEY YOU CAN’T AFFORD TO LOSE. THIS ARTICLE AND WEBSITE IS NEITHER A SOLICITATION NOR AN OFFER TO BUY/SELL FUTURES, OPTIONS, STOCKS, OR CURRENCIES. NO REPRESENTATION IS BEING MADE THAT ANY ACCOUNT WILL OR IS LIKELY TO ACHIEVE PROFITS OR LOSSES SIMILAR TO THOSE DISCUSSED ON THIS ARTICLE OR WEBSITE. THE PAST PERFORMANCE OF ANY TRADING SYSTEM OR METHODOLOGY IS NOT NECESSARILY INDICATIVE OF FUTURE RESULTS. CFTC RULE 4.41 – HYPOTHETICAL OR SIMULATED PERFORMANCE RESULTS HAVE CERTAIN LIMITATIONS. UNLIKE AN ACTUAL PERFORMANCE RECORD, SIMULATED RESULTS DO NOT REPRESENT ACTUAL TRADING. ALSO, SINCE THE TRADES HAVE NOT BEEN EXECUTED, THE RESULTS MAY HAVE UNDER-OR-OVER COMPENSATED FOR THE IMPACT, IF ANY, OF CERTAIN MARKET FACTORS, SUCH AS LACK OF LIQUIDITY. SIMULATED TRADING PROGRAMS IN GENERAL ARE ALSO SUBJECT TO THE FACT THAT THEY ARE DESIGNED WITH THE BENEFIT OF HINDSIGHT. NO REPRESENTATION IS BEING MADE THAT ANY ACCOUNT WILL OR IS LIKELY TO ACHIEVE PROFIT OR LOSSES SIMILAR TO THOSE SHOWN.


