









Welcome to the Artificial Intelligence Outlook for Forex trading.
VIDEO TRANSCRIPT
US Dollar
VantagePoint A.I. Market Outlook
Okay, hello everyone, and welcome back.
My name is Greg Firman, and this is the VantagePoint AI Market Outlook for the week of July 6, 2026.
Now, this week we’re going to do things a little bit differently here in the outlook, looking forward into next week’s trading at a couple of ETFs, a few stocks, some forex pairs, and, of course, gold and that very important U.S. dollar.
U.S. Dollar
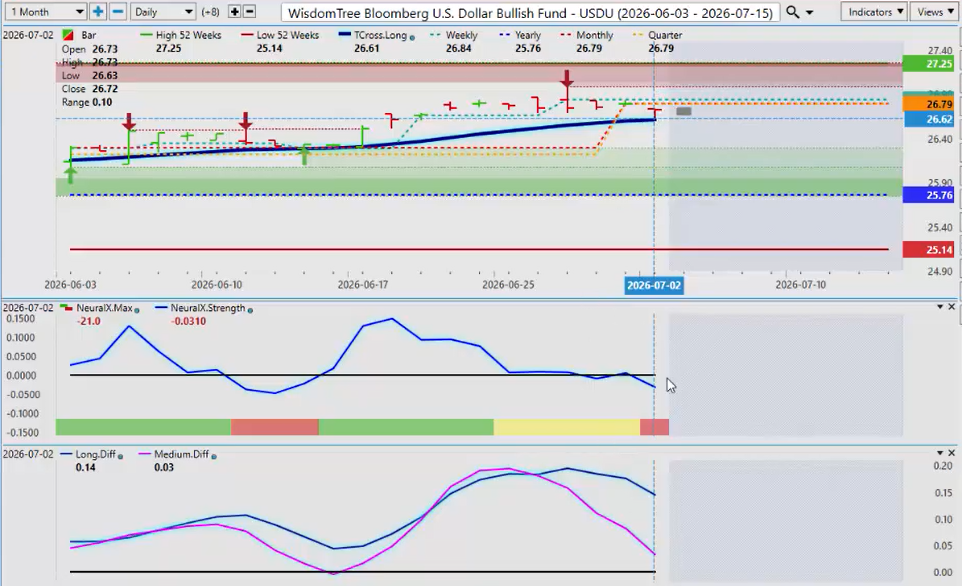
Now, starting with the dollar, once again, a pretty terrible labor report coming out of the U.S. this week. 57,000 jobs created. The estimate, 115.
By no stretch of the imagination does that suggest a rate hike is coming. That would be a rate cut here, guys.
So, again, also downward revisions to those numbers. So, again, I don’t think the Fed is going to be in any position whatsoever to be even staying on hold.
I believe a cut is coming before year end. So, with that said, that should put pressure on the U.S. dollar this coming week.
The TCross Long 26.61, a critical level of support.
You can see that I have my medium-term crossover strength as the pink line. The long-term crossover strength is the dark blue line.
Back here several days ago, before that payroll announcement came out, this was already showing we were going to have, at the very minimum, a corrective move back to the TCross Long. That is completed.
Now, if we close below that critical level of 26.61, that would suggest the dollar is going to come under further selling pressure, at least in the month of July.
So, again, we’ll be watching this very closely. I’ll update everybody on a weekly basis.
But for now, again, it would imply that we are moving lower now going into next week’s trading because, once again here, guys, this is an outlook, not a recap of something that has already taken place where we’re forward-looking into next week.
That’s why it’s labeled an outlook.
Gold
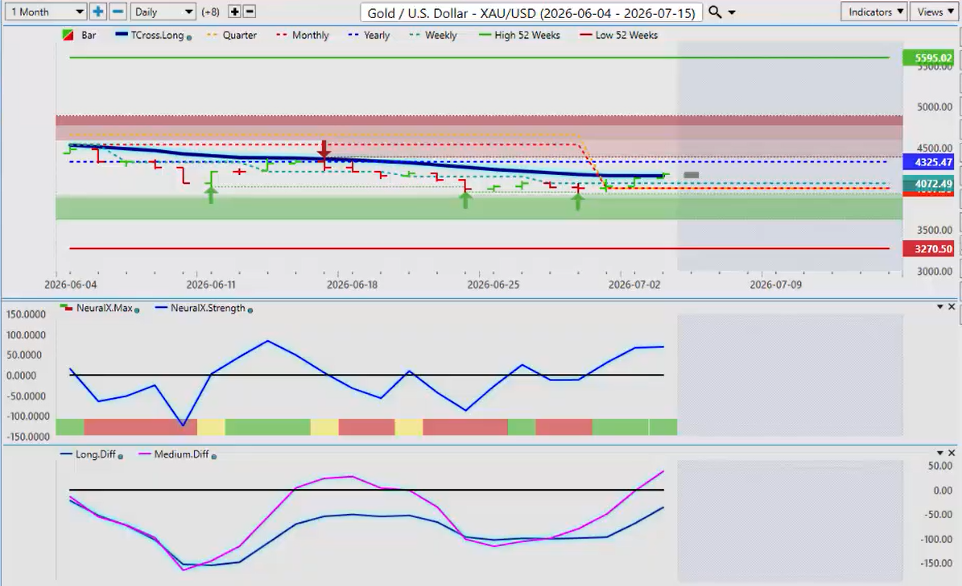
So, right now Gold has slipped and closed just above our TCross Long at 4,158.
If I’m correct and the Fed will be forced to at least stay on hold and potentially cut, that heavily favors the upside here for gold.
So, again, closing out the week 4,175, $20 approximately above our TCross Long.
We’re down at the lower end of the 52-week high-low.
So, the next major hurdle gold is going to face is the calendar yearly opening price. That price is coming in at 4,325.47.
So, again, a critical level that it must break above, but at the very least here, I believe we’re going to test that.
Our MA Diff Cross has taken place. We have a medium-term crossover has occurred, and the Neural Index strength is pointing up with the close above the TCross Long so far on the month and starting the new quarter.
Look, gold looks very bullish.
Global X DAX ETF
Now, this should help some of the major indices, the S&P, the Q’s, the Russell, and, of course, for my good friends in Germany, the DAX.
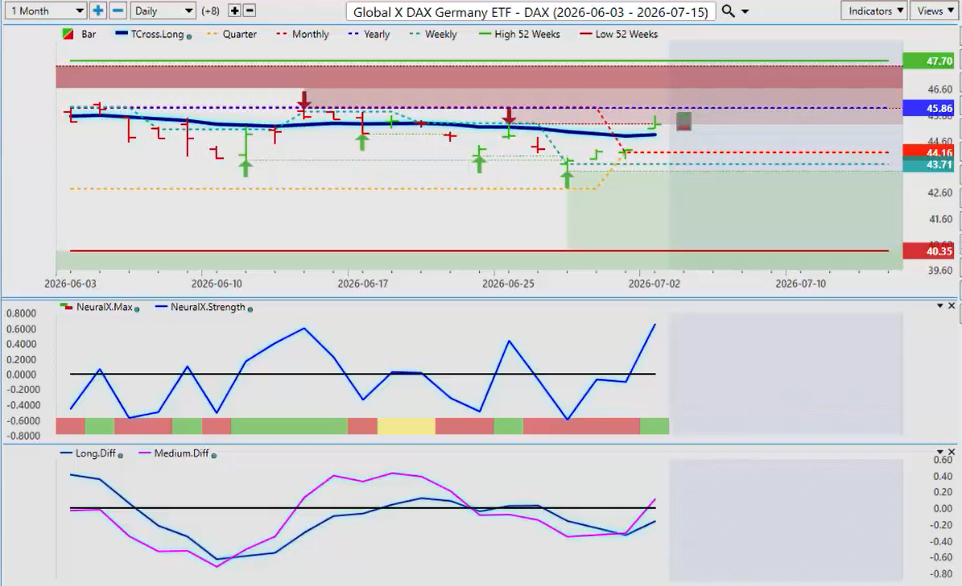
So, the Global X DAX ETF, right now, we have closed above our TCross Long, 44.85.
Now we will be likely targeting 45.86.
Always remember this has a high correlation to the Euro/U.S. forex pair, which I’ll talk about in a moment.
But if the Euro/U.S. moves higher, it should further help the DAX move up also.
Bitcoin
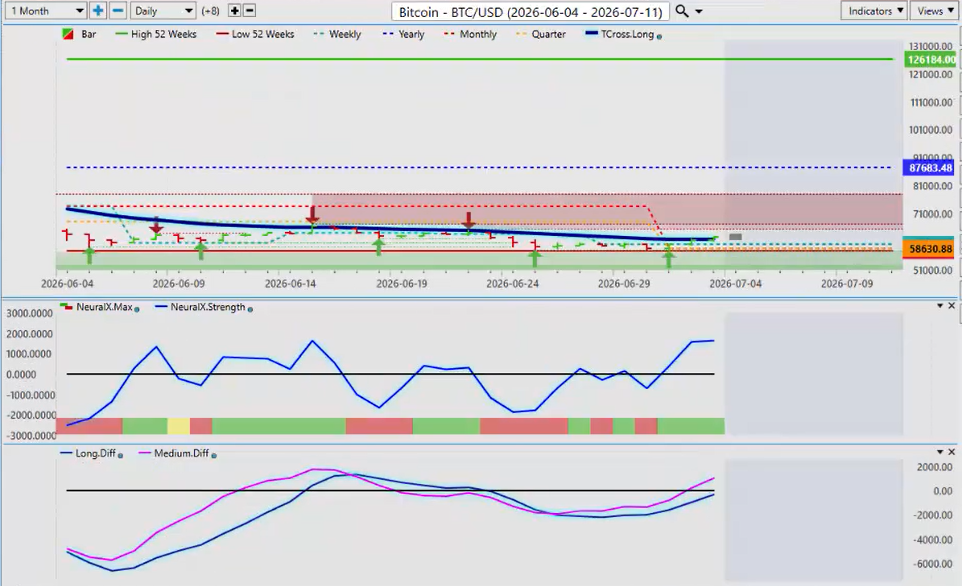
Now, when we look at Bitcoin going into next week, I believe Bitcoin will still be under a little bit of selling pressure up until its normal time, from its seasonal standpoint, in mid-September and October.
But right now we have set a new 52-week low, 58,374.
Now, what is very interesting here is that we have closed above the TCross Long, 61,871.
That is the major support for this coming week.
This looks very bullish, guys.
We’ve got a medium-term crossover to the upside. The long-term crossover is attempting to go too.
But, once again, July is not a bad month for Bitcoin.
Now, I don’t think August will be the best month for it, but it might be.
But we’ll get to August in August.
For now, at the beginning of July and the start of the new quarter, there is some bullish momentum building on this.
But, again, to be very clear, without the confusion of 50 indicators on here, I need to just watch that level of 61,871.
Either way, my view is by year end we are targeting back up to the yearly opening price, or above, at 87,683.
Main Forex Pairs
Now, as we come into some of our main forex pairs, again, if we look at the dollar index or the dollar from a global standpoint, that’s why I’m using the WisdomTree USDU. I believe that the dollar index futures contracts are becoming antiquated, that they’re too heavily tied to the euro. It’s not looking at a broader perspective like the USDU ETF.
Even the Global X DAX ETF is very useful, and it weeds out some of that unwanted volatility.
British Pound
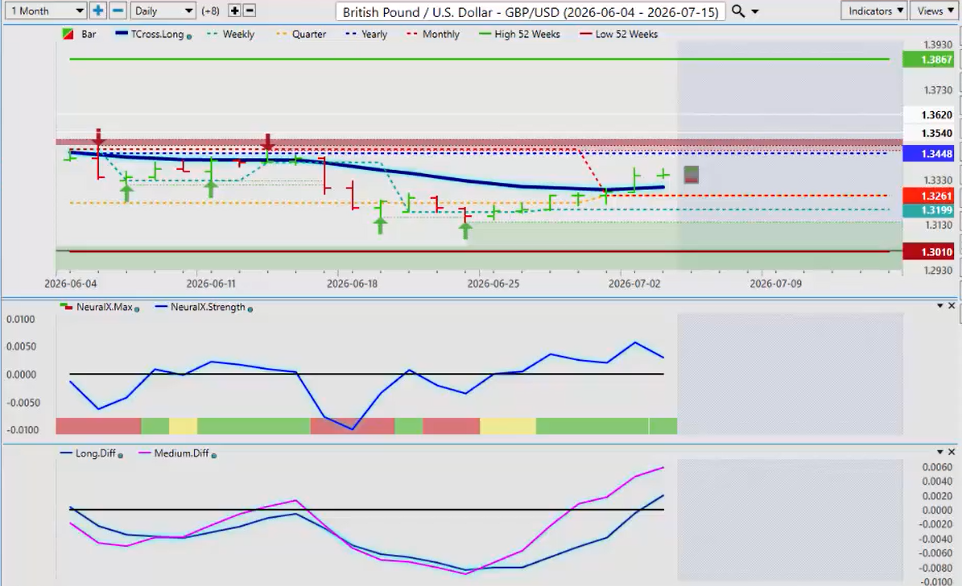
So, again, the British Pound has broken above our TCross Long going into the third quarter.
If we can hold above the monthly opening price and the TCross Long, we should be able to push back, at the very minimum, back to 1.3448.
But in this week’s presentation, I’m focusing on four U.S. dollar-based pairs that are equally weighted on different types of dollar index calculations.
So, again, this is saying that, surprisingly, with what’s going on in the U.K., losing another prime minister, I believe they’re up to six now in the last nine years or something. A crazy number, but either way, the market likes it.
So, again, if we can hold above that, we should extend higher.
Australian Dollar (AUD/USD)
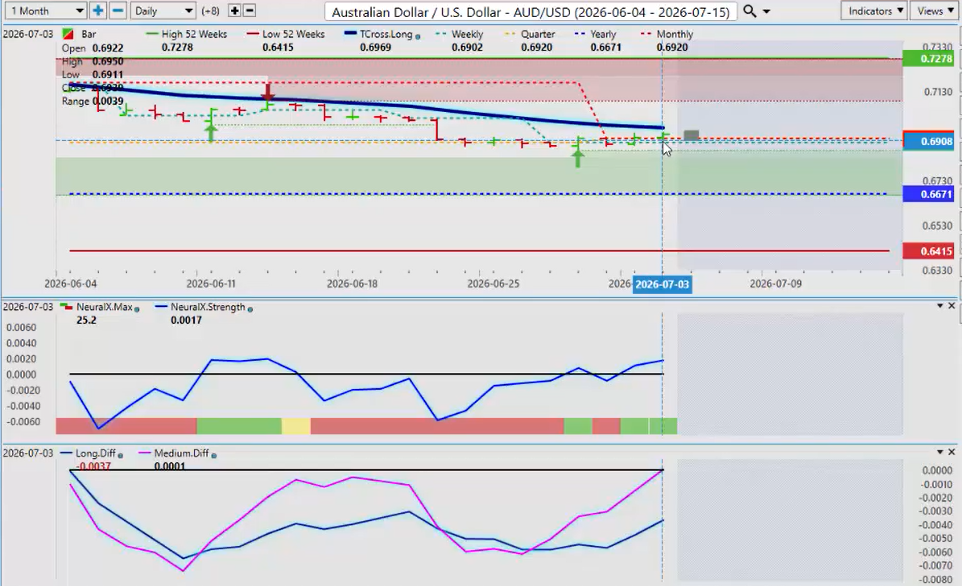
Now, I believe there to be very good value in the Australian Dollar.
Now, the Aussie and the Kiwi don’t always do that well in July and August, and I don’t believe any of these will do very well in September because that’s the U.S. fiscal year end, September 30th, and we know dollar strength is coming at that time.
But we’re quite a ways away from September.
So, right now, looking at this, the Aussie, I believe we will break above that TCross Long at 69.96.
And one of the reasons I’m saying that is the high correlation to the Q’s, the S&P 500, the general broader stock market.
If it’s moving up, which I believe it will in July, barring any outcome between the U.S. and Iran and Israel—I have no control over that—but historically July is a pretty decent month for the equity market.
So, if that’s the case, it should help the Aussie push higher.
Euro (EUR/USD)
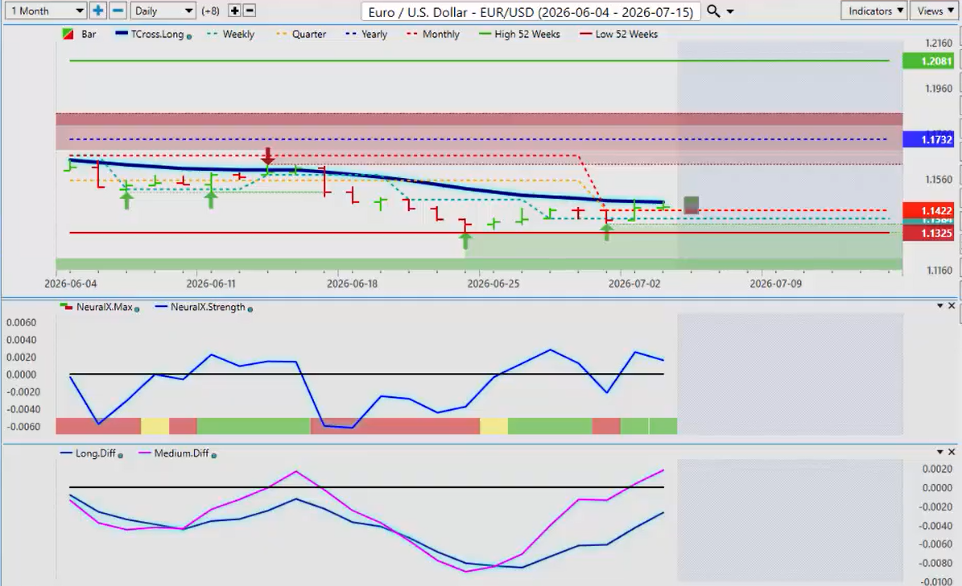
The Euro. All eyes will be on this one next week.
If we pull back, or we have a minor sell-off on Monday after the holiday long weekend, then I believe that is a buying opportunity.
Our 52-week low is in place at 1.1325.
And, again, we just have to break through that TCross Long at 1.1456.
Then we can retarget the calendar yearly opening price at 1.1732.
I believe that to be in the cards.
U.S. Dollar / Japanese Yen (USD/JPY)
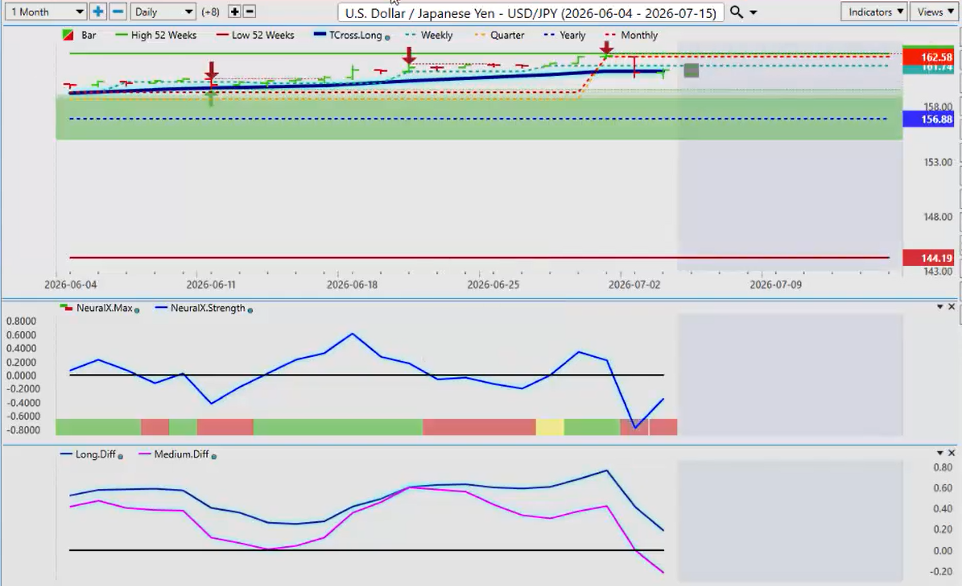
Now, when we look at the U.S. Dollar/Japanese Yen, the main carry trade here, you can see that the market made another 52-week high on this thing this past week, but it’s been dropping ever since that payroll number.
I don’t know if it will be enough to change people’s minds about the carry trade, meaning long dollar, short the yen, the funding currency.
We’ll see on this one, but the TCross Long is very important in this particular scenario.
There is very little confusion in this chart.
If we, and the market, can break down below that TCross Long at 161.27, you’ve got a broader move to the downside coming, potentially back to the 156.88 area.
And, again, based on economics, I don’t see any reason for the Fed to be even considering rate hikes when you’re doing a mere 57,000 jobs for the biggest economy in the world, and you have downward revisions to the previous month.
So, again, we break down below that, we should be able to move lower.
Now, changing up the AI Weekly Outlook to make it more balanced, a little bit of stocks, a little bit of ETFs, a little bit of forex, and some futures contracts, I think is relevant.
So, we’re going to look at the ETF side.
Pacer US Cash Cows ETF (COWZ)
Now, changing up the AI Weekly Outlook to make it more balanced, a little bit of stocks, a little bit of ETFs, a little bit of forex, and some futures contracts, I think is relevant.
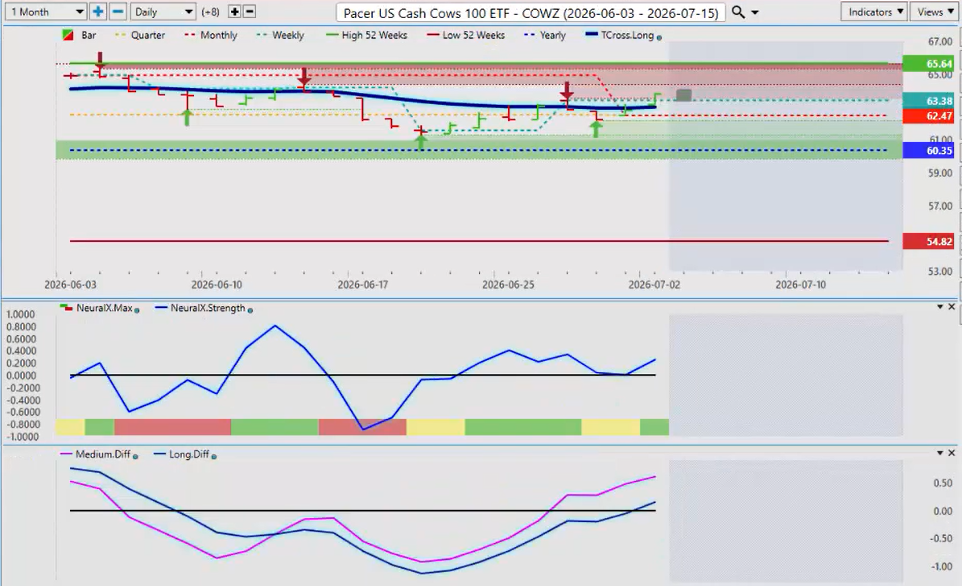
So, we’re going to look at the ETF side, the COW. I thought the Pacer U.S. Cash Cows was kind of a funny one, but this is what we look for, guys.
Now, with the TCross Long, you can see that, again, it’s been trying to turn bullish.
We’re very close to the yearly opening price, 60.35, but this is forecasted to now go higher.
And I would argue this, probably the $66 a share mark would be a pretty decent target for this, or maybe a little bit higher.
But, again, we’ve come up, we’ve failed, we’ve come back down.
But starting the new quarter, guys, again, we want to leave everything that happened in the first and second quarter behind us and focus going forward.
And, again, like I said, this is an outlook for next week, not a recap of something that’s already happened.
We want to see in real time how VantagePoint really works.
So, again, that TCross Long is coming in at $63 a share.
That is a reasonable area to buy this.
The monthly opening, quarterly opening price, 62.47.
I’m hoping I’ll get a little bit of a retracement next week, but that retracement will have absolutely nothing to do with bands, channels, Fibonacci, none of those things, guys.
The monthly opening price and the TCross Long, that will tell the tale.
And is there a seasonal attached to this ETF?
Yes, there is.
It predominantly, like the other stocks I was talking about, usually does quite well.
Nothing’s 100%, but there’s a higher probability to the upside than the downside.
So, you watch that level very closely.
Regency Centers (REG)
Now, a couple of little stocks we can look at.
Well, maybe not little, but, again, REG, which is Regency Centers.
Again, a very interesting stock.
I’m seeing this across the board in the stock markets, guys.
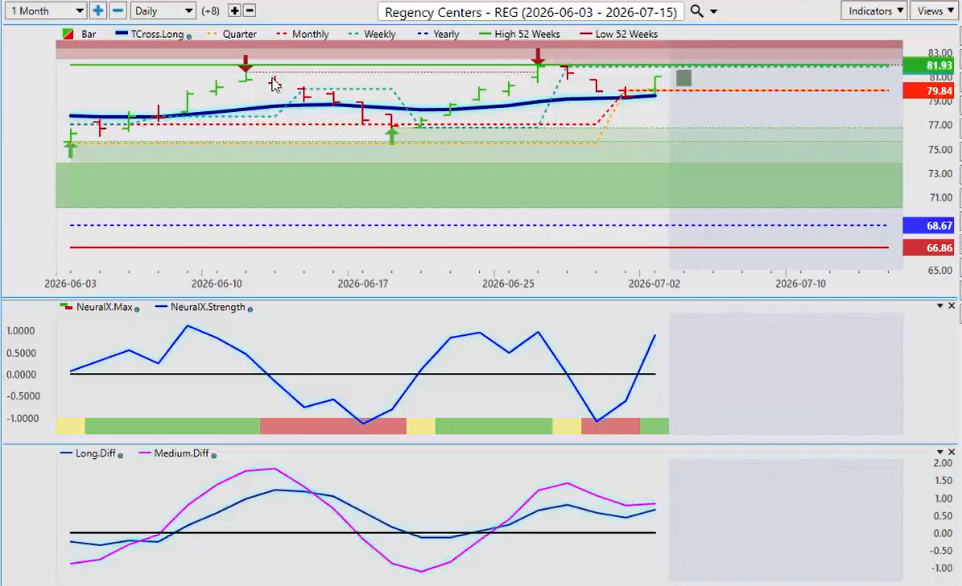
All these stocks hitting new 52-week highs.
And people will often say to me, “Well, can you really buy it when it just made a new 52-week high?”
And I believe the answer to that is yes, after a minor retracement.
So, we’ve made another 52-week high.
We did that on June 26, but we also made a new high on June 11.
And this is where it gets interesting.
We’re coming off the month of June, but we’re starting a new quarter.
So, as we start the new quarter, you can see that right out of the gate, we’re right on the TCross Long.
Then, we opened on the TCross Long again on Thursday.
And this TCross Long is suggesting, “Okay, wait a minute. I think we can maybe move up a little bit here.”
So, my view is that we have a very strong possibility of hitting into at least the $86 a share mark, maybe a little bit more.
The VP indicators are confirming that.
But that TCross Long, combined with the new quarterly and monthly opening prices.
And, again, the primary trend on this stock, guys, is indisputable.
It’s up.
68.67 is the calendar yearly opening price.
When we look at this stock over the last six months, this is what we see back into January.
A nice bull run up.
It has its little dips, comes back up, makes a new high, dips back down, comes up and makes another new high, and now we’re back up here again.
Now, this could be deemed uncomfortable for some to buy a stock that’s this high.
But the reality is, guys, that the primary trend is up.
And if you’re comfortable in trading, it’s sort of like golf.
Whenever I get comfortable in golf, I play terrible.
When I’m uncomfortable, then I must be doing something right.
So, yes, I would be a little uncomfortable up here, but I believe that there’s a play.
Apple (AAPL)
Now, Apple is a stock that I’ve been buying in the month of July for years, at least the last five years, guys.
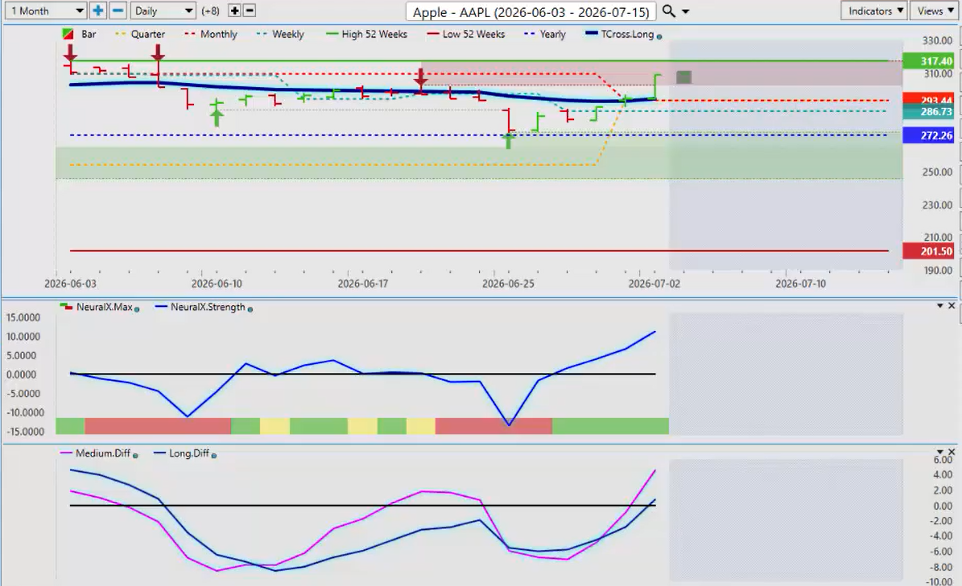
So, again, you can see the market comes down, and this is how we know what a real trend is, guys.
Yes, we’re below the TCross Long, but we’re positive on the calendar year.
We came right down, and you can see that the low of 273.75.
The yearly opening price on this particular stock is coming in at 272.26, as you can see right there.
So, the market looks at that and says, “Oh, there’s a buying opportunity.”
But here’s the thing, guys.
When we started the new quarter in July, this was bullish right out of the gate.
This was phenomenally bullish coming off the yearly opening price.
But there’s still a play here, right?
And now we’ve closed above the TCross Long.
And you can see that the market, there’s somebody in here waiting to buy this.
And very often numerous false signals will occur prior to something like this happening.
But the seasonal in Apple is that, at least for the last five years, guys, Apple has gone up 100% of the time in the month of July.
So, I believe a reasonable target.
I think we may set a new 52-week high here.
And that would be up around the 322 per share mark, maybe a little bit higher.
And this coming even after the price increases, which absolutely—what is the price increase?
It brings more revenue into Apple.
So, love Apple or hate Apple, there’s a trade there.
So, a little bit of a change.
And each week now, to keep things fresh and moving along, I will make these little adjustments each week to show what’s happening, what we’re looking at for the coming week because it’s very important to look forward and not backwards.
So, with that said, this is the VantagePoint AI Market Outlook for the week of July. 6th, 2026.


